ISSN: 2252-8938 113
Optimal Placement of SVC Using Fuzzy and Firefly Algorithm
P. Suresh Babu, P.B. Chennaiah, M. Sreehari
Department of Electrical and Computer Engineering, AITS Rajampet
Article Info ABSTRACT
Article history:
Received August 2, 2015 Revised Oct 6, 2015 Accepted Nov 12, 2015
Voltage stability is major phenomena in any power system network for reliability and continuity operation. But the tight operation of power system due to overloading or fault on the system which is evitable and major threat to the power system. So it is necessary to maintain the voltages within the constraints at the overloading conditions also by placing of Static VAR Compensator (SVC) at optimal locations. New approaches are used to find the placement and size of the SVC at different locations. Fuzzy is used to find the location and the size of the SVC is fined by the Firefly algorithm. This paper considers different loading conditions of the power system network (125,150,175over loading conditions). From the results we can conclude that the power losses are reduced and the voltages can be maintained within the limits .IEEE 14 bus, IEEE 30 bus system is taken for the implementing the above techniques.
Keyword: Firefly algorithm Fuzzy approach SVC placement
Copyright © 2015 Institute of Advanced Engineering and Science. All rights reserved.
Corresponding Author: P. Suresh Babu,
Department of Electrical and Computer Engineering, AITS Rajampet.
Email: [email protected]
1. INTRODUCTION
The unpredictable demand has been changed the individual living in the recent years with the development of technologies. These considerations throw cautions on transmission system against congestion, line loss and voltage instability [1]-[6].Over loading, faults and the shortage of reactive power are the main reasons for voltage collapse. There is one old method for to overcome these problems that is providing the additional transmission line. There is one more alternative advanced technical solution that is FACTS control which is used for better control purpose of reactive power. Additionally FACTS can control the line parameters such as voltage, voltage angle and line reactance. It is necessary to select the most favorable device for compensation and placing it optimally in literature. For placement of SVC many approaches are used, such as loss sensitivity index in [2]-[3], where it is placed in the most negative index. An approach is used in [4] named as Voltage stability index (VSI) is defined for placement of SVC. In [5]-[6] for providing placement genetic algorithm (GA) is used. In this paper SVC is used for shunt compensation. It is a static VAR Generator or absorber connected in shunt whose output is adjusted to exchange inductive or capacitive current so as to provide voltage support only and it can also reduce power losses when installed in a proper location. Best optimal locations can be given by the Fuzzy approach depending on the objectives considered, and Firefly techniques iteratively optimize the sizes of the devices for the concerned locations. A MATLAB code is developed for the proposed approach and applied to IEEE 14, 30 bus system and the results are tabulated.
2. MODELING OF SVC
In the basic form of SVC it is a thyristor controlled reactor which is combination of capacitor connected parallel. SVC resembles in the working point of view as a variable reactor which generates or absorbs the reactive power. It is mainly used for voltage regulation. It is an important component to voltage
Figure 1. Injection Model of SVC
3. FINDING OPTIMAL LOCATION USING FUZZY APPROACH
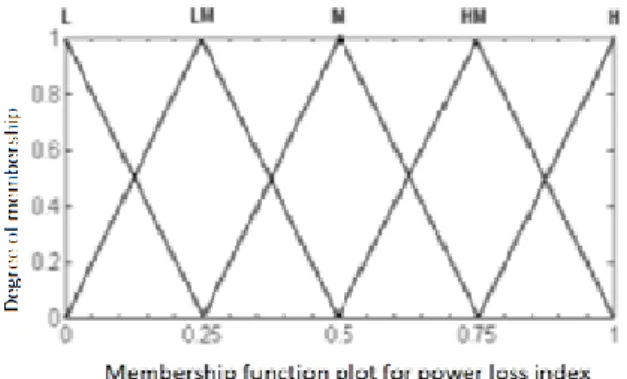
In this paper fuzzy approach is used for optimal location of SVC on load buses [7], two objectives are considered for the development of fuzzy i.e. (i) reducing real power losses (ii) maintaining voltage profile within the allowable limits (0.9p.u–1.1p.u). For writing fuzzy rules two inputs nodal voltage (p.u) and Power loss index (PLI) are taken.
LRi=Pi1-Pi2 (1)
for i = 1 to number of load buses. Where,
LR – Loss Reduction.
Pi1- Real power before compensation.
Pi2 - Real power after compensation at ith node.
Figure 2. Membership Function Plot for Power Loss Index (PLI)
The LR input can be normalized by equation (2), so that the values will be between 0 to 1, where the smallest as 0 and the largest number having a value of 1.
PLi
(2)
Figure 3. Membership Function Plot for Nodal Voltages p.u.
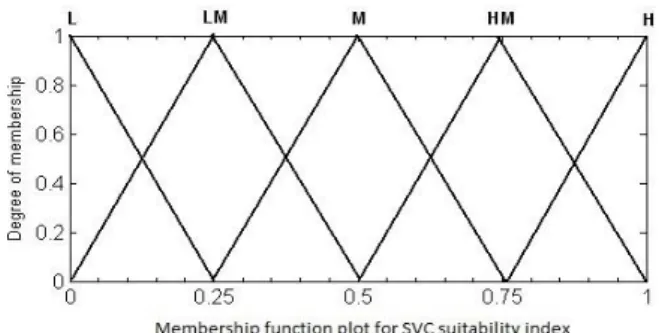
The fuzzy rules are taken from [8]. The output of fuzzy gives the suitability index for SVC placement. Maximum values will be promising locations for SVC placement.
Figure 4. Membership Function Plot for SVC Suitability Index
4. FIREFLY ALGORITHM
Firefly Algorithm (FA) was developed based on natural phenomenal behavior of the firefly by which is used for solving the multimodal optimization problem. There are about thousands of fireflies where the flashes often unique on a particular firefly.
There are three ideal rules are introduced in Firefly development those are 1) All the fireflies are gender-free that is every firefly will attract the other firefly substantive of their sex, 2) Attractiveness depend on their brightness. The less bright one will move towards the brighter one, 3) the landscape of the objective function affects the firefly brightness. Let us consider the continuous constrained optimization problem where the task is to minimize cost function f(x). Firefly algorithm is a speedily converging algorithm. The algorithm gives solution that depends on the selection of swarm size, maximum attractiveness value, the absorption coefficient value and the iteration limit. The basic steps of the Firefly can be summarized as the pseudo code [10, 11].
Pseudo code of Firefly Algorithm Objective function
f(x), x = (x1,…,xd)T
Generate initial population of fireflies xii ( i=1, 2…, n)
Light intensity Iii at xii is determined by f (xii) Define light absorption coefficient γ
while ( t < MaxGeneration) for ii = 1: n all n fireflies for jj = 1: ii all n fireflies
if (Ijj > Iii), More firefly ii towards jj in d-dimension; end if Attractiveness varies with distance r
Evaluate new solutions and modify the light intensity end for jj
5.1. Results of 14 bus system
IEEE 14 bus system [12-13] contains 5 generator buses (bus numbers: 1,2,3,6 and 8, 9 load buses (bus numbers: 4, 5, 7,9,10,11,12,13 and 14) and 20 transmission lines. The load is increased by125, 150 and 175%. Optimal location on load buses, rating of SVC and real power losses after SVC placement for different load scenario using Firefly potimization are shown in Table 1. Voltages of 14 bus system for 175% loading shown in table 2.
Table 1. Result for 14 Bus System.
Loading condition Losses without SVC SVC Loc Firefly algorithm
Rating of SVC Losses with SVC
Normal loading 13.393 5,14 5.556
6.952
13.333
125% loading 22.636 5,14 36.93
10.08
22.101
150% loading 35.011 5,14 66.97
13.09
33.769
175% loading 51.295 9,14 58.58
15.94
49.495
Table 2. Voltages of 14 Bus System for 175% Loading Bus no:
Voltages (p.u)
Before SVC After SVC
1 1.0600 1.0600
2 0.9950 1.0050
3 0.9600 0.9600
4 0.9448 0.9729
5 0.9514 0.9756
6 1.0200 1.0600
7 0.9851 1.0565
8 1.0400 1.0900
9 0.9651 1.0720
10 0.9606 1.0568
11 0.9833 1.0523
12 0.9898 1.0393
13 0.9785 1.0351
14 0.9358 1.0477
5.2. Results of 30 bus system
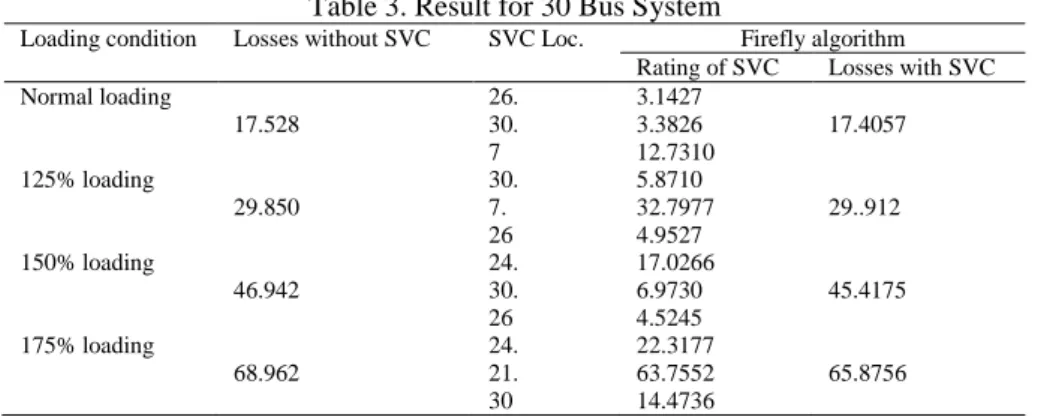
IEEE 30 bus system[12] contains 6 generator buses (bus numbers: 1, 2, 5 ,8, 11, and 13), 24 load buses (bus numbers: 3, 4, 6, 7, 9, 10, 12, 14 ,15, 16, 17, 18, 19, 20, 21, 22, 23, 24, 25, 26, 27, 28, 29 and 30) and 41transmission lines. The load is increased by125, 150 and 175%. Optimal location on load buses, rating of SVC and real power losses after SVC placement for different load scenario using FA are shown in Table 3.
Table 3. Result for 30 Bus System
Loading condition Losses without SVC SVC Loc. Firefly algorithm
Rating of SVC Losses with SVC Normal loading 17.528 26. 30. 7 3.1427 3.3826 12.7310 17.4057 125% loading 29.850 30. 7. 26 5.8710 32.7977 4.9527 29..912 150% loading 46.942 24. 30. 26 17.0266 6.9730 4.5245 45.4175 175% loading 68.962 24. 21. 30 22.3177 63.7552 14.4736 65.8756 6. CONCLUSION
A two-fold approach is used in this paper for finding sizes of SVC devices and optimal locations is presented. Fuzzy approach is used for optimal locations and sizes are obtained through FA method for their optimal rating values are calculated. From results it is observed that for all overloads i.e., 125%, 150% and 175% of normal loading, the voltage profile of the system is increased and maintained within the specified limits, and the real power losses are also reduced.
REFERENCES
[1] Ushasurendra, SS Parthasarathy. Congestion management in deregulated power sector using fuzzy based optimal location technique for series FACTS devices. Journal of Electrical and Electronics Engineering Research, 2012; 4(1): 12-20.
[2] Mrinal Ranjan, B Vedik. Optimal locations of FACTS devices in a Power system by means if Sensitivity Analysis.
Journal in Trends in Electrical and Computing Engineering, TECE. 2011; 1(1): 1-9.
[3] G Swapna, J Srinivasa Rao, J Amarnath. Sensitivity approaches to improve transfer capability through optimal [4] Placementof TCSC, SVC. International journal of advances in Engineering and Technology, July 2012,
[5] Kiran kumar K, N Suresh. Enhancement of voltage stability through optimal placement of FACTS controllers in power system. American journal of sustainable cities and society, 2012; 1.
[6] Marouani I, Guesi T, Hadi Abdullah H, Ouali A. Optimal locations of multitype facts devices for multiple
contingencies using genetic algorithms. IEEE 8th International multi-conference on systems, signals and devices,
2011.
[7] S Surendre Reddy, M Sailaja Kumari, M Sydulu. Congestion Management in Deregulated power System by Optimal Choice and allocation of FACTS Controllers using Multi-Objective GA. IEEE 978-1-4244-6547 7/10/2010.
[8] AK Chakraborty, S Majumdar. Active Line Flow Control of power System Network with FACTS Devices of choice using soft computing technique. International journal of computing applications, 2011; 25(9).
[9] XS Yang. Firefly algorithms for multimodal optimization. Stochastic Algorithms: Foundation and Applications SAGA, 2009; 5792: 169-178.
[10] XS Yang. Firefly algorithm, Levy flights and global optimization. In Research and Development in Intelligent Systems XXVI, 2010: 209–218, Springer, London, UK.
[11] XS Yang. Nature-Inspired Meta-Heuristic Algorithms, Luniver Press, Beckington, UK, 2008.
[12] S Lukasik, S Zak. Firefly algorithm for con-tinuous constrained optimization tasks. In Proceedings of the International Conference on Computer and Computational Intelligence (ICCCI ’09), 2009: 97–106, Springer, Wroclaw, Poland.
[13] http://www.ee.washington.edu/research/pstca/.
[14] Optimal Placement of SVC Using Fuzzy and PSO Algorithm. K dhanunjaya babu, M Damodar reddy 1PG Student, Department of E.E.E., S.V. University, Tirupati, Andhra Pradesh, India. 2 Associate Professor, Department of E.E.E., S.V. University, Tirupati, Andhra Pradesh, India