L2hgdh
Deficiency Accumulates
L
-2-Hydroxyglutarate with Progressive
Leukoencephalopathy and
Neurodegeneration
Shenghong Ma,aRenqiang Sun,aBowen Jiang,aJun Gao,b,eWanglong Deng,c Peng Liu,aRuoyu He,dJing Cui,aMinbiao Ji,dWei Yi,ePengyuan Yang,b Xiaohui Wu,aYue Xiong,a,fZilong Qiu,gDan Ye,a,hKun-Liang Guana,i Molecular and Cell Biology Laboratory, Institute of Biomedical Sciences, Shanghai Medical College, Key Laboratory of Metabolism and Molecular Medicine, Ministry of Education, and Department of Biochemistry and Molecular Biology, School of Basic Medical Sciences, State Key Laboratory of Genetic Engineering and National Center for International Research of Development and Disease, Institute of Developmental Biology and Molecular Medicine, Collaborative Innovation Center of Genetics and Development, School of Life Sciences, Fudan University, Shanghai, Chinaa; Department of Chemistry & Institutes of Biomedical Sciences, Fudan University, Shanghai, Chinab; State Key Laboratory of Medical Genomics and Shanghai Institute of Hematology, SJTU-SM, Shanghai, Chinac; State Key Laboratory of Surface Physics and Department of Physics, Fudan University, Shanghai, Chinad; China Novartis Institutes for BioMedical Research Co. Ltd., Shanghai, Chinae; Lineberger Comprehensive Cancer Center, Department of Biochemistry and Biophysics, University of North Carolina at Chapel Hill, Chapel Hill, North Carolina, USAf; Institute of Neuroscience, Key Laboratory of Primate Neurobiology, State Key Laboratory of Neuroscience, CAS Center for Excellence in Brain Science and Intelligence Technology, Shanghai Institutes for Biological Sciences, Chinese Academy of Sciences, Shanghai, Chinag; Department of General Surgery, Huashan Hospital, Fudan University, Shanghai, Chinah; Department of Pharmacology and Moores Cancer Center, University of California San Diego, La Jolla, California, USAi
ABSTRACT L-2-Hydroxyglutarate aciduria (L-2-HGA) is an autosomal recessive neu-rometabolic disorder caused by a mutation in the L-2-hydroxyglutarate dehydroge-nase (L2HGDH) gene. In this study, we generatedL2hgdh knockout (KO) mice and observed a robust increase of L-2-hydroxyglutarate (L-2-HG) levels in multiple tissues. The highest levels of L-2-HG were observed in the brain and testis, with a corresponding increase in histone methylation in these tissues.L2hgdh KO mice exhibit white mat-ter abnormalities, extensive gliosis, microglia-mediated neuroinflammation, and an expansion of oligodendrocyte progenitor cells (OPCs). Moreover, L2hgdh deficiency leads to impaired adult hippocampal neurogenesis and late-onset neurodegenera-tion in mouse brains. Our data provide in vivo evidence that L2hgdh mutation leads to L-2-HG accumulation, leukoencephalopathy, and neurodegeneration in mice, thereby offering new insights into the pathophysiology of L-2-HGA in humans.
KEYWORDS L2HGDH, 2-HG, leukoencephalopathy, gliosis, neurodegeneration
T
he rare, autosomal recessive neurometabolic disordersD-2-hydroxyglutaric aciduria (D-2-HGA) and L-2-hydroxyglutaric aciduria (L-2-HGA) are characterized by the accumulation ofD-2-hydroxyglutarate (D-2-HG) andL-2-hydroxyglutarate (L-2-HG), re-spectively, in body fluids. Genetic characterization has shown that 50% of the D-2-HGA population and the majority of L-2-HGA patients harbor pathogenic mutations in D2HGDH andL2HGDH genes, respectively (1–3). The other half of D-2-HGA patients have a gain-of-function mutation in isocitrate dehydrogenase 2 (IDH2) at the residue of R140 (R140Q), which leads to abnormally high accumulation of D-2-HG (4). Based on phenotypic severity in patients, D-2-HGA is classified as mild type I (D2HGDHmutation) and severe type II (IDH2mutation) (4, 5). Of note, 2-HG concentrations are 2- to 8-fold higher for type II D-2-HGA than type I D-2-HGA patients (4, 6, 7), suggesting thatReceived5 September 2016 Returned for modification4 November 2016 Accepted24 January 2017
Accepted manuscript posted online30 January 2017
CitationMa S, Sun R, Jiang B, Gao J, Deng W, Liu P, He R, Cui J, Ji M, Yi W, Yang P, Wu X, Xiong Y, Qiu Z, Ye D, Guan K-L. 2017.L2hgdh
deficiency accumulatesL-2-hydroxyglutarate with progressive leukoencephalopathy and neurodegeneration. Mol Cell Biol 37:e00492-16. https://doi.org/10.1128/MCB.00492-16.
Copyright© 2017 American Society for Microbiology.All Rights Reserved.
Address correspondence to Zilong Qiu, [email protected], or Dan Ye, [email protected].
endogenous D2HGDH is insufficient to metabolize the excessive D-2-HG produced by mutated IDH2. Compared to D-2-HGA, L-2-HGA is more prevalent and severe and mainly affects the central nervous system (CNS) starting at childhood, leading to progressive hypotonia, tremor, epilepsy, leukoencephalopathy, mental retardation, psychomotor regression, and low-frequency brain tumors (8–10). The neurological symptoms in L-2-HGA patients may be due to the toxicity from L-2-HG accumulation, although the underlying mechanisms are largely unclear.
Emerging evidence has indicated that mitochondrial dysfunction and impairment of oxidative phosphorylation (OXPHOS) are involved in the pathology of various organic acidemias. Recently, 2-HG has been reported to impair the activities of two enzymes in OXPHOS, including cytochromecoxidase and ATP synthase (11, 12), but whether the pathogenesis of 2-HGA is associated with impairment of OXPHOS remains unknown. Furthermore, 2-HG is now considered an oncometabolite (13–16), and numerous studies indicate that altered epigenetic regulation is a major mechanism underlying its oncogenic activity. The structural similarity of 2-HG to␣-ketoglutarate (␣-KG) enables it to act as an ␣-KG analog and inhibit the activity of multiple ␣-KG-dependent dioxygenases, including the JmjC domain-containing histone demethylases and the TET (ten-eleven translocation) family of cytidine hydroxylases (13, 17–19). Supporting this notion, a mouseIdh1-R132Hknock-in study reveals increases of both DNA and histone methy-lations (3). In vitrostudies demonstrate that L-2-HG is more potent than D-2-HG in suppressing the activity of␣-KG-dependent dioxygenases (13, 17).
Although it has been over 30 years since the first report of L-2-HGA, the progression of the disease is poorly understood and little is known about its long-term impact on neural development and neural activity (20). Recently, Rzem et al. constructed an L2hgdh deletion mouse model and found extensive vacuolations in the central nervous system (CNS) (21). To study the biochemical and pathophysiological con-sequences of L-2-HG accumulation, we created L2hgdh knockout (KO) mice by piggyBac transposon-mediated insertion mutation of the L2hgdhgene. Our data demonstrate an age-dependent accumulation of L-2-HG in the cerebrum and altera-tions in a subset of histone methylaaltera-tions in the CNS ofL2hgdhKO mice. Importantly, L2hgdh KO mice exhibit subcortical white matter abnormalities, recapitulating the typical clinical features of L-2-HGA patients. Moreover,L2hgdh KO mice exhibit dys/ demyelination, extensive gliosis, expanded cell numbers of oligodendrocyte progenitor cells (OPCs), and microglia-mediated neuroinflammation. Finally,L2hgdhKO mice also show impaired adult hippocampal neurogenesis as well as age-dependent neurode-generation.
RESULTS
L2hgdh deficiency causes 2-HG accumulation, reduced body weight, and pre-mature death in mice.To understand the pathophysiology of L-2-HGA, we generated an L-2-HGA mouse model in which theL2hgdhgene was disrupted by insertion of a piggyback (PB) transposon between exon 1 and exon 2 (see Fig. S1 in the supplemental material). Western blot analysis demonstrated expression of L2ghdh protein across diverse mouse tissues (Fig. S2). Heterozygous insertion of the PB transposon led to reduced L2hgdh protein expression, whereas homozygous insertion resulted in a complete loss of L2hgdh protein in a variety of mouse tissues tested (Fig. 1A), confirming the deletion and functional inactivation of theL2hgdhgene.
FIG 1Deletion ofL2hgdhleads to 2-HG accumulation, reduced body weight, and premature death in mice. (A) L2hgdh protein is diminished inL2hgdh⫺/⫺mice. Western blotting of L2hgdh in tissues from cerebrum, testis, liver, kidney, and
Notably, we found an age-dependent increase of L-2-HG level in the cerebrum of postnatal L2hgdh KO mice (Fig. 1E). The L-2-HG level in the cerebrum was about 1 mmol/kg tissue weight at neonatal day 1, gradually increased to about 4 mmol/kg tissue weight at day 14, and thereafter was maintained at a high steady-state level (Fig. 1E). NeonatalL2hgdhKO mice exhibited no overt structural or cellular defects in the brain (data not shown).
Strikingly,L2hgdhKO but not wild-type mice older than 6 months exhibited a significant loss in body weight, decreasing by 30% in 1-year-old L2hgdh KO mice compared to wild-type controls (Fig. 1F). Time domain-nuclear magnetic resonance (TD-NMR) analysis revealed that loss of body weight was largely attributed to reduced fat content in older L2hgdhKO mice (Fig. 1G). Furthermore, the motor activity ofL2hgdhKO mice and their wild-type littermates was evaluated with the open field test (OFT), and no difference in the moving distance was found between youngL2hgdhKO mice and their wild-type littermates aged 16 to 24 weeks (Fig. 1H). In contrast, the distance moved by older L2hgdh KO mice was significantly decreased compared to that of their wild-type littermates aged 45 to 55 weeks (Fig. 1H). We also found that the majority ofL2hgdhKO mice (n⫽18 of 19) died at the age of 48 to 72 weeks (12 to 18 months), while most of the wild-type littermates were still alive at the same age (Fig. 1I). Collectively, these data indicate that deletion ofL2hgdhleads to reduced motor activity, reduced body weight, and premature death in mice.
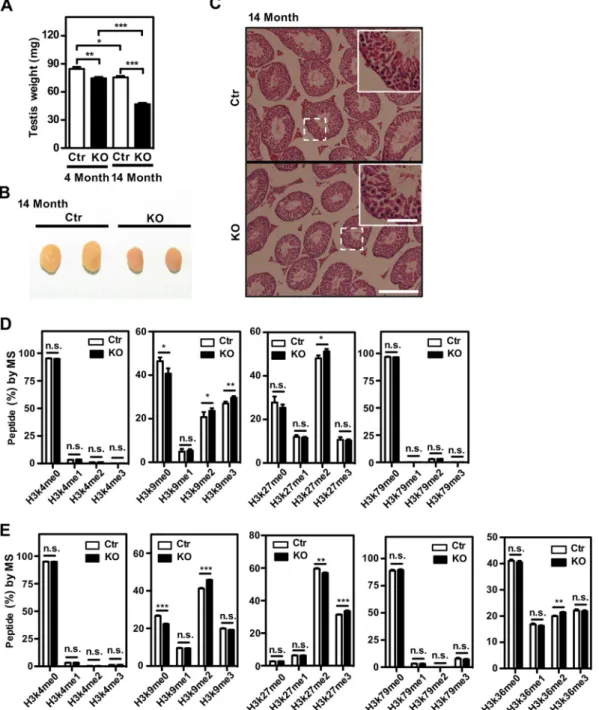
L2hgdh deficiency results in testicular atrophy and selective changes in his-tone methylation.Our observation that L-2-HG was most abundant in the testis and brain of L2hgdh KO mice (Fig. 1D) prompted us to examine the pathophysiological consequences of L-2-HG accumulation in these two tissue types. We found thatL2hgdh KO mice exhibited testicular atrophy and that this phenotype was exacerbated at an advanced age (Fig. 2A and B). Histological analysis showed that the seminiferous tubules had normal anatomy and spermatogenesis inL2hgdhKO mice compared to the wild-type controls (Fig. 2C).L2hgdhKO male mice were fertile but less potent than their wild-type littermates (data not shown). Together, these data indicate that L2hgdh deficiency and high L-2-HG accumulation affect the organ size but not the develop-ment of the testis.
It is known that 2-HG acts as an ␣-KG antagonist to inhibit the activity of␣ -KG-dependent dioxygenases, including the JmjC domain-containing histone demethylases and the TET family of DNA cytidine hydroxylases (17, 22). We therefore performed multiple reaction monitoring (MRM) based on liquid chromatography-tandem mass spectrometry (LC-MS/MS) analysis with isotopically labeled standards to quantify rela-tive histone levels (23, 24). Our data revealed that H3K9me2 and H3K9me3 levels were significantly increased while H3K9me0 levels were reduced in the testis ofL2hgdhKO mice (Fig. 2D). In addition, H3K27me2 levels significantly increased while H3K27me0 levels decreased moderately in the testis ofL2hgdhKO mice (Fig. 2D). In contrast, other histone methylation markers, including H3K4me1/2/3 and H3K79me1/2/3, were not substantially changed in the testis ofL2hgdhKO mice (Fig. 2D).
changes in a subset of histone methylation markers in mouse testis and brain, where L-2-HG accumulation is the highest.
Besides histone demethylases, the TET family of DNA hydroxylases is another major pathologically relevant target of 2-HG (13, 25). TET enzymes catalyze three sequential oxidative reactions, converting 5-methylcytosine (5mC) first to 5-hydroxymethylcytosine (5hmC), then to 5-formylcytosine (5fC), and finally to 5-carboxylcytosine (5caC) (26–28). We next performed LC-MS analysis to measure and quantify 5mC and its oxidative derivatives in the cerebrum ofL2hgdhKO mice and wild-type littermates. Our data demonstrated that
L2hgdhdeficiency and high accumulation of L-2-HG had a minor effect on the genomic levels of 5mC/5hmC/5fC in the cerebrum ofL2hgdhKO mice (Fig. S4A to C). Previously, it was reported in anIdh1mutant knock-in mouse model that accumulated D-2-HG in the brain was associated with reduced hydroxylation of hypoxia-inducible transcription factor 1 alpha (Hif-1␣) as well as collagen type IV, leading to endoplasmic reticulum (ER) stress response, blood-brain barrier aberration, and hemorrhage (29). However, no sign of hemorrhage was found in the cerebrum of L2hgdh KO mice (data not shown). Furthermore, the levels of Hif-1␣ protein or eukaryotic initiation factor 2␣ (eIF2␣) phosphorylation were not altered in the cerebrum ofL2hgdh KO mice compared to their wild-type littermates (Fig. S4D). Moreover, the blood vessel distribution of colla-gen type IV was intense and continuous in the cerebrum ofL2hgdhKO mice (Fig. S4E and data not shown), implying that hydroxylation modification and maturation of collagens are not disturbed byL2hgdhdeficiency and L-2-HG accumulation.
L2hgdh deficiency leads to early-onset white matter abnormality.MRI (mag-netic resonance imaging) analysis from previous reports suggest that the patho-logical changes in L-2-HGA patients are abnormalities of the subcortical cerebral white matter dentate nucleus, globus pallidus, putamen, and caudate nucleus (30). Using T2-weighted MRI analysis, we found that the signal intensity of the subcortical corpus callosum (cc) and striatum was consistently increased inL2hgdhKO mice compared to wild-type littermates (Fig. 3A). L2hgdh KO mice therefore display white matter abnormalities similar to those observed in L-2-HGA patients.
Changes of MRI signal intensity normally reflect alterations in chemical composition. Therefore, we used stimulated Raman scattering (SRS) microscopy to analyze the chemical composition of our biological samples (31, 32). While protein signal intensity did not change in the striatum of L2hgdh KO mice, lipid signal intensity was remarkably weakened in the white matter fiber of the striatum as well as corpus callosum inL2hgdh KO mice compared to wild-type littermates (Fig. 3B and data not shown). Since the white matter fiber of the striatum is mainly composed of axons and the surrounding myelin, we hypothesized thatL2hgdhdeficiency leads to widespread dys/demyelina-tion in the brain. Supporting this nodys/demyelina-tion, Luxol fast blue (LFB) staining of mouse brain cryosections revealed that the content of myelin was dramatically reduced in the cerebrum ofL2hgdhKO mice, including the cortex, corpus callosum, and striatum (Fig. 3C). Likewise, FluoroMyelin staining showed significantly reduced lipid signal in the white matter fiber of the striatum as well as the corpus callosum inL2hgdhKO mice (Fig. 3D and data not shown). Consistent with this finding, the total protein level of MBP (myelin basic protein) was reduced by 60% in the cerebrum of L2hgdh KO mice compared to wild-type littermates (Fig. 3E and F). Furthermore, transmission electron microscopy (TEM) analysis showed reduced myelination intensity and naked axons in the white matter fibers of the striatum in L2hgdhKO mice (Fig. 3G). Together, these results suggest that L2hgdh deficiency leads to widespread dys/demyelination in mouse brain.
To determine the time point when dys/demyelination initially occurred, we utilized SRS microscopy to examine cryosections of mouse brains at different ages. We found that the lipid signal intensity was comparable betweenL2hgdhKO mice and wild-type littermates at postnatal day 9 (p9) and that the lipid signal intensity thereafter was gradually increased in wild-type mice but much more stagnant inL2hgdhKO mice (Fig. 3H). As a result, an obvious reduction in lipid signal intensity was detected inL2hgdh KO mice as early as postnatal day 12 (Fig. 3H).
Besides dys/demyelination, an extensive spongiotic appearance was observed in multiple brain regions in L2hgdh KO mice, such as the brainstem, the basal ganglia (including the striatum), corpus callosum, hippocampus, inner layer of cortex, and cerebellar nucleus (Fig. S6). The appearance of vacuoles in the brainstem ofL2hgdhKO mice was initially observed at postnatal day 8 and reached peak levels at the age of 2.5 to 3 weeks before gradually declining (Fig. S7A). This dynamic change in vacuolation was found in most of the examined brain regions with a close initiation time between postnatal days 8 and 11, with the exception being the dentate gyrus (DG) of the hippocampus, where a large vacuole was first observed in 1-year-oldL2hgdhKO mice and became extremely severe thereafter (Fig. S7B).
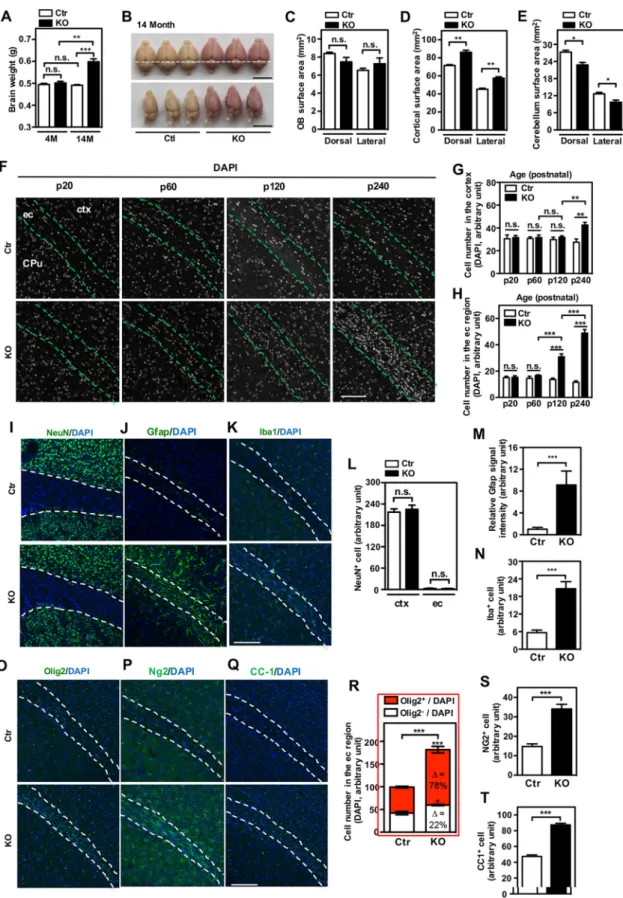
L2hgdh deficiency leads to extensive gliosis. Approximately half of L-2-HGA patients show macrocephaly (2). Consistent with this report, we observed that the net brain weight was significantly increased inL2hgdh KO mice compared to wild-type littermates above 1 year of age (Fig. 4A and B). Measurements of cerebral cortical surface area revealed a 20 to 25% increase inL2hgdhKO mice compared to wild-type littermates (Fig. 4D), with a 15 to 20% reduction in cerebellum surface area inL2hgdh
FIG 3Deletion ofL2hgdhleads to early-onset white matter abnormality and demyelination. (A) T2-weighted MRI. Hyperintense signals appeared in the external capsule and striatum in a coronal brain section ofL2hgdhKO mice. The scale bar is 4 mm. (B) SRS microscopy showed a decreased lipid signal in the myelin fibers in the striatum of L2hgdhKO mice. Lipid and protein signals are represented as green and red, respectively. Scale bars at the lower left and right are 50m and 10m, respectively. (C) Luxol fast blue imaging of a whole coronal section showed reduced signal intensity in L2hgdhKO mice. The scale bar is 2 mm. (D)L2hgdhKO mice showed decreased FluoroMyelin staining in the myelin fibers of the striatum. Scale bars at the lower and upper right are 50m and 25m, respectively. (E and F) Western blotting of cerebrum samples for MBP (E) and quantification of results (F).
FIG 4Deletion ofL2hgdhincreases glial cells and brain mass. (A)L2hgdhKO mice show increased brain weight at 14 months but not 4 months compared to their wild-type controls. Note thatL2hgdhKO mice express RFP and have a red color due to the inserted transposon construct. For each group,n⫽3. (B to E) Whole-mount images (B) and size quantification for OB (C), cerebrum (D), and cerebellum (E) of 14-month-oldL2hgdhKO mice compared to their wild-type controls. For each group,n⫽3. The scale bars are 1 cm. (F to H) Age-dependent increase in nuclear number inL2hgdhKO mice and quantification in the VI layer of primary somatosensory cortex (G) and the external capsule (H). DAPI was used for nuclear staining. ec, external capsule; CPu, striatum; ctx, cortex. The scale
KO mice (Fig. 4E). In contrast, the surface area of olfactory bulbs (OB) was unchanged in L2hgdh KO mice compared to the wild-type controls (Fig. 4C). Notably, 4= ,6-diamidino-2-phenylindole (DAPI) staining for DNA revealed that the number of nuclei increased in the cerebrum ofL2hgdhKO mice in an age-dependent manner (Fig. 4F). To confirm this observation, we quantified the number of nuclei in layer IV of the primary somatosensory cortex and beneath the external corpus in the brains ofL2hgdhKO and wild-type littermates at different ages. There were no differences in the number of nuclei in the cortex or external corpus regions betweenL2hgdhKO mice and wild-type littermates at postnatal day 20 or 60 (Fig. 4G and H). Strikingly, the number of nuclei in the cortex and external corpus increased significantly (by 35 to 45% and 3.5- to 4.5-fold, respectively) in L2hgdhKO mice compared to wild-type littermates at postnatal day 240. Actually, a 2- to 2.5-fold increase in nuclear number was observed even earlier in the external corpus ofL2hgdhKO mice at postnatal day 120 (Fig. 4H). Together, these findings suggest thatL2hgdh deficiency leads to an age-dependent increase in cell number in the cerebrum, which may contribute at least in part to macrocephaly.
The CNS is composed of diverse cell types, including neurons, astrocytes, oligoden-drocytes and their progenitor cells (OPCs), and microglia. To identify the cell types(s) responsible for increased nuclear number in the cerebrum ofL2hgdhKO mice, coronal sections of mouse brains were immunostained with different cell-type-specific markers. Neurons are the major cell type in the CNS and account for about two-thirds of the total cell population in the adult mouse brain. We found that NeuN⫹cells were barely detectable
in the external corpus ofL2hgdhKO mice or wild-type littermates (Fig. 4I). No differences in NeuN⫹cell number were observed in the cortex betweenL2hgdhKO mice and wild-type
littermates (Fig. 4L), suggesting that neurogenesis in the cerebrum, which mostly occurs in the embryonic stage, is not disturbed. In contrast, Gfap (an astrocyte activation marker) dramatically increased in several regions of the cerebrum inL2hgdhKO mice older than 4 weeks, including the inner layer cortex, white matter, and striatum (Fig. 4J, M, and data not shown). Consistent with this, quantitative reverse transcription-PCR (qRT-PCR) analysis showed that Gfap mRNA levels increased 2.5- to 3-fold in the cerebrum ofL2hgdh KO mice compared to wild-type littermates, while that ofAldh1l1, another astrocyte marker, was unchanged (Fig. S8), suggesting that L2hgdh deficiency and L-2-HG accumulation lead to activation but not increased proliferation of astrocytes in mouse brain. Astrocyte activation is often concomitant with the activation of microglia, which are considered resident macrophage cells and act as the first line of innate immune defense in the CNS. Indeed, we found that Iba1⫹ cells increased by 3-fold in the
external corpus ofL2hgdhKO mice at postnatal day 120 (Fig. 4K and N). In addition, the population of Olig2-positive cells (an oligodendrocyte lineage marker) increased by 2-fold and accounted for⬃78% of all cells inL2hgdhKO mice at p120 (Fig. 4O and R). These data indicate that the expansion of oligodendrocyte lineage cells is a major contributor to increased nuclear number in L2hgdh KO mice. The oligodendrocyte lineage is comprised of OPCs. We found that the levels of Ng2-positive oligodendro-cytes and CC1-positive OPCs were increased by 2- to 2.5-fold and 1.5- to 2-fold, respectively, in the external corpus ofL2hgdhKO mice (Fig. 4P, Q, S, and T).
OPCs have been proposed to be the origin of gliomas (33, 34). The observed OPC expansion in the cerebrum of adultL2hgdhKO mice prompted us to investigate the oncogenic effect of L2hgdh deficiency and L-2-HG accumulation in the CNS. IDH1 mutant gliomas, which exhibit high levels of D-2-HG, often contain mutations in p53 (35, 36). We therefore crossedL2hgdhKO mice withp53KO mice and found thatL2hgdh
FIG 4Legend (Continued)
bar is 100m. (I to N) Increase in nuclear number was accompanied by reactive astrocytes and an increase in microglia but not neurons. Reactive astrocytes are represented by upregulation of Gfap inL2hgdhKO mice (J), and the quantification is shown (M). NeuN (I and L) and Iba1 (K and N) are representative markers for microglia and neurons, respectively. The scale bar for panels I to K is 200
andp53double KO mice developed tumor types similar to those ofp53single KO mice, most of which were lymphoma and peripheral tumors but not brain tumors (data not shown). Notably, deletion of bothL2hgdhandp53genes did not significantly change tumor-free survival in mice compared to the single p53deletion controls (Fig. S9). A likely explanation is that the p53deletion produces a very strong tumor phenotype, which may mask the effect of L2hgdh deficiency on tumorigenesis. Together, our data suggest that L2hgdh deficiency and L-2-HG accumulation lead to an increased glial population and a neoplastic state via the expansion of OPC; however, deletion of L2hgdh does not induce an overtly malignant phenotype in mouse brains either alone or in combination with whole-bodyp53deletion.
L2hgdh deficiency results in reactive gliosis and neuroinflammation.As shown earlier in this study, a subset of histones showed increased methylation in the CNS of L2hgdhKO mice (Fig. 2E). Histone methylation not only affects chromatin status and transcription factor recruitment to regulate gene expression (37) but also has been linked to a number of neurological and psychiatric disorders (38). This prompted us to perform RNA-sequencing experiments in hippocampal tissue of mice at the age of postnatal day 60, when glial cell numbers have not yet increased. Surprisingly, there were only selective groups of genes whose transcriptional expression was different in the hippocampus ofL2hgdhKO mice compared to wild-type littermates (Fig. 5A and B). For instance, the gene ontology (GO) item “oxidation reduction” is the top dysregulated pathway in the L2hgdh KO mice compared to wild-type littermates (Fig. 5C). In accordance with this, we found that the level of glutathione (GSH) was significantly reduced by 30% in the cerebrum ofL2hgdhKO mice (Fig. 5D). In agreement with our histological findings (Fig. 3 and 4), we detected significant dysregulation of GO items involved in myelination, axon ensheathment, and cell proliferation inL2hgdhKO mice (Fig. 5C). In addition, genes involved in “immune response” and “chemotaxis” were also dysregulated (Fig. 5C). To verify the RNA-sequencing data, we performed qRT-PCR analysis and found that multiple genes involved in chemotaxis and immune response were indeed upregulated in the cerebrum ofL2hgdhKO mice, includingClec7a,Itgax, Cybb,Tnf, andCcl family genesCcl3/4/6but not Ccl2/5(Fig. 5E). When mouse brain tissues were immunostained with Cd3 and Mpo (lymphocyte and neutrophil markers, respectively), we found that neither Cd3⫹nor Mpo⫹cells could be detected in the
cerebrum ofL2hgdhKO mice or wild-type littermates (Fig. S10). This indicated that the observed immune response triggered by chemotaxis in the cerebrum of L2hgdhKO mice is not caused by peripheral lymphocyte or neutrophil infiltration into the CNS. It should be noted that genes involved in the pathways of chemotaxis and immune response are predominantly expressed in microglia in the CNS (Fig. S11). Immunoflu-orescence staining demonstrated that the signal intensity of Cd68 was significantly upregulated in the cerebrum of L2hgdh KO mice at postnatal day 60 and strongly overlapped with microglia-specific marker Iba1 (Fig. 5F), indicating that the elevated immune response is mediated by microglia. Our data therefore suggest that L2hgdh deficiency leads to microglia activation prior to cell number proliferation in the adult mouse brain.
FIG 5Deletion ofL2hgdhresults in disturbed redox status and neuroinflammation. (A) Gene expression profiling and clustering analysis of the hippocampus ofL2hgdhKO mice and their wild-type controls. (B) MA plot of differential gene expression in the brains ofL2hgdhKO and wild-type mice. The horizontal axis represents gene expression levels (FPKM), while the vertical axis represents relative fold changes in gene expression betweenL2hgdhKO and wild-type mice. Each dot represents one gene, and red dots indicate genes with differential expression using a cutoff (q value) of⬍0.1 (Benjamini-Hochberg method or false discovery rate). (C) Gene ontology (GO) analysis of differentially expressed genes. (D)L2hgdhKO reduces GSH levels in the cerebrum. Whole-cerebrum tissues of adultL2hgdhKO and wild-type mice were used for LC-MS/MS to measure GSH and GSSG levels. Three mice were used for each group. (E) qRT-PCR
progenitor cells decreased by 70% in the SGZ of 8-week-oldL2hgdhKO mice (Fig. 6C and D). Moreover, Dcx-positive newborn neurons were reduced by 60 to 70% in the same brain region in L2hgdhKO mice (Fig. 6E and F and Fig. S12). Together, these results providein vivoevidence that adult hippocampal neurogenesis is impaired in L2hgdhKO mice.
Furthermore, we analyzed NPCs isolated from neonatal mouse hippocampus and found thatL2hgdh-deficient NPCs showed lower proliferation capacity than the wild-type controls (Fig. 6G). To determine the self-renewal capacity of these NPCs, primary neurospheres were individually dissociated into single cells and replated at clonal density for three additional passages. This replating assay revealed that L2hgdh -deficient NPCs also exhibited lower capacity for self-renewal (Fig. 6G). However, we found that the differentiation potential of NPCs was not affected byL2hgdhdeletion (Fig. 6H to J). Upon differentiationin vitro, the neurospheres fromL2hgdhKO mice were tripotent, with comparable abilities to generate neurons, astrocytes, and oligodendro-cytes as evidenced by immunostaining of Tuj1, Gfap, and O4 markers, respectively (Fig. 6H to J). Thus, these data provide evidence thatL2hgdhdeficiency reduces the self-renewal capability of NPCs, thereby contributing to the impaired adult hippocam-pal neurogenesis inL2hgdhKO mice.
Reactive gliosis and neuroinflammation could be strong driving forces to facilitate neurodegeneration (39, 40). To examine neurodegeneration in L2hgdhKO mice, we performed Fluoro Jade-C (FJC) staining, which is widely used to label degenerating neurons (41). The number of FJC-positive cells increased remarkably in the cerebrum, especially the basal ganglia regions, including the globus pallidus and striatum, of 14-month-oldL2hgdhKO mice compared to the wild-type controls (Fig. 6K and O and data not shown). In accordance with this, terminal deoxynucleotidyltransferase-mediated dUTP-biotin nick end labeling (TUNEL)-positive and cleaved caspase 3-positive signals were much stronger in the cerebrum of 14-month-old L2hgdh KO mice than in wild-type littermates (Fig. 6L, M, P, and Q), indicating that apoptosis is highly elevated inL2hgdh -deficient mouse brains.
DISCUSSION
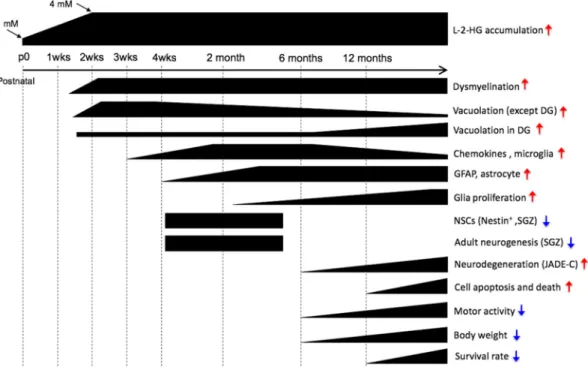
In this study, we providein vivoevidence that mutation of the detoxification enzyme L2hgdh, likely due to L-2-HG accumulation, causes abnormal myelination, disturbed glia/ adult neural stem cell homeostasis, and increased cell death in the central nervous system. The major findings of this study, as summarized in Fig. 7, are as follows. Deletion of the L2hgdh gene leads to a time-dependent accumulation of the enzyme’s substrate, L-2-HG, from ⬃30 M in control mouse tissues up to 4,000M in brain and testis, whereas most other tissues accumulate L-2-HG to⬃500M. The earliest lesions in the central nervous system, which begin at postnatal week 2, include dysmyelination and vacuolation and are mainly but not exclusively myelin-rich regions of the corpus callosum (cc) and striatum fibers. In the dentate gyrus (DG), vacuoles are initially formed at 1 year of age but are exacerbated with age. The temporal heterogeneity of vacuo-lation suggests that there is more than one mechanism contributing to vacuovacuo-lation in different brain regions. Gliosis represented by neuroinflammation of microglia and astrocyte activation starts as early as week 3 to 4. The neuroinflammation of microglia is strongly associated with the vacuolation (except in the DG), as both phenotypes decrease with time. L2hgdh deletion also increases the adult glial cell population, including oligodendrocytes, OPCs, and microglia. The increased number of oligoden-drocytes, possibly from increased proliferation and differentiation of progenitor OPCs,
FIG 5Legend (Continued)
FIG 6Deletion ofL2hgdhresults in impaired neurogenesis, neurodegeneration, and cell death. (A) Nestin staining in neural progenitor cells in the adult SGZ. Shown are coronal images of the SGZ in 2-month-oldL2hgdhKO and wild-type mice. Their density is quantified in panel B. (C and D) Reduction of Tbr2⫹intermediate progenitors in 2-month-oldL2hgdhKO mouse brains compared to controls. (E
and F) Reduction of newborn neurons represented by Dcx⫹cells in 2-month-oldL2hgdhKO compared to control mouse brains. The scale bars for panels A, C, and E at the lower right are 100m, and the upper right insets are enlarged images with a scale bar of 50
m. (G)L2hgdh KO reduces the self-renewal of neural progenitor cellsin vitro. Neural progenitor cells were isolated from the hippocampus and cultured for four generations, with an initial seeding density of 50,000 cells/well. (H to J) The tripotent differentiation capacity ofL2hgdhKO neural progenitor cells. Neural progenitor cells isolated from the hippocampus ofL2hgdhKO and wild-type mice
might be a compensatory effect in response to reduced myelination. L-2-HG accumu-lation may compromise the maintenance of the neural progenitor pool, leading to reduced neurogenesis without affecting the tripotent differentiation potential of NPCs in vitro. The long-term burden of high L-2-HG levels could further induce apoptosis and neurodegeneration, eventually leading to decreased motor activity, reduced body weight, and death.
Our current study is in line with previous work conducted by Rzem et al., demon-strating that L-2-HG accumulates most significantly in the brain and testis ofL2hgdhKO mice (21). We further show that high L-2-HG burden led to epigenetic disruption and progressive atrophy of the testis. In previous studies,L2hgdhKO mice exhibit increased distance of movement in OFT; however, this was not observed in our current study. This may be due to age differences of mice used for comparison, as we also observed increased motor activity in younger mice (data not shown). We speculate that the long-term burden of high L-2-HG could severely compromise motor activity, as most L2hgdhKO mice older than 8 months completely lost movement under routine feeding conditions. Moreover, this is in line with clinical reports that L-2-HGA patients exhibit delayed motor development, frequently accompanied by loss of milestones like unas-sisted walking (2).
Both dys/demyelination and vacuolation occur during the second week after birth in theL2hgdhKO mice. This time point closely correlates with the peak accumulation of L-2-HG. Considering that most peripheral tissues contain less than 1 mM L2-HG and are quite normal inL2hgdhKO mice, intracellular L-2-HG levels may need to reach a higher level (i.e.,⬎1 mM) to cause pathological changes. Postnatal week 2 is crucial for CNS pathology inL2hgdhKO mice, as it is a critical time point for OPC differentiation, oligodendrocyte maturation, and axon myelination in the mouse brain (42, 43).
Myeli-FIG 6Legend (Continued)
were induced to differentiate into neurons, astrocytes, and oligodendrocytesin vitro. Scale bars for panels H to J are 100m. (K to Q) Neurodegeneration caused byL2hgdhKO in the CNS. Serial coronal sections from 14-month-oldL2hgdhKO and wild-type mice were used for Fluoro Jade-C staining (K), cleaved caspase 3 (L), and TUNEL staining (M). Representative images of the globus pallidus are shown. The scale bar is 100m. (O to Q) Respective quantifications of data from panels K to M. Quantifications are presented as means⫾SEM and were analyzed by a two-tailedttest.***,P⬍0.001;**,P⬍0.01;*,P⬍0.05; n.s., not significant.
nation is relatively normal at postnatal day 9 but the deficiency occurs around postnatal day 12, suggesting that early development, differentiation, and maturation of oligo-dendrocytes are normal. It is possible that L-2-HG affects mostly the later stages of oligodendrocyte maturation and myelination.
Vacuolation of the CNS is a common feature in mice with high levels of either L-2-HG or D-2-HG, as this phenotype is also observed in mutant IDH2-R140Q or IDH2-R172K knock-in mice, which accumulate D-2-HG (44). We speculate that neuroinflammation and microglia activation are a host defense reaction against vacuolation for the following reasons: (i) the vacuolation appears earlier and is followed by neuroinflammation and microglia activation; (ii) the activated microglia are recruited and highly proliferative around the vacuolation region in corpus callosum (cc) and myelin fiber of striatum (CPu); (iii) when mice are older than 1 year, the vacuolation phenotype becomes less severe. Concomitantly, the neuroinflammation and microglia activation are diminished. The alpha-KG-dependent dioxygenase family consists of more than 60 members, and they catalyze hydroxylation reactions on diverse substrates, including histone and DNA demethylation (18). Both D-2-HG and L-2-HG are structurally similar to alpha-KG and have been shown to inhibit dioxygenases (13, 17, 45). Although L-2-HG is more potent than D-2-HG in inhibiting these enzymes, not every alpha-KG-dependent dioxy-genase exhibits the same sensitivity to D-2-HG or L-2-HG. In fact, L-2-HG inhibits different dioxygenases with a wide range of potenciesin vitro(17). The enzymes with the lowest 50% inhibitory concentrations (IC50s) were histone demethylases KDM4A/ JMJD2A (IC50of 26⫾3M) for H3K9 and H3K36, KDM4C/JMJD2C (IC50of 97⫾24M) for H3K9 and H3K36, and KDM2A/FBXL11 (IC50of 48⫾15M) for H3K36. In contrast, the enzyme PHD2, which is responsible for Hif-1␣ hydroxylation and ubiquitination-mediated degradation, has a relatively high IC50of 419⫾150M (17). As a competitive inhibitor, the IC50of L-2-HG depends on the concentration of alpha-KG and other cosubstrates used in the enzymatic assays. Therefore, we take caution in comparing thein vitroIC50andin vivoeffectiveness of L-2-HG in dioxygenase inhibition. In the L2hgdhKO mice, neither ER stress nor a global increase of Hif-1␣was detected. These phenotypes are different from those of theIDH1-R132Hknock-in mice (29). Interest-ingly, a significant increase in global methylation of H3K9, H3K27, and H3K36, but not H3K4 or H3K79, was found in the brain and testis, two regions with the highest L-2-HG accumulation inL2hgdh KO mice. We speculate that the L-2-HG accumulated in the brain and testis of L2hgdh KO mice selectively inhibits some members of the JmjC domain-containing histone demethylases.
Both L-2-HG and D-2-HG are normal metabolic by-products (46). Their intracellular levels in most normal cells and tissues are maintained at low levels through the actions of L2HGDH and D2HGDH (5, 47, 48). Currently, few physiological roles have been associated with either enantiomer of 2-HG. High levels of 2-HG have been implicated in pathogenesis of acidurias, as found in the patients with mutations in L2HGDHor D2HGDH. Moreover, D-2-HG acts as an oncometabolite in various human cancers harboring mutations inIDH1orIDH2. Approximately 80% of secondary glioblastomas, 20% of AML, 50% of chondrosarcomas, and 10 to 20% of cholangiocarcinomas accu-mulate high levels of D-2-HG due toIDH1 orIDH2 mutations (49–54). Furthermore, L-2-HG is elevated in clear cell renal cell carcinoma (ccRCC) due to reduced expression of theL2HGDHgene. In line with the oncogenic function of 2HG, we found a massive expansion of OPCs in L2hgdhKO mice, suggesting a neoplastic effect of L-2-HG. However, no brain malignancy was found in theL2hgdhKO mice, indicating that accumulation of L-2-HG alone is insufficient to induce glioma in mice.
reduction in neurogenesisin vivo. Additional causes, such as increased apoptosis, were observed in theL2hgdhKO brain and may contribute to the neurogenesis defects in the L2hgdhd mice. TheL2hgdhKO mice presented in this report provide a valuable model for studying the role of L-2HG in the pathophysiology of human diseases.
MATERIALS AND METHODS
Mice and ethics statement.FVB backgroundL2hgdhknockout (KO) mice (L2hgdh⫺/⫺) were
gener-ated by the Institute of Developmental Biology and Molecular Medicine (IDM) at Fudan University using the piggyBac transposon insertion method. Briefly, a modified piggyBac transposon harboring the red fluorescent protein (RFP) gene was inserted between exon 1 and exon 2 of theL2hgdhallele. The genomic insertion site is chr12:70798148, and the corresponding insertion DNA sequence is 5=-AATT GTGATTCAAAAATAACATTTCCAGGAATGGAAGCTATACTATGTTATAAAATGCAAAAGCAAGATAGCAAGA TACCTCTGTAACTTGGTGCCGTTGGCGTTTGTATTGGATAGTTGTTTGCTGTGAGGCC-3=. The underlined se-quence, AATT, is the insertion site. Knockout efficiency was confirmed by genomic PCR, protein Western blotting, and accumulation of the L2HGDH substrateL-2-hydroxyglutarate. Whole-bodyp53KO mice (B6.129-Trp53tm1Srcmo) were purchased from Shanghai Biomodel Organism and verified by genomic PCR. Trp53⫹/tm1Srcmomice were crossed withL2hgdh⫹/⫺mice to produce double heterozygous mice (F1). The
F1 mice were then intercrossed to produce double-gene-knockout mice and the corresponding control mice withTrp53knockout and wild-typeL2hgdh.
For all of the following experiments, littermate mice were used unless stated otherwise. Mice were bred under standard husbandry conditions at the Fudan University mouse facility on a 12-h light/dark cycle, and all experiments were performed in accordance with the Animal Care and Use Committee at Fudan University.
Neural stem cell assay.Hippocampus cells were dissected from neonatal mouse brain, dissociated using a cell dissociation reagent (A1110501; Thermo), and filtered through a 40-m cell filter (Falcon). Cells were quantified by hemocytometer and plated on 6-well ultralow attachment plates (CLS3471-24EA; Corning) at a density of 50,000 cells/well to form neurospheres. The cell growth medium consisted of Dulbecco’s modified Eagle’s medium nutrient mixture F-12 (10565-018; Thermo) supplemented with N-2 supplement (17502-048; Thermo), B27 supplement minus vitamin A (12587-010; Thermo), epidermal growth factor (EGF; PHG0311; Thermo), fibroblast growth factor (FGF)-basic (PHG0026; Thermo), and penicillin-streptomycin (15070-063; Thermo). Cultured neurospheres were cultured for 7 days before dissociation for cell counting. The tissue/neurosphere dissociation was continued for 4 passages and labeled as primary passage (1st), secondary passage (2nd), 3rd passage, and 4th passage.
Thein vitrodifferentiation of neural stem cells was performed with NeuroCult differentiation medium (05704; Stem Cell). Briefly, neurospheres from secondary passage at day 3 to⬃5 were dissociated to single cells and plated onto 8-well glass chambers (154941; Nunc) in differentiation medium. After a 7-day culture, cells were fixed and used for immunostaining.
TEM analysis.For TEM, mice were perfused sequentially with phosphate-buffered saline (PBS) and prewarmed 2% glutaraldehyde–2% paraformaldehyde (PFA) in PBS. After perfusion, tissues were fixed overnight and coronally sectioned at 100-m thickness by a vibratome (VT1200S; Leica). Tissues were then fixed in OsO4for 1 h and embedded in epoxy resin. Ultrathin sections were cut with a diamond knife to 75 nm (EM UC6; Leica) and visualized using TEM (JEM-1230; JEOL).
SRS analysis.Details for the SRS microscope setup were described previously (31, 32).
OFT.The OFT comprehensively assessed behavioral and locomotor activity levels of rodents, which can be correlated with locomotive function. Briefly, each mouse was dropped in the same place of a square arena (60-cm length) and video tracked for 10 min. The total distance of movement was measured and quantified automatically.
Antibodies.Antibodies against L2hgdh (15707-1-AP; Proteintech), beta-actin (A00702; GenScript), Hif-1␣(610958; BD), eIF2␣(9722; CST), and phospho-eIF2␣(Ser51) (9721; CST) were used for Western blotting. Gfap (MAB360; Millipore), Iba1 (019-441; Wako), Olig2 (AB9610; Millipore), Ng2 (AB53320; Millipore), CC-1 (OP80-100UGCN; Millipore), collagen type IV (600-401-106; Rockland), Cd68 (14-0681-80; eBioscience), nestin (MAB2736; R&D), Tbr2 (ab23345 Abcam), doublecortin (Dcx) (sc-241380; Santa Cruz), and cleaved caspase-3 (Asp175) (5A1E) (CST 9664) were used for immunofluorescence or immunohis-tochemistry.
Western blotting.Mouse tissues were lysed in radioimmunoprecipitation assay (RIPA) buffer sup-plemented with a cocktail of protease inhibitors. Proteins were blotted by following standard protocols.
IHC, IF, and confocal imaging.Immunocytochemistry (IHC) and immunofluorescence (IF) were performed on paraffin sections and frozen sections, respectively. Visualization of primary antibodies was performed by the avidin-biotin-horseradish peroxidase system for IHC and Alexa Fluor 488/647-conjugated secondary antibodies (Invitrogen) for IF. The primary antibodies used in this study are listed in “Antibodies,” above. Sections were visualized under a fluorescence laser scanning confocal microscope (A1; Nikon).
Whole-body fat composition analysis.The fat composition of mice was measured nondestructively by Bruker’s minispec whole-body composition analyzer by following the manufacturer’s instructions. The method is based on time domain nuclear magnetic resonance (TD-NMR).
MRI analysis.We carried out T2-weighted MRIin vivoat 7.0 T using a Bruker BioSpin MRI GmbH system according to standard procedures.
Metabolite extraction and GC-MS analysis. The GC-MS analysis was performed as previously described (45). Standard curves of commercial L-2-HG and creatinine were used to quantify L-2-HG and creatinine in the samples.
Measurement of GSSG and GSH levels.Oxidized glutathione (GSSG) and reduced glutathione (GSH) levels were determined by using liquid chromatography-tandem mass spectrometry (LC-MS/MS). Briefly, tissues were homogenized by using 10-fold 80% (vol/vol) chilled methanol and then centrifuged at 12,000 rpm for 10 min at 4°C. The supernatant then was subjected to LC-MS/MS analysis using a Shimadzu LC system coupled with a 4000-qtrap triple-quadrupole mass spectrometer (AB Sciex). A Phenomenex NH2 column (inner diameter, 50 mm by 2.0 mm; particle size, 5m) was used. The mass spectrometer was optimized and set up in selected reaction monitoring (SRM) scan mode for monitoring the [M-H] of GSSG (m/z611.6¡306.2) and GSH (m/z306.2¡142.8). Analyst software was used for analysis.
RNA isolation and qRT-PCR analysis.Total RNA was isolated from specific brain regions using TransZol Up (TransGen) by following the manufacturer’s instructions. RNA was reverse transcribed with random primer (N9) (TransGen) and proceeded to qRT-PCR with gene-specific primers by SYBR Premix EX tag (TaKaRa). The relative expression abundance of specific genes was calculated by normalization to the beta-actin control. Primer sequences can be provided upon request.
Quantitative analysis of 5mC and its derivatives. Quantification of genomic cytosine and its derivatives was performed by LC-MS/MS as previously described (57).
Gene expression analysis.Next-generation sequencing was performed using standard methods. Briefly, total RNA was extracted using TransZol Up (TransGen). Samples were quantified with an Agilent 2100 Bioanalyzer. Library preparation and RNA sequencing were conducted using TruSeq and a HiSeq 2500 platform (Illumina Inc., San Diego, CA) at WuXi AppTec (Shanghai, China).
For sequencing result analysis, paired-end reads were aligned to the mouse genome (mm9) after quality filtering using Mapsplice, and we performed the quantitation with RSEM. Hierarchical clustering was per-formed with the open-source application Cluster 3.0 and visualized with Java TreeView. The differential expression analysis was carried out using DESeq2. We performed GO analysis with iPathwayGuide.
Histone methylation profiling. Histone methylation was quantified by MRM-based LC-MS/MS (LC-MRM-MS), as described previously (23, 24). In short, the core histones were acid extracted from tissue with 0.4 M H2SO4and precipitated with trichloroacetic acid (TCA), followed by 2 washes with ice-cold acetone. The histones were treated withN-hydroxysuccinimide-propionate and digested with trypsin. Finally, the digested peptides were concentrated to dryness. Prior to LC-MRM-MS, a mixture of isotope-labeled histone peptides was added as internal standards to the samples, and the histone peptide concentration in the samples was calculated by the peak area ratio of histone peptides to internal standard peptides.
Statistical methods.Results are presented as means⫾standard errors of the means (SEM) unless otherwise specified. Statistical analysis was performed using two-tailed unpaired Student’sttest.Pvalues less than 0.05 were considered significant.
Accession number(s). The full data set has been deposited in the GEO public database under accession numberGSE89806.
SUPPLEMENTAL MATERIAL
Supplemental material for this article may be found at https://doi.org/10.1128/ MCB.00492-16.
FIG S1,PDF file, 7.1 MB. TABLE S1,XLSX file, 0.1 MB.
ACKNOWLEDGMENTS
We thank members of the Fudan MCB laboratory for their valuable inputs and support throughout this study and Jian Hu, Yuan Zhu, and Vivian Fu for critical discussion and reading of the manuscript.
This work was also supported by NIH grants (GM067113 and CA1638311 to Y.X.; CA196878 and GM51586 to K.-L.G.).
REFERENCES
1. Steenweg ME, Jakobs C, Errami A, van Dooren SJ, Adeva Bartolome MT, Aerssens P, Augoustides-Savvapoulou P, Baric I, Baumann M, Bonafe L, Chabrol B, Clarke JT, Clayton P, Coker M, Cooper S, Falik-Zaccai T, Gorman M, Hahn A, Hasanoglu A, King MD, de Klerk HB, Korman SH, Lee C, Meldgaard Lund A, Mejaski-Bosnjak V, Pascual-Castroviejo I, Raad-hyaksha A, Rootwelt T, Roubertie A, Ruiz-Falco ML, Scalais E, Schimmel U, Seijo-Martinez M, Suri M, Sykut-Cegielska J, Trefz FK, Uziel G, Valay-annopoulos V, Vianey-Saban C, Vlaho S, Vodopiutz J, Wajner M, Walter J, Walter-Derbort C, Yapici Z, Zafeiriou DI, Spreeuwenberg MD, Celli J, den Dunnen JT, van der Knaap MS, Salomons GS. 2010. An overview of L-2-hydroxyglutarate dehydrogenase gene (L2HGDH) variants: a genotype-phenotype study. Hum Mutat 31:380 –390.https://doi.org/10
.1002/humu.21197.
2. Kranendijk M, Struys EA, Salomons GS, Van der Knaap MS, Jakobs C. 2012. Progress in understanding 2-hydroxyglutaric acidurias. J Inherit Metab Dis 35:571–587.https://doi.org/10.1007/s10545-012-9462-5. 3. Sasaki M, Knobbe CB, Munger JC, Lind EF, Brenner D, Brustle A, Harris IS,
Holmes R, Wakeham A, Haight J, You-Ten A, Li WY, Schalm S, Su SM, Virtanen C, Reifenberger G, Ohashi PS, Barber DL, Figueroa ME, Melnick A, Zuniga-Pflucker JC, Mak TW. 2012. IDH1(R132H) mutation increases murine haematopoietic progenitors and alters epigenetics. Nature 488: 656 – 659.https://doi.org/10.1038/nature11323.
4. Kranendijk M, Struys EA, van Schaftingen E, Gibson KM, Kanhai WA, van der Knaap MS, Amiel J, Buist NR, Das AM, de Klerk JB, Feigenbaum AS, Grange DK, Hofstede FC, Holme E, Kirk EP, Korman SH, Morava E, Morris A, Smeitink J, Sukhai RN, Vallance H, Jakobs C, Salomons GS. 2010. IDH2 mutations in patients with D-2-hydroxyglutaric aciduria. Science 330:
336.https://doi.org/10.1126/science.1192632.
5. Achouri Y, Noel G, Vertommen D, Rider MH, Veiga-Da-Cunha M, Van Schaftingen E. 2004. Identification of a dehydrogenase acting on D-2-hydroxyglutarate. Biochem J 381:35– 42.https://doi.org/10.1042/
BJ20031933.
6. Kranendijk M, Struys EA, Gibson KM, Wickenhagen WV, Abdenur JE, Buechner J, Christensen E, de Kremer RD, Errami A, Gissen P, Gradowska W, Hobson E, Islam L, Korman SH, Kurczynski T, Maranda B, Meli C, Rizzo C, Sansaricq C, Trefz FK, Webster R, Jakobs C, Salomons GS. 2010. Evidence for genetic heterogeneity in D-2-hydroxyglutaric aciduria. Hum Mutat 31:279 –283.https://doi.org/10.1002/humu.21186.
7. Wickenhagen WV, Salomons GS, Gibson KM, Jakobs C, Struys EA. 2009. Measurement of D-2-hydroxyglutarate dehydrogenase activity in cell homogenates derived from D-2-hydroxyglutaric aciduria patients. J In-herit Metab Dis 32:264 –268.https://doi.org/10.1007/s10545-009-1104-1. 8. Moroni I, Bugiani M, D’Incerti L, Maccagnano C, Rimoldi M, Bissola L, Pollo B, Finocchiaro G, Uziel G. 2004. L-2-hydroxyglutaric aciduria and brain malignant tumors: a predisposing condition? Neurology 62: 1882–1884.https://doi.org/10.1212/01.WNL.0000125335.21381.87. 9. Aghili M, Zahedi F, Rafiee E. 2009. Hydroxyglutaric aciduria and
malig-nant brain tumor: a case report and literature review. J Neurooncol 91:233–236.https://doi.org/10.1007/s11060-008-9706-2.
10. Haliloglu G, Jobard F, Oguz KK, Anlar B, Akalan N, Coskun T, Sass JO, Fischer J, Topcu M. 2008. L-2-hydroxyglutaric aciduria and brain tumors in children with mutations in the L2HGDH gene: neuroimaging findings. Neuropediatrics 39:119 –122.https://doi.org/10.1055/s-2008-1081217. 11. Fu X, Chin RM, Vergnes L, Hwang H, Deng G, Xing Y, Pai MY, Li S, Ta L,
Fazlollahi F, Chen C, Prins RM, Teitell MA, Nathanson DA, Lai A, Faull KF, Jiang M, Clarke SG, Cloughesy TF, Graeber TG, Braas D, Christofk HR, Jung ME, Reue K, Huang J. 2015. 2-Hydroxyglutarate inhibits ATP syn-thase and mTOR signaling. Cell Metab 22:508 –515.https://doi.org/10 .1016/j.cmet.2015.06.009.
12. Chan SM, Thomas D, Corces-Zimmerman MR, Xavy S, Rastogi S, Hong WJ, Zhao F, Medeiros BC, Tyvoll DA, Majeti R. 2015. Isocitrate dehydro-genase 1 and 2 mutations induce BCL-2 dependence in acute myeloid leukemia. Nat Med 21:178 –184.https://doi.org/10.1038/nm.3788. 13. Xu W, Yang H, Liu Y, Yang Y, Wang P, Kim SH, Ito S, Yang C, Wang P,
Xiao MT, Liu LX, Jiang WQ, Liu J, Zhang JY, Wang B, Frye S, Zhang Y, Xu YH, Lei QY, Guan KL, Zhao SM, Xiong Y. 2011. Oncometabolite 2-hydroxyglutarate is a competitive inhibitor of alpha-ketoglutarate-dependent dioxygenases. Cancer Cell 19:17–30. https://doi.org/10 .1016/j.ccr.2010.12.014.
14. Ye D, Ma S, Xiong Y, Guan KL. 2013. R-2-hydroxyglutarate as the key effector of IDH mutations promoting oncogenesis. Cancer Cell 23: 274 –276.https://doi.org/10.1016/j.ccr.2013.03.005.
15. Shim EH, Livi CB, Rakheja D, Tan J, Benson D, Parekh V, Kho EY, Ghosh AP, Kirkman R, Velu S, Dutta S, Chenna B, Rea SL, Mishur RJ, Li Q, Johnson-Pais TL, Guo L, Bae S, Wei S, Block K, Sudarshan S. 2014. L-2-hydroxyglutarate: an epigenetic modifier and putative oncometabolite in renal cancer. Cancer Discov 4:1290 –1298.https://doi.org/10.1158/2159-8290.CD-13-0696. 16. Losman JA, Looper RE, Koivunen P, Lee S, Schneider RK, McMahon C,
Cowley GS, Root DE, Ebert BL, Kaelin WG, Jr. 2013. (R)-2-hydroxyglutarate is sufficient to promote leukemogenesis and its effects are reversible. Science 339:1621–1625.https://doi.org/10.1126/science.1231677. 17. Chowdhury R, Yeoh KK, Tian YM, Hillringhaus L, Bagg EA, Rose NR, Leung
IK, Li XS, Woon EC, Yang M, McDonough MA, King ON, Clifton IJ, Klose RJ, Claridge TD, Ratcliffe PJ, Schofield CJ, Kawamura A. 2011. The onco-metabolite 2-hydroxyglutarate inhibits histone lysine demethylases. EMBO Rep 12:463– 469.https://doi.org/10.1038/embor.2011.43. 18. Loenarz C, Schofield CJ. 2008. Expanding chemical biology of
2-oxoglutarate oxygenases. Nat Chem Biol 4:152–156.https://doi.org/10
.1038/nchembio0308-152.
19. Koivunen P, Lee S, Duncan CG, Lopez G, Lu G, Ramkissoon S, Losman JA, Joensuu P, Bergmann U, Gross S, Travins J, Weiss S, Looper R, Ligon KL, Verhaak RG, Yan H, Kaelin WG, Jr. 2012. Transformation by the (R)-enantiomer of 2-hydroxyglutarate linked to EGLN activation. Nature 483:484 – 488.https://doi.org/10.1038/nature10898.
20. Van Schaftingen E, Rzem R, Veiga-da-Cunha M. 2009. L-2-hydroxyglutaric aciduria, a disorder of metabolite repair. J Inherit Metab Dis 32:135–142.
https://doi.org/10.1007/s10545-008-1042-3.
21. Rzem R, Achouri Y, Marbaix E, Schakman O, Wiame E, Marie S, Gailly P, Vincent MF, Veiga-da-Cunha M, Van Schaftingen E. 2015. A mouse model of L-2-hydroxyglutaric aciduria, a disorder of metabolite repair. PLoS One 10:e0119540.https://doi.org/10.1371/journal.pone.0119540. 22. Wang P, Wu J, Ma S, Zhang L, Yao J, Hoadley KA, Wilkerson MD, Perou
CM, Guan KL, Ye D, Xiong Y. 2015. Oncometabolite D-2-hydroxyglutarate inhibits ALKBH DNA repair enzymes and sensitizes IDH mutant cells to alkylating agents. Cell Rep 13:2353–2361.https://doi.org/10.1016/j .celrep.2015.11.029.
23. Gao J, Liao R, Yu Y, Zhai H, Wang Y, Sack R, Peters AH, Chen J, Wu H, Huang Z, Hu M, Qi W, Lu C, Atadja P, Oyang C, Li E, Yi W, Zhou S. 2014. Absolute quantification of histone PTM marks by MRM-based LC-MS/MS. Anal Chem 86:9679 –9686.https://doi.org/10.1021/ac502333a. 24. Yu Y, Chen J, Gao Y, Gao J, Liao R, Wang Y, Oyang C, Li E, Zeng C, Zhou
S, Yang P, Jin H, Yi W. 2016. Quantitative profiling of combinational K27/K36 modifications on histone H3 variants in mouse organs. J Proteome Res 15:1070 –1079.https://doi.org/10.1021/acs.jproteome.5b01164. 25. Figueroa ME, Abdel-Wahab O, Lu C, Ward PS, Patel J, Shih A, Li Y,
Bhagwat N, Vasanthakumar A, Fernandez HF, Tallman MS, Sun Z, Wol-niak K, Peeters JK, Liu W, Choe SE, Fantin VR, Paietta E, Lowenberg B, Licht JD, Godley LA, Delwel R, Valk PJ, Thompson CB, Levine RL, Melnick A. 2010. Leukemic IDH1 and IDH2 mutations result in a hypermethyl-ation phenotype, disrupt TET2 function, and impair hematopoietic dif-ferentiation. Cancer Cell 18:553–567.https://doi.org/10.1016/j.ccr.2010 .11.015.
26. He YF, Li BZ, Li Z, Liu P, Wang Y, Tang Q, Ding J, Jia Y, Chen Z, Li L, Sun Y, Li X, Dai Q, Song CX, Zhang K, He C, Xu GL. 2011. Tet-mediated formation of 5-carboxylcytosine and its excision by TDG in mammalian DNA. Science 333:1303–1307.https://doi.org/10.1126/science.1210944. 27. Ito S, Shen L, Dai Q, Wu SC, Collins LB, Swenberg JA, He C, Zhang Y. 2011.
Tet proteins can convert 5-methylcytosine to 5-formylcytosine and 5-carboxylcytosine. Science 333:1300 –1303.https://doi.org/10.1126/science .1210597.
28. Tahiliani M, Koh KP, Shen Y, Pastor WA, Bandukwala H, Brudno Y, Agarwal S, Iyer LM, Liu DR, Aravind L, Rao A. 2009. Conversion of 5-methylcytosine to 5-hydroxymethylcytosine in mammalian DNA by MLL partner TET1. Science 324:930 –935.https://doi.org/10.1126/science .1170116.
D-2-hydroxyglutarate produced by mutant IDH1 perturbs collagen maturation and basement membrane function. Genes Dev 26:2038 –2049.https://doi
.org/10.1101/gad.198200.112.
30. Steenweg ME, Salomons GS, Yapici Z, Uziel G, Scalais E, Zafeiriou DI, Ruiz-Falco ML, Mejaski-Bosnjak V, Augoustides-Savvopoulou P, Wajner M, Walter J, Verhoeven-Duif NM, Struys EA, Jakobs C, van der Knaap MS. 2009. L-2-hydroxyglutaric aciduria: pattern of MR imaging abnormalities in 56 patients. Radiology 251:856 – 865. https://doi.org/10.1148/radiol .2513080647.
31. Ji M, Orringer DA, Freudiger CW, Ramkissoon S, Liu X, Lau D, Golby AJ, Norton I, Hayashi M, Agar NY, Young GS, Spino C, Santagata S, Camelo-Piragua S, Ligon KL, Sagher O, Xie XS. 2013. Rapid, label-free detection of brain tumors with stimulated Raman scattering microscopy. Sci Transl Med 5:201ra119.
32. Freudiger CW, Min W, Saar BG, Lu S, Holtom GR, He C, Tsai JC, Kang JX, Xie XS. 2008. Label-free biomedical imaging with high sensitivity by stimulated Raman scattering microscopy. Science 322:1857–1861.
https://doi.org/10.1126/science.1165758.
33. Liu C, Sage JC, Miller MR, Verhaak RG, Hippenmeyer S, Vogel H, Foreman O, Bronson RT, Nishiyama A, Luo L, Zong H. 2011. Mosaic analysis with double markers reveals tumor cell of origin in glioma. Cell 146:209 –221.
https://doi.org/10.1016/j.cell.2011.06.014.
34. Liu C, Zong H. 2012. Developmental origins of brain tumors. Curr Opin Neurobiol 22:844 – 849.https://doi.org/10.1016/j.conb.2012.04.012. 35. Cancer Genome Atlas Research Network, Brat DJ, Verhaak RG, Aldape
KD, Yung WK, Salama SR, Cooper LA, Rheinbay E, Miller CR, Vitucci M, Morozova O, Robertson AG, Noushmehr H, Laird PW, Cherniack AD, Akbani R, Huse JT, Ciriello G, Poisson LM, Barnholtz-Sloan JS, Berger MS, Brennan C, Colen RR, Colman H, Flanders AE, Giannini C, Grifford M, Iavarone A, Jain R, Joseph I, Kim J, Kasaian K, Mikkelsen T, Murray BA, O’Neill BP, Pachter L, Parsons DW, Sougnez C, Sulman EP, Vandenberg SR, Van Meir EG, von Deimling A, Zhang H, Crain D, Lau K, Mallery D, Morris S, Paulauskis J, Penny R, Shelton T, et al. 2015. Comprehensive, integrative genomic analysis of diffuse lower-grade gliomas. N Engl J Med 372:2481–2498.https://doi.org/10.1056/NEJMoa1402121. 36. Suzuki H, Aoki K, Chiba K, Sato Y, Shiozawa Y, Shiraishi Y, Shimamura T,
Niida A, Motomura K, Ohka F, Yamamoto T, Tanahashi K, Ranjit M, Wakabayashi T, Yoshizato T, Kataoka K, Yoshida K, Nagata Y, Sato-Otsubo A, Tanaka H, Sanada M, Kondo Y, Nakamura H, Mizoguchi M, Abe T, Muragaki Y, Watanabe R, Ito I, Miyano S, Natsume A, Ogawa S. 2015. Mutational landscape and clonal architecture in grade II and III gliomas. Nat Genet 47:458 – 468.https://doi.org/10.1038/ng.3273.
37. Kouzarides T. 2002. Histone methylation in transcriptional control. Curr Opin Genet Dev 12:198 –209.https://doi.org/10.1016/S0959-437X(02) 00287-3.
38. Akbarian S, Huang HS. 2009. Epigenetic regulation in human brain-focus on histone lysine methylation. Biol Psychiatry 65:198 –203.https://doi
.org/10.1016/j.biopsych.2008.08.015.
39. Tansey MG, Goldberg MS. 2010. Neuroinflammation in Parkinson’s disease: its role in neuronal death and implications for therapeutic intervention. Neurobiol Dis 37:510 –518.https://doi.org/10.1016/j.nbd.2009.11.004. 40. Minghetti L. 2005. Role of inflammation in neurodegenerative diseases. Curr
Opin Neurol 18:315–321. https://doi.org/10.1097/01.wco.0000169752 .54191.97.
41. Schmued LC, Stowers CC, Scallet AC, Xu L. 2005. Fluoro-Jade C results in ultra high resolution and contrast labeling of degenerating neurons. Brain Res 1035:24 –31.https://doi.org/10.1016/j.brainres.2004.11.054. 42. Hill RA, Patel KD, Goncalves CM, Grutzendler J, Nishiyama A. 2014.
Modulation of oligodendrocyte generation during a critical temporal window after NG2 cell division. Nat Neurosci 17:1518 –1527.https://doi
.org/10.1038/nn.3815.
43. Sauvageot CM, Stiles CD. 2002. Molecular mechanisms controlling cor-tical gliogenesis. Curr Opin Neurobiol 12:244 –249. https://doi.org/10
.1016/S0959-4388(02)00322-7.
44. Akbay EA, Moslehi J, Christensen CL, Saha S, Tchaicha JH, Ramkissoon SH, Stewart KM, Carretero J, Kikuchi E, Zhang H, Cohoon TJ, Murray S, Liu W, Uno K, Fisch S, Jones K, Gurumurthy S, Gliser C, Choe S, Keenan M, Son J, Stanley I, Losman JA, Padera R, Bronson RT, Asara JM, Abdel-Wahab O, Amrein PC, Fathi AT, Danial NN, Kimmelman AC, Kung AL, Ligon KL, Yen KE, Kaelin WG, Jr, Bardeesy N, Wong KK. 2014. D-2-hydroxyglutarate produced by mutant IDH2 causes cardiomyopathy and neurodegeneration in mice. Genes Dev 28:479 – 490.https://doi.org/10
.1101/gad.231233.113.
45. Ma S, Jiang B, Deng W, Gu ZK, Wu FZ, Li T, Xia Y, Yang H, Ye D, Xiong Y,
Guan KL. 2015. D-2-hydroxyglutarate is essential for maintaining onco-genic property of mutant IDH-containing cancer cells but dispensable for cell growth. Oncotarget 6:8606 – 8620.https://doi.org/10.18632/oncotarget .3330.
46. Fan J, Teng X, Liu L, Mattaini KR, Looper RE, Vander Heiden MG, Rabinowitz JD. 2015. Human phosphoglycerate dehydrogenase pro-duces the oncometabolite D-2-hydroxyglutarate. ACS Chem Biol 10: 510 –516.https://doi.org/10.1021/cb500683c.
47. Topcu M, Jobard F, Halliez S, Coskun T, Yalcinkayal C, Gerceker FO, Wanders RJ, Prud’homme JF, Lathrop M, Ozguc M, Fischer J. 2004. L-2-hydroxyglutaric aciduria: identification of a mutant gene C14orf160, local-ized on chromosome 14q22.1. Hum Mol Genet 13:2803–2811.https://doi
.org/10.1093/hmg/ddh300.
48. Rzem R, Veiga-da-Cunha M, Noel G, Goffette S, Nassogne MC, Tabarki B, Scholler C, Marquardt T, Vikkula M, Van Schaftingen E. 2004. A gene encoding a putative FAD-dependent L-2-hydroxyglutarate dehydrogenase is mutated in L-2-hydroxyglutaric aciduria. Proc Natl Acad Sci U S A 101:16849 –16854.https://doi.org/10.1073/pnas.0404840101. 49. Parsons DW, Jones S, Zhang X, Lin JC, Leary RJ, Angenendt P, Mankoo P,
Carter H, Siu IM, Gallia GL, Olivi A, McLendon R, Rasheed BA, Keir S, Nikolskaya T, Nikolsky Y, Busam DA, Tekleab H, Diaz LA, Jr, Hartigan J, Smith DR, Strausberg RL, Marie SK, Shinjo SM, Yan H, Riggins GJ, Bigner DD, Karchin R, Papadopoulos N, Parmigiani G, Vogelstein B, Velculescu VE, Kinzler KW. 2008. An integrated genomic analysis of human glio-blastoma multiforme. Science 321:1807–1812.https://doi.org/10.1126/ science.1164382.
50. Mardis ER, Ding L, Dooling DJ, Larson DE, McLellan MD, Chen K, Koboldt DC, Fulton RS, Delehaunty KD, McGrath SD, Fulton LA, Locke DP, Magrini VJ, Abbott RM, Vickery TL, Reed JS, Robinson JS, Wylie T, Smith SM, Carmichael L, Eldred JM, Harris CC, Walker J, Peck JB, Du F, Dukes AF, Sanderson GE, Brummett AM, Clark E, McMichael JF, Meyer RJ, Schindler JK, Pohl CS, Wallis JW, Shi X, Lin L, Schmidt H, Tang Y, Haipek C, Wiechert ME, Ivy JV, Kalicki J, Elliott G, Ries RE, Payton JE, Westervelt P, Tomasson MH, Watson MA, Baty J, Heath S, Shannon WD, Nagarajan R, Link DC, Walter MJ, Graubert TA, DiPersio JF, Wilson RK, Ley TJ. 2009. Recurring mutations found by sequencing an acute myeloid leukemia genome. N Engl J Med 361:1058 –1066.https://doi.org/10.1056/NEJMoa0903840. 51. Pansuriya TC, van Eijk R, d’Adamo P, van Ruler MA, Kuijjer ML, Oosting
J, Cleton-Jansen AM, van Oosterwijk JG, Verbeke SL, Meijer D, van Wezel T, Nord KH, Sangiorgi L, Toker B, Liegl-Atzwanger B, San-Julian M, Sciot R, Limaye N, Kindblom LG, Daugaard S, Godfraind C, Boon LM, Vikkula M, Kurek KC, Szuhai K, French PJ, Bovee JV. 2011. Somatic mosaic IDH1 and IDH2 mutations are associated with enchondroma and spindle cell hemangioma in Ollier disease and Maffucci syndrome. Nat Genet 43: 1256 –1261.https://doi.org/10.1038/ng.1004.
52. Cairns RA, Iqbal J, Lemonnier F, Kucuk C, de Leval L, Jais JP, Parrens M, Martin A, Xerri L, Brousset P, Chan LC, Chan WC, Gaulard P, Mak TW. 2012. IDH2 mutations are frequent in angioimmunoblastic T-cell lym-phoma. Blood 119:1901–1903. https://doi.org/10.1182/blood-2011-11 -391748.
53. Kipp BR, Voss JS, Kerr SE, Barr Fritcher EG, Graham RP, Zhang L, High-smith WE, Zhang J, Roberts LR, Gores GJ, Halling KC. 2012. Isocitrate dehydrogenase 1 and 2 mutations in cholangiocarcinoma. Hum Pathol 43:1552–1558.https://doi.org/10.1016/j.humpath.2011.12.007. 54. Wang P, Dong Q, Zhang C, Kuan PF, Liu Y, Jeck WR, Andersen JB, Jiang
W, Savich GL, Tan TX, Auman JT, Hoskins JM, Misher AD, Moser CD, Yourstone SM, Kim JW, Cibulskis K, Getz G, Hunt HV, Thorgeirsson SS, Roberts LR, Ye D, Guan KL, Xiong Y, Qin LX, Chiang DY. 2013. Mutations in isocitrate dehydrogenase 1 and 2 occur frequently in intrahepatic cholangiocarcinomas and share hypermethylation targets with glioblas-tomas. Oncogene 32:3091–3100.https://doi.org/10.1038/onc.2012.315. 55. Zhang RR, Cui QY, Murai K, Lim YC, Smith ZD, Jin S, Ye P, Rosa L, Lee YK,
Wu HP, Liu W, Xu ZM, Yang L, Ding YQ, Tang F, Meissner A, Ding C, Shi Y, Xu GL. 2013. Tet1 regulates adult hippocampal neurogenesis and cognition. Cell Stem Cell 13:237–245.https://doi.org/10.1016/j.stem .2013.05.006.