THE EFFECT OF DOMAIN GENERAL AGE-RELATED COGNITIVE CHANGES ON THE PATTERN COMPLETION BIAS AND EPISODIC MEMORY
Chris Michael Foster
A dissertation submitted to the faculty at the University of North Carolina at Chapel Hill in partial fulfillment of the requirements for the degree of Doctor of Philosophy in the Department
of Psychology and Neuroscience (Cognitive Psychology) in the School of Arts and Sciences.
Chapel Hill 2016
Approved by:
Kelly S. Giovanello
Neil M. Mulligan
Daniel J. Bauer
Peter A. Ornstein
ABSTRACT
Chris Michael Foster: The effect of domain general age-related cognitive changes on the pattern completion bias and episodic memory
(Under the direction of Kelly S. Giovanello)
Several prominent theories have been developed to account for changes in cognition that
occur with age, and most of these theories focus upon age-related impairments in domain-general
cognitive processes, such as processing speed, cognitive resources, and inhibitory functions.
However, a relatively new theory has been put forth to account for age-related changes that are
specific to episodic memory. The pattern completion bias (PCB) in aging theory suggests that
older adults are biased to generalize a novel but similar representation (i.e., pattern complete) as
opposed to creating a distinct representation (i.e., pattern separate). It has yet to be tested
whether domain-general theories of cognitive aging may account for, or alter, the PCB in aging.
To this end, the current dissertation project consisted of three experiments, each manipulating the
study phase of the mnemonic similarity task, to assess the contribution of cognitive slowing
(Experiment 1), reductions in cognitive resources (Experiment 2), and reduced inhibitory
function (Experiment 3) to the age-related PCB. Regardless of the manipulation at encoding, the
test phase consisted of recognition judgments regarding whether the object was a repetition of a
previously seen object, a rotated version of a previously seen object, or a novel object.
Successful pattern separation was measured as the ability to correctly recognize that an object
was rotated at test, as compared to the orientation presented at study. The results indicate that
although attentional resources are critical for the formation of complex memories, there was
limited evidence to support the hypothesis that attentional resources contribute to the pattern
completion bias. The current set of experiments provide novel support for the notion that pattern
separation processes are altered by a variety of domain-general processes that change with age.
Therefore, the mnemonic similarity task, thought to specifically tax pattern separation, captures
domain-general processes as well as pattern separation processes. Future research should modify
the mnemonic similarity task to account for domain-general cognitive aging processes, as well as
investigate the neural underpinnings of older adult improvements on the task when these
TABLE OF CONTENTS
LIST OF FIGURES ... viii
LIST OF TABLES ... ix
LIST OF ABBREVIATIONS ... x
CHAPTER 1: COGNITIVE AGING ... 2
1.1 Introduction ... 2
1.2 Domain general theories of cognitive aging ... 5
1.2.1 Processing speed theory... 5
1.2.2 Resource deficit ... 7
1.2.3 Inhibition deficit ... 9
1.3 The pattern completion bias in aging ... 10
CHAPTER 2: THE CURRENT PROPOSAL ... 15
2.1 The interaction of cognitive aging theories ... 15
2.2 General experimental procedures ... 16
2.2.1 Participants. ... 16
2.2.2 Stimuli ... 17
2.2.4 Analysis plan ... 20
CHAPTER 3: EXPERIMENTS AND RESULTS ... 23
3.1 Experiment 1 - Processing speed and the completion bias ... 23
3.1.1 Results ... 25
3.1.1.1 Participants ... 25
3.1.1.2 Old/New Recognition and the overall lure discrimination index ... 25
3.1.1.3 Lure discrimination index results across all trials – Repeated measures ANOVA ... 26
3.1.1.4 Lure discrimination index results across all trials – Multilevel model ... 28
3.1.1.5 Rotation test ... 32
3.1.1.6 Individual differences in the lure discrimination index ... 32
3.1.2 Discussion ... 34
3.2 Experiment 2 - Resource deficit and the completion bias ... 37
3.2.1 Results ... 40
3.2.1.1 Participants ... 40
3.2.1.2 Old/New Recognition and the overall lure discrimination index ... 41
3.2.1.3 Lure discrimination index results across all trials – Repeated measures ANOVA ... 42
3.2.1.4 Lure discrimination index results across all trials – Multilevel model ... 43
3.2.1.5 Rotation test ... 44
3.2.2 Discussion ... 47
3.3 Experiment 3 - Inhibition deficit and the completion bias ... 51
3.3.1 Results ... 54
3.3.1.1 Participants ... 54
3.3.1.2 Old/New Recognition and the overall lure discrimination index ... 54
3.3.1.3 Lure discrimination index results across all trials – Repeated measures ANOVA ... 56
3.3.1.4 Lure discrimination index results across all trials – Multilevel Model ... 57
3.3.1.5 Rotation Test ... 58
3.3.1.6 Individual differences in the lure discrimination index ... 59
3.3.1.6 Discussion ... 60
CHAPTER 4: GENERAL DISCUSSION ... 65
4.1 Limitations ... 70
4.2 Conclusions ... 73
LIST OF FIGURES
Figure 1. Results from a mnemonic similarity task showing the altered “tuning curve” ... 77
Figure 2. Example stimuli. ... 78
Figure 3. Experiment 1 old/new recognition and overall lure discrimination performance. ... 81
Figure 4. Experiment 1 lure discrimination results across all trial types. ... 82
Figure 5. Experiment 1 lure discrimination across all trial types. ... 83
Figure 6. Model implied intercepts and slopes in Experiment 1. ... 84
Figure 7. Experiment 2 results from old/new recognition and overall lure discrimination. ... 87
Figure 8. Experiment 2 Lure discrimination index across all trials. ... 88
Figure 9. Experiment 2 Lure discrimination across all trials. ... 89
Figure 10. Experiment 3 old/new recognition and overall lure discrimination index. ... 91
Figure 11. Experiment 3 lure discrimination index across all trials. ... 92
LIST OF TABLES
Table 1. Experiment 1 Demographic and Cognitive Testing Data ... 79
Table 2.Parameter Estimates from Experiment 1 ... 80
Table 3. Experiment 2 Demographic and Cognitive Testing Data ... 85
Table 4. Parameter Estimates from Experiment 2 ... 86
Table 5.Experiment 3 Demographic and Cognitive Testing Data ... 90
LIST OF ABBREVIATIONS
PCB Pattern completion bias
PS Pattern separation
PC Pattern completion
OA Older adult
YA Younger adult
ICC Intra-class correlation
Chapter 1: Cognitive Aging 1.1 Introduction
Changes in cognition occur in all individuals as they age. These changes may take many
forms; however, it is common to see impairments in perception, attention, processing speed,
episodic memory, and working memory (Craik & Salthouse, 2008). While many aspects of
cognition change with age, memory complaints are the most frequently reported by older adults
(OAs; Newson & Kemps, 2006). Several prominent theories have been developed to account for
these changes, including a change in processing speed (Salthouse, 1996a; 1996b), reductions in
cognitive resources (Craik, 1983; Craik & Byrd, 1982), and impairments in inhibitory processes
(Hasher & Zacks, 1988; Lustig, Hasher, & Zacks, 2007; Zacks, Hasher, & Li, 2000). These
theories are domain-general explanations of cognitive aging in that a single factor explains a
wide variety of cognitive changes that occur in aging. A relatively new theory of cognitive aging,
hereafter referred to as the pattern completion bias (PCB), has been put forth to account for
age-related episodic memory deficits. This theory posits that OAs, due to anatomical and functional
changes within a medial temporal lobe brain structure called the hippocampus, are biased to
pattern complete (PC; i.e., retrieve a pre-existing representation when exposed to a novel but
similar representation) as opposed to pattern separate (PS; i.e., create a distinct representation
even if it is similar to a stored representation). The PCB reflects an increase in the likelihood that
OAs will indicate that a similar, but novel, representation is identical to a representation stored in
2011a). The current set of experiments tested a key tenet of the PCB theory of cognitive aging,
namely, that the PCB in aging cannot be accounted for by manipulating features of the task (e.g.,
decision making time, strategy, etc.) that may differentially impact OA’s memory performance
(Stark, Stevenson, Wu, Rutledge, & Stark, 2015). Despite this claim, very little research has been
conducted that specifically addresses how domain-general theories of cognitive aging might
moderate the PCB. I hypothesized that if age-related changes in domain-general processes are
accounted for in an experimental design, then the PCB in aging will be reduced. Similarly, I
hypothesized that young adults (YAs), when placed under certain experimental conditions,
would also show a PCB.
The domain-general theories of cognitive aging suggest that a primary reason for poorer
memory performance in OAs is a reduction in the fidelity of the encoded memory representation.
For example, the processing speed theory suggests that OAs either need more time to create a
robust representation, or are unable to build the same quality of representation due to degradation
of previously processed information over time (Salthouse, 1996). The resource deficit theory
posits that OAs are less able to deploy an efficient strategy to encode a representation (Craik,
1983). The inhibition deficit suggests that OAs are less able to maintain a clean mental
workspace and, therefore, are more likely to encode (or be distracted by) irrelevant information,
thereby reducing the quality of the goal relevant representation (Zacks et al., 2000). I
hypothesized that domain-general aspects of aging would contribute to the PCB observed in
OAs.
Prior research investigating the PCB has focused primarily on the neural mechanisms that
account for age-related changes in episodic memory. However, only one study has examined
al., 2015). Stark et al. (2015) manipulated several aspects of the memory task (e.g., incidental
versus intentional encoding, time at decision making, types of response options) and found that
none of these task design changes ameliorated the PCB in aging. As such, Stark and colleagues
(2015) conclude that, “these data support the notion that underlying changes in the brain
circuitry, specifically within the hippocampus, cannot be overcome to improve performance on
this task” (p. 14).
To investigate whether domain-general aspects of cognitive aging may moderate the
PCB, three experiments were conducted. Each experiment manipulated the study phase of an
image-based memory task in order to assess the contribution of cognitive slowing (Experiment
1), reductions in cognitive resources (Experiment 2), and reduced inhibitory function
(Experiment 3) to the age-related PCB. Regardless of the manipulation at encoding, the test
phase consisted of recognition judgments regarding whether the object was a repetition of a
previously seen object, a rotated version of a previously seen object, or a novel object. Pattern
separation and PC processes were measured as the ability to identify rotated objects at test. Each
experiment manipulated one variable to assess its’ impact on the PCB observed in aging. If the
PCB in aging can be reduced by any of the experimental manipulations, it would offer novel
evidence that PS and PC processes are moderated by domain general cognitive processes. The
current set of experiments provide an important step in building a more comprehensive
understanding of the mechanisms that give rise to age-related alterations in episodic memory
function. To begin, the prominent theories of cognitive aging are discussed, followed by a
summary of episodic memory deficits as they relate to the PCB. Next, a description of each
experiment is provided, including rationale, methods, and results. This dissertation concludes
1.2 Domain general theories of cognitive aging 1.2.1 Processing speed theory
One of the most pervasive and influential theories of cognitive aging is the processing
speed theory (e.g., Salthouse, 1996a). This theory suggests that the rate at which information is
processed slows as we age (proposed to be mediated by alterations in white matter integrity), and
that this slowing of processing speed has downstream effects on essentially all aspects of
cognition (Craik & Salthouse, 2008; Persson et al., 2006; Salthouse, 1996b). Importantly, such
slowing is thought to be a general mechanism of age-related cognitive change since a variety of
speed measures share significant variance with age, and the relationships are not moderated by
health factors, experience, or practice (Salthouse, 1996a; 2000). Further, changes in a wide
variety of cognitive processes including memory, reasoning, and spatial abilities are significantly
mediated by measures of processing speed (Salthouse, 1996a). For example, Salthouse (1996b)
investigated the relation between memory performance, age, and a general factor of processing
speed. A significant amount of variance in recall memory performance was accounted for by age
(.289 – variance in recall performance accounted for by age); however, after accounting for a
general processing speed measure derived from a large number of tests proposed to measure
processing speed, the variance in memory performance accounted for by age was dramatically
reduced and no longer significant (.016 – variance in recall performance accounted for by age
controlling for processing speed). Thus, while processing speed accounts for many changes in
cognition that occur with age, it may specifically account for many of the age-related changes in
episodic memory.
Such age-related processing speed changes have been linked to white-matter health
of white matter health) are correlated with motor speed (Soderlund et al., 2003). Fractional
anisotropy (a measure of white matter integrity) has been shown to correlate with reaction times
in a visual detection task (Madden et al., 2004) as well as other measures of processing speed
(O’Sullivan, Jones, Summers, Morris, Williams, & Markus, 2001; Persson et al., 2006; Stebbins
et al., 2001).
The processing speed theory of aging is proposed to affect cognition primarily through
two mechanisms, the limited time mechanism and the simultaneity mechanism (Salthouse,
1996a). The limited time mechanism suggests that, due to OA’s slower processing speed, when a
task has time constraints, OAs are not be able to complete all relevant cognitive operations
required by the task, or at least not to the same extent as YAs. This could lead to a host of
problems, but in the case of memory, it is likely that the encoded representation is not of the
same strength or quality as YAs due to fewer features of the event being processed. The
simultaneity mechanism suggests that the products of earlier operations are lost or degraded in
OAs because of the extended time needed to complete each step of the cognitive process.
Therefore, if a cognitive operation requires the combination of previously distinct processes
(e.g., a multi-staged math problem where the product from an early operation in the problem
needs to be held in mind and combined with the product from a later operation) then this
combination would not occur as efficiently or, potentially, not at all. Again, in relation to
memory phenomena, if an association is to be formed either within or between stimuli, it is likely
that the to-be-encoded stimuli are not bound as efficiently in an integrated memory trace since
the parts of the stimuli that are attended to early on may not be as robust when these features
1.2.2 Resource deficit
Another prominent theory of cognitive aging is the resource deficit theory (e.g., Craik,
1983, 1986; Craik & Byrd, 1982). In essence, this theory suggests that OAs have diminished
processing resources in the form of reduced attentional or working memory capacity. Processing
capacity refers to the idea that the mind has a finite pool of resources. As we engage in attention
demanding tasks, that pool of resources is reduced, leaving fewer resources available to deploy
to other information and cognitive tasks. Thus, if OAs’ have an overall reduction in the available
pool of resources, all tasks will necessarily use a greater proportion of the available resources. A
decrease in resources is thought to arise from a reduction in frontal lobe functioning (Craik,
1983). Reduced resources impose restrictions on the ability to accomplish resource demanding
tasks, including self-initiated encoding processes, generation of novel connections, and the use of
strategic process that may improve encoding or retrieval (Zacks, Hasher, Li, 2000). If OAs use
the same amount of resources as YAs during strategic processing, then there are fewer resources
available to deploy to the to-be-encoded information. If, however, OAs use the same amount of
resources as YAs to process the to-be-encoded information, then OAs have fewer resources
available for strategic processes that may aid in the efficient encoding and retrieval of that
representation. Essentially, if OAs have a reduction in available resources, all cognitively
demanding tasks will necessarily be more difficult for OAs (Anderson, Craik, Naveh-Benjamin,
1998). In the case of memory, OAs reduced resources lead to an impairment in the strength or
quality of the encoded stimulus, or a reduced ability to strategically encode that stimulus, leading
to worse memory performance overall.
Evidence for this theory comes from a wide variety of paradigms, each of which
1987; Jennings & Jacoby, 1993; Kim & Giovanello, 2011; Naveh-Benjamin, Craik, Guez, &
Kreuger, 2005). For example, Anderson et al. (1998) required a group of YAs and OAs to
encode words with no secondary task (i.e., during full attention) or while performing a secondary
continuous reaction time task (i.e., divided attention). Again, the resource deficit theory posits
that OAs have fewer resources than YAs, and thus, if YAs are engaged in a divided attention
task, their performance on the primary task should mimic that of OAs (since there are fewer
resources to devote to the primary task). Anderson et al.’s results showed that YAs exhibit a
reduction in memory during divided attention that closely mimics that of OAs under full
attention. Similarly, Naveh-Benjamin et al. (2005) asked participants to constantly track a
stimulus presented on a screen with a computer mouse. Young adults in this study exhibited
memory impairments when their attention was divided at encoding, as compared to the full
attention condition; however, not to the extent of OAs. These results provide some evidence that
the memory changes associated with aging reflect a reduction in the available attentional
resources in OAs.
Craik and McDowd (1987) also showed that OAs have a greater cost on secondary task
performance during recall tasks, suggesting that OAs have fewer resources available when
performing cognitive operations that support memory retrieval; however, secondary task costs
are minimal during recognition as compared to free recall. In combination, these studies suggest
that the reduction of attentional resources occurs during all stages of memory (e.g., encoding and
retrieval) and that the reduction of attentional resources can account for many of the episodic
1.2.3 Inhibition deficit
The inhibitory control deficit in aging primarily concerns the ability to manage the
contents of working memory (Hasher & Zacks, 1988) and is thought to arise from reduced
inhibitory control mechanisms supported by frontal lobe functioning (Jonides, Marshuetz, Smith,
Reuter-Lorenz, Koeppe, & Hartley, 2000). Hasher and her colleagues have proposed three
mechanisms by which the contents of working memory are controlled: Access, deletion, and
restraint (Lustig, Hasher, & Zacks, 2007). Access refers to the ability to control what enters
working memory. Access deficits in aging have been demonstrated in studies in which words are
displayed on top of line drawings. Participants are told to ignore the words and identify the
drawings. Older adults, relative to YAs, show later priming for the superimposed words,
suggesting that OAs are less able to ignore the words (or at least prevent access of the words into
working memory) during encoding (Rowe, Valderrama, Hasher, & Lenartwoicz, 2006; Kim,
Hasher, & Zacks, 2007).
Deletion refers to the ability to remove irrelevant information from working memory.
Deleting information from working memory should occur if that information is no longer useful,
if it accidentally entered working memory, or if it is interfering with other ongoing operations.
Evidence for age-related alterations in the deletion function may be observed in working
memory span studies and directed forgetting investigations. Typically, measures of working
memory span increase in difficulty in a linear fashion when to-be-remembered lists get longer
and longer with each trial. When these typical span measures are reversed, aging deficits are
greatly reduced, suggesting that OAs have difficulty with proactive interference or deleting
irrelevant information (Lustig, May, & Hasher, 2001; May, Hasher, & Kane, 1999; Rowe,
term memory. Directed forgetting experiments, experiments in which certain studied stimuli are
directed to be remembered and other studied stimuli are directed to be forgotten, indicate that
YAs are better able than OAs at suppressing previously encountered representations to aid in the
efficient memory of the current, to-be-remembered representations (Zacks, Radvansky, &
Hasher, 1996).
Restraint refers to the ability to prevent pre-potent responses or representations from
entering working memory when these processes are not goal relevant. May and Hasher (1998)
provided evidence for impairments in the restraint mechanism by instructing participants to stop
responding intermittently on a category verification task (e.g., respond “yes” when an exemplar
was part of the category word and “no” when it was not). Older adults were just as accurate
during the response portion of the task, but much more likely to make errors when they, as
compared to YAs, were supposed to withhold a response. In sum, OAs are less capable of
controlling what enters the contents of, and stays within, working memory. The aforementioned
inhibitory mechanisms are important for preventing “mental clutter”, such that the information
that is maintained in mind during a task is related only to the goals of the current task.
1.3 The pattern completion bias in aging
The cognitive aging theories discussed thus far are domain-general theories, in that they
account for age-related changes in a wide array of cognitive domains with a single process. As
described above, these global changes in cognition have a clear and measurable impact on
memory; however, this impact arises from upstream effects on what is processed and, therefore,
remembered. For example, if processing speed is reduced, time constraints will impact what
quality of processing that occurs during encoding, the type of processes that can be executed at
decision making, or the rate at which prior knowledge can be accessed and used strategically.
Despite the variety of global changes in cognition that occur with age, OAs report
episodic memory changes, memories of the past that contain details of an event and its
surrounding context, as their primary complaint (Newson & Kemps, 2006; Tulving, 1972).
While several theoretical distinctions in the memory literature have been created to explain the
phenomenological aspects of episodic memories, as compared to memories that have no
contextual details or are only expressed through behavior (e.g., declarative/non-declarative,
implicit/explicit, recollection/familiarity), it is generally agreed upon that episodic memories
require the hippocampus to be encoded and retrieved. The hippocampus is proposed to support
episodic memory by aiding in the creation of an orthogonalized neural code, even when the
to-be-encoded representation is similar to one encountered in the past. The ability to create a novel
code in the face of similarity is referred to as PS, while the ability to generalize degraded or
partial information into a previously stored code is referred to as PC. Pattern separation and PC
are critical for storing and retrieving episodic memories, as these processes prevent catastrophic
interference from similar episodes (Yassa & Stark, 2011). Importantly, PS should not be thought
of as encoding and PC should not be thought of as retrieval. Both PS and PC operate on a single
stream of neural input. Therefore, both PS and PC contribute to a process of mnemonic
discrimination such that the neural input is either made more distinct, or made more similar to
previously encountered mnemonic representations.
Recently, the notion has been put forth that age-related episodic memory deficits reflect a
bias to PC, also known as representational rigidity (Yassa & Stark, 2011). In other words, when
same as a previously encountered (old) event. To this end, YAs would be more likely to encode a
similar event as a new episode, while OAs would not. Further, the PCB in aging relies almost
solely on functional and anatomical changes in the hippocampus to support the theory and its
predictions. For example, OAs experience a significant reduction of input from the entorhinal
cortex to the dentate gyrus/cornu amonis 3, a significant reduction in dentate gyrus volume, and
an overall reduction in inhibitory interneurons throughout the hippocampus (Brickman et al.,
2011; Wilson, Gallagher, Eichenbaum, & Tanila, 2006).
While the PCB in aging is mediated by age-related changes in the hippocampus, there is
also a preponderance of behavioral evidence using the mnemonic similarity task (Kirwan &
Stark, 2007) that support the PCB theory of cognitive aging (e.g., Holden, & Gilbert, 2012; Ly,
Murray, & Yassa, 2013; Pidgeon, & Morcom, 2014; Yassa et al., 2011b; Yassa, & Stark, 2010;
Reagh et al., 2014; Stark et al., 2013; Stark et al., 2015; Toner et al., 2009). The mnemonic
similarity task is thought to tax PS processes due to the inclusion of repeated items, similar lures,
and novel foils presented during the recognition portion of the experiment. Critically, the similar
lures are crafted to create a range of similarity in which some lures are extremely similar to
previously studied items and others are related, but dissimilar to previously studied items. Across
this range of similarity, experimenters can assess how much novelty is needed before participants
are able to recognize that an item is “similar”, but “new”.
The mnemonic similarity task has consistently supported the idea that OAs require more
novelty to store a similar episode as new. Toner et al. (2009) showed that OAs are more likely to
indicate that a “similar” item is “old” as compared to YAs. Thus, OAs experience greater
interference when distinguishing similar from old (repeated) trials. When looking across levels
are the most similar; however, as stimuli become less similar, YAs exhibit a more rapid
improvement in the ability to say a “similar” trial is “similar” as compared to OAs. The fact that
YAs ability to indicate a “similar” trial is “similar” improves more rapidly than OAs, confirms
the prediction that OAs experience a bias to PC.
Older adults’ PCB is also exemplified graphically by an altered “tuning curve” (see
Figure 1A; Stark et al., 2013). The reduction in the initial steepness of the curve, as compared to
YAs, shows that OAs require more novelty to indicate an object is “similar”. Importantly, the
anchor points of the curve, the ability to indicate that an exact repeat is “old” and a new item is
“new”, are typically around the same performance level (e.g., Toner et al., 2009; Stark et al.,
2013; Yassa et al., 2011b), though they are not always exactly the same (see Figure 1B; Stark et
al., 2013). Concluding that OAs, or any group, have impairments in PS relies on differences in
performance across the curve. Even if there are small deviations in the anchor (as can be seen in
Figure 1B) the critical differences lay in how performance changes as similarity decreases. The
PCB has been tested across several types of processing engaged during learning and memory,
including spatial memory (Reagh et al., 2014; Stark, Yassa, & Stark, 2010), as well as perceptual
and conceptual memory using both pictures (Pidgeon & Morcom, 2014) and words (Ly, Murray,
Yassa, 2013). The range of memory tasks that have yielded similar results suggests that PS and
PC processes are fundamental memory functions, and that the alteration of these processes with
age underlies episodic memory functions, regardless of the type of processing or modality.
Not only has the PCB in aging been assessed across several domains of learning and
memory, several aspects of the mnemonic similarity task have been manipulated to determine
whether the task design may contribute to the PCB in aging (Stark et al., 2015). Stark and
encoding, as well as several other features of the task. They manipulated the time allowed for
decision making under the assumption that processing speed changes at decision may bias OAs
to choose old responses more so than YAs. Intentionality of encoding was also manipulated to
assess whether part of the PCB in aging is the result of OAs and YAs differentially deploying
attentional resources during incidental encoding. Regardless of the manipulation, OAs were
consistently found to show impairments on the mnemonic similarity task and these impairments
were not improved when taking into account the aforementioned aspects of the task design.
The crux of the current proposal relies on a key feature of the PCB in aging. Namely, the
PCB theory suggests that the episodic memory deficits that occur in aging reflect a mechanistic
property of the hippocampus, such that the balance between PS and PC is altered by age via
impaired functioning of the hippocampus. Based on a series of experiments that manipulated
certain features of the mnemonic similarity task, Stark et al. (2015) conclude that OAs’
performance on the mnemonic similarity task cannot be improved; however, this study primarily
focused on aspects of the task that may impact the decision making process. Further, the only
manipulation implemented at encoding (intentional vs. incidental encoding) was used to assess
whether OAs could improve their performance. Thus, there is an open question as to what
manipulations at encoding, if any, may alter the PCB in aging. The Stark et al. (2015) study also
leaves open the question of what manipulations would be necessary to cause YAs to perform like
Chapter 2: The current proposal 2.1 The interaction of cognitive aging theories
Given the limited evidence to support the conclusion that OAs’ performance on the
mnemonic similarity task cannot be improved, the current proposal tested the hypothesis that the
PCB in aging can be moderated when experimentally controlling for domain-general processes
that also change with age. Specifically, Experiment 1 manipulated time at encoding to assess the
role of processing speed on the PCB. Experiment 2 implemented a divided attention task to
assess the impact of attentional resources on the PCB, and Experiment 3 implemented a directed
forgetting paradigm to assess the role of inhibition in the PCB. If the PCB in aging can be
moderated by domain-general processes it would provide evidence that the mnemonic similarity
task captures more aspects of cognitive aging than simply mnemonic changes. Further, if the
PCB in aging can be moderated by domain-general processes, it would provide novel evidence
that impairments to memory caused by hippocampal changes are exacerbated by cognitive
processes thought to occur outside of the hippocampus. These results would offer new strategies
by which OA memory impairments may be reduced, and open new avenues of research to
understand the mechanisms that cause age related memory changes. In the following pages, the
general procedures that are common to all experiments are outlined first, followed by a
description of each experimental design, the results, and a discussion of the findings. The
2.2 General experimental procedures 2.2.1 Participants.
Each experiment used a within subjects design and included approximately 50 subjects
(25 YAs and 25 OAs). Young adults ranged in age from 18 – 27 years and were recruited from
either the Psychology and Neuroscience 101 research participant pool at UNC Chapel Hill or
through flyers displayed throughout the campus and surrounding areas. Older adults ranged in
age from 60 – 86 years and were recruited through a participant database established within the
Cognitive Neuroscience of Memory Laboratory, emails sent throughout the campus, flyers
posted around campus, and flyers posted in the local community, including retirement
communities and senior centers. All participants were screened for cognitive impairments using
the Mini Mental State Exam (MMSE) and were required to score a 27 or higher to be included in
the study (Folstein, Folstein, & McHugh, 1975). None of the participants recruited for the
reported experiments met these exclusionary criteria.
Participants were also given several cognitive tests to obtain standardized measures of
cognition. All participants completed the digit span forward and backward, both of which are
subtests of the Wechsler Adult Intelligence Scale and thought to measure working memory
capacity and functioning (Wechsler, 2008). Digit span forward requires that participants repeat
back a list of numbers, and the number of digits increases in length. Digit span backwards
requires participants to hold a list of numbers in mind and repeat them in backwards order (from
the order in which they are presented). Following the digit span tasks, participants completed
Trails A and B. Trails A is purely a test of processing speed and it was chosen because it does
not require a memory component like other processing speed tests (e.g., Digit-Symbol Coding).
participants connect a series of 25 dots in numerical order. For Trails B, participants connect a
series of dots filled with either numbers or letters by alternating between numbers and letters.
Finally, conditions 1 through 3 of the color-word interference subtest of the Delis-Kaplan
Executive Function System were administered (D-KEFS; Delis, Kaplan, & Kramer, 2001). The
color-word interference test is primarily a measure of inhibition. In condition 1, participants must
say the color of squares on a page as quickly as possible. In condition 2, participants must read
words (e.g., red, blue, and green) as quickly as possible. In condition 3, participants are
instructed to name the color of the ink that the word is printed in, while doing their best to ignore
the fact that the word itself is a different color than the color of the ink. Participants were then
administered the encoding and recognition portions of the mnemonic similarity task. After this
portion of the experiment, all participants completed a mental rotation test. For this test,
participants were shown an image for 2.5 sec followed by a delay of 2.5 sec. After the delay,
they were shown the same image and asked to indicate whether or not it was in the same
orientation. If it was in the same orientation, participants pressed “1” on the number keypad to
indicate the object was “old”. If it was rotated, participants were instructed to press a number
from “2” to “5”. These response options corresponded to the four possible degrees of rotation
(i.e., 15° – 55°). Young adults recruited through the Psychology and Neuroscience101
participant pool received course credit for participation. Any participant not recruited through the
psychology 101 participant pool was paid $10/hour for their time.
2.2.2 Stimuli
Typically, studies using the mnemonic similarity task employ pictures of common objects
(e.g., a ping pong paddle, pumpkin, wagon, saxophone, etc.; Yassa et al., 2011a). These common
studied version of the item. The level of similarity was determined by asking participants not
involved in the experiment to rate similarity on a likert scale of 1 – 7 (Kirwan & Stark, 2007).
These stimuli allow for the measurement of PS/PC processes as similarity decreases; however,
this procedure requires the use of subjective ratings of similarity, as opposed to systematically
controlling for the level of similarity. Several other designs have been implemented to assess PS
abilities, including spatial PS (Reagh et al., 2014), the effects of learning abstract representations
on PS (Mattfeld & Stark, 2015), and the effect of repetition on PS (Reagh & Yassa, 2014).
However, to my knowledge, only one study has used object stimuli that were systematically
varied in lure similarity (Motley & Kirwan, 2012).
Motley & Kirwan (2012) utilized common objects obtained from the Amsterdam Library
of Object Images (Geusebroek et al., 2005). Importantly, these objects vary based on the angle at
which the picture was taken. Each object was photographed 72 times, once at every 5° of
rotation. The assumption in using these stimuli is that the greater the rotation, the less similar the
object should be to the previously stored representation, and further, that this manipulation gives
experimental control to similarity, as opposed to relying on subjective responses from
participants not involved in the experiment itself. Thus, the present set of experiments uses this
approach. In keeping with the original study, lure similarity in the current study was
operationalized according to four degrees of rotation from the original presentation (rotated 15°,
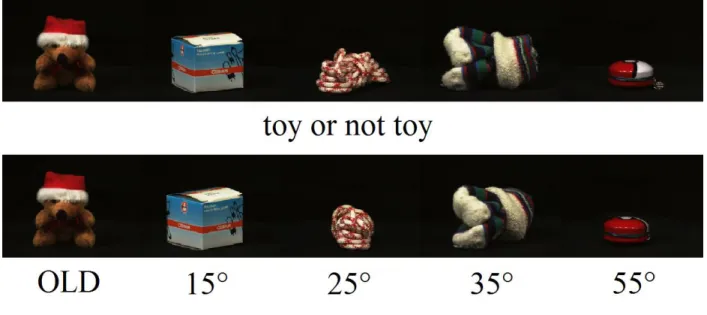
rotated 25°, rotated 35°, and rotated 55°). At test, there were 6 categories of stimuli; the four
rotated trial types, as well as new stimuli and exact repeats (see Figure 2). A random angle was
chosen for each object presented at study, and this angle was used as 0°, or as the repeat, at test.
stimuli were present in each of the rotation categories. Further, the rotation off 0° was randomly
chosen to be either to the left or right.
2.2.3 General Task design
With a few exceptions, much of the experimental design used for all three experiments
was modeled after Reagh & Yassa (2014) who also employed a within-subjects manipulation.
One exception is the intentionality of encoding. Prior studies using this paradigm are mixed as to
whether or not the researchers used intentional or incidental encoding instructions; however, a
study comparing the type of instructions on performance found no main effect of instruction type
and no interaction with age and instruction type (Stark et al., 2015). Therefore, I employed
intentional instructions under the assumption that this would not have an impact on performance
between the age groups.
After informed consent and the completion of the cognitive tests mentioned previously,
participants were told about the nature of the memory task. Specifically, before the encoding
session, participants were informed about the memory task, including the fact that they would be
tested with exact repeats of previously encountered items (to which they should indicate “old”),
new items (to which they should indicate “new”), and rotated items (to which they should
indicate “rotated”). Participants were given a practice session of both the study and test portions
of the memory task before beginning the experiment. During encoding, participants made “toy”
or “not toy” judgments. There was no correct answer. The semantic judgment was used to ensure
attention was given to each stimulus.
At study, participants were shown a series of 192 common objects, one at a time, for 2.5
sec each with a 0.5 sec inter-stimulus interval (unless otherwise noted). At test, participants were
Figure 2). Half of the repeats and lures were taken from the within subjects manipulations
described below. This left 12 trials for each level of rotation. Presentation at test was always
self-paced. Participants made one of three possible judgments for each object presented at test, either
“old”, “rotated”, or “new”.
Finally, to assess whether there were group differences in the ability to discern rotation,
all participants were given a brief assessment that investigated their skill at noticing rotation.
Participants were shown a series of 25 objects taken from the same library of object images. Five
images were presented at each degree of rotation including five from the repeat category. An
image was shown for 2.5 sec, covered by a color noise mask (i.e., a patch of randomly colored
pixels that completely covered the portion of the screen where the image was presented) for 2.5
sec and then the same image was shown again as either an exact repeat or a rotated version of
itself. Participants were given as much time as needed to make the judgment about whether the
object was rotated or not. For this task, the response options were “old”, “15°”, “25°”, “35°”,
“55°”. All stimuli were presented with E-Prime 2.0 software (Psychology Software Tools,
Pittsburgh, PA).
2.2.4 Analysis plan
Studies using the mnemonic similarity task have taken several approaches to analyze
PS/PC effects; however, these studies tend to use a particular measure to account for response
bias for similar trials in the recognition data (Stark et al., 2015). First, simple old/new
recognition for repeat items is calculated as the difference between the numbers of “old”
responses to repeated stimuli minus “old” responses to foils (i.e., new stimuli that were not
encountered at study). The purpose of this correction is to account for individual participant’s
between similar lures is measured using the lure discrimination index. This metric is calculated
as the number of “similar” responses given to lure trials minus the number of “similar” responses
given to foils. Again, this bias correction is used to correct for the overall tendency to say
“similar” versus correctly indicating a stimulus is similar. These two indices, as the dependent
variable in the model, are then entered into a 2 (Group: YA vs. OA) X 2 (Memory type: lure
discrimination index vs. recognition) x 2 (manipulation type) repeated measures analysis of
variance (ANOVA) to assess the effect of age and manipulation on the different assessments of
memory. This measure collapses across all levels of similarity and indicates whether OAs
experience a deficit in lure discrimination, as well as whether they have an overall impairment in
both old/new recognition and lure discrimination.
A more fine grained analysis involves the utilization of a metric that can be investigated
across all trial types. The lure discrimination index can also be calculated using “old” responses
to correct for bias. In this way, the lure discrimination index is calculated as 1 minus the
probability of “Old” responses for each trial type (i.e., the more likely you are to say “Old” the
lower the score). Regardless of how the lure discrimination index is calculated, investigating
behavioral changes along variations of similarity has been referred to as the behavioral tuning
curve (see Figure 1; Stark et al., 2013). In the current study, the tuning curve was analyzed in
two ways. In the first analysis strategy, the results were analyzed with a 2 (Group: YA vs. OA) x
2 (experimental manipulation) x 5 (trial type) repeated measures ANOVA. For the second
strategy, a linear multilevel model using random intercepts and slopes was used to model the
curve directly. Using a linear multilevel model has the added benefit of modeling the curve itself,
Regardless of how lure discrimination is measured, it is important to know if the
manipulations affected memory overall (e.g., old/new recognition, as well as lure discrimination)
or if they affected the lure discrimination to a greater extent than old/new recognition. If old/new
recognition and lure discrimination are affected equally, this would suggest that the manipulation
did not impact the bias to PS or PC per se, but affected the quality of the representation as a
whole. If the lure discrimination index is affected to a greater extent than that of old/new
recognition, this would suggest that the PC bias in aging is not only caused by altered mnemonic
processes supported by hippocampal function, but is caused by a combination of changes in
several domains that combine and lead to a PC bias. Thus the operational definition of reducing
or increasing the PC bias involves two metrics, 1) the lure discrimination index showing a
greater effect than old/new recognition, and 2) that the improvements in performance across
levels of similarity is delayed, such that more novelty is needed to PS. It is likely that both
metrics will provide complementary information; however, both of the metrics outlined provide
somewhat different information as to how the manipulations effect the PCB in aging. Therefore,
Chapter 3: Experiments and results 3.1 Experiment 1 - Processing speed and the completion bias
According to the limited time mechanism of the processing speed theory, as we age,
processing speed declines such that a greater amount of time is needed to complete the same
amount of processing as a YA (Salthouse, 1996a). Importantly, there is evidence that when OAs
are given a greater amount of time to make recognition judgments during the mnemonic
similarity task, the behavioral deficits are attenuated (Allen, Morris, Stark, Fortin, & Stark, 2015;
although see Stark et al., 2015 for an opposing finding). As indicated previously, Allen et al.
(2015) and Stark et al. (2015) manipulated time at decision making, leaving open the question as
to whether or not differential time at encoding allows OAs to compensate for their slower
processing speed and to encode representations that are similar to that of YAs.
Most studies in this line of research have provided both OAs and YAs with two to three
seconds to study the to-be-encoded materials (e.g., Stark et al., 2015; Toner et al., 2009; Yassa et
al., 2011a). Specifically, related to the type of encoding processes that might support the creation
of robust mental representations, it has been shown that not only do OAs tend to have slower
processing speed in general, but they also have slower ability to narrow their focus of attention,
requiring twice as long as YAs to selectively focus their attention (Jefferies et al., 2015).
Therefore, if OAs and YAs are given the same amount of time to encode a complex
representation, it is highly unlikely that OAs are able to attend to as many features as YAs,
To assess whether or not the strength of the encoded representation is impacted by the
rate of presentation at encoding, two different rates of presentation were given as a within
subjects manipulation to both YAs and OAs. For YAs, half of the stimuli were presented at a rate
of 1.25 sec and half were presented at a rate of 2.5 sec. For OAs, half of the stimuli were
presented at a rate of 2.5 sec and half were presented at a rate of 5 sec. For both groups, the rate
of presentation changed every 8 objects. Participants were also presented with a screen during
the regular fixation period indicating whether the next 8 objects would be presented at the fast or
slow rate. The rate of presentation that started the study trials was counterbalanced across
subjects.
If the PCB occurs because OAs are not able to complete the same type of processing in a
limited amount of time given, then two results should be observed. First, YAs, under conditions
that employ a 1.25 sec presentation rate for stimulus presentation, should show a bias toward PC,
as compared to a condition in which stimuli are presented 2.5 sec. Thus, an interaction between
rate of presentation, memory, and age would be found. This data pattern should emerge due to
the limited amount of processing that YAs are able to accomplish in the 1.25 sec condition,
mimicking the limited time mechanism that occurs in aging. Second, OAs, under conditions that
employ a 5 sec rate for stimulus presentation, should show a reduced PCB, as compared to a
condition in which stimuli are presented for 2.5 sec. Again, this pattern should be observed
because OAs should be able to accomplish a similar amount of processing as YAs when given
additional encoding time. In the analysis of old/new recognition and the overall lure
discrimination index, OAs should show a reduced lure discrimination index in the 5 sec
condition, while YAs in the 1.25 sec condition should show a lure discrimination deficit. In the
improvement in performance across degrees of rotation in the 5 sec condition while YAs in the
1.25 sec condition should exhibit a delay in the improvement of performance across degrees of
rotation.
3.1.1 Results
3.1.1.1 Participants
Twenty-five YAs and 25 OAs completed the experiment. We retained all participants’
data because no participant performed at chance for old/new recognition during either
presentation rates. Our OAs were significantly more educated, t(48) = -9.47, p < .001 . As
expected, our OAs were also slower to perform Trails A, t(48) = -4.17, p < .001, Trails B, t(48) =
-2.80, p = .007, color naming time, t(48) = -4.01, p < .001, word reading time, t(48) = -2.19, p =
.033, and color-word interference time, t(48) = -5.21, p < .001. As a more direct measure of
inhibition we subtracted the color naming time from the color-word interference time as is
recommended in the DKEFS scoring manual (Delis, Kaplan, & Kramer, 2001). This measure
was also significantly different between OAs and YAs, t(48) = -4.14, p < .001, suggesting that
OAs in our sample had reduced processing speed and reduced inhibitory processes. There were
no other group differences. See Table 1 for means and standard errors of all the cognitive
measures collected.
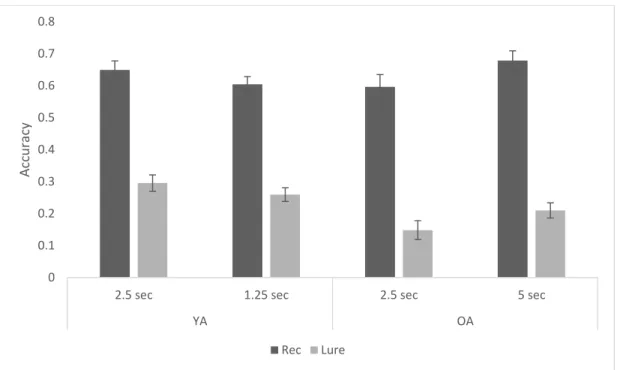
3.1.1.2 Old/New Recognition and the overall lure discrimination index
Recognition and lure discrimination index scores were calculated for each group and
within each speed condition and were analyzed with a 2(Group: YA vs. OA) x 2(rate of
presentation: standard (2.5 sec) vs. non-standard (1.25 or 5 sec)) x 2(Memory type: old/new
recognition vs. lure discrimination index) repeated-measures ANOVA (see Figure 3). There was
recognition was significantly better than lure discrimination. There was no main effect of group,
F(1,48) = 1.98, p = .166, ηp2 = .04, and no main effect of rate of presentation, F(1,48) = 2.59, p =
.114, ηp2 = .05. These effects were qualified by significant interactions between memory type
and group, F(1,48) = 6.97, p = .011, ηp2 = .13, as well as rate of presentation and group, F(1,48)
= 32.73, p < .001, ηp2 = .41. No other effects were significant. To better understand the memory
type by group interaction we conducted a t-test on the old/new recognition data averaged across
the rate of presentation. There was no significant difference between old/new recognition
between OAs and YAs, t(48) = -.26, p = .800, indicating the interaction resulted from a deficit in
OAs lure discrimination as compared to YAs. The results replicate prior findings from Stark and
colleagues (2013) and support the idea that OAs perform worse on lure discrimination as
compared to YAs, despite maintaining similar performance for old/new recognition. The rate of
presentation by group interaction analysis also provided evidence that the rate of presentation
altered memory performance. When YAs were given a faster rate of presentation (M = .43, SD =
.09)their overall memory performance declined, as compared to the regular presentation rate (M
= .47, SD = .13), whereas when OAs were given a slower rate of presentation (M = .44, SD =
.11), their overall memory performance improved, as compared to the regular presentation rate
(M = .37, SD = .13).
3.1.1.3 Lure discrimination index results across all trials – repeated measures ANOVA
Analyzing data between two age groups often requires that differences in response biases
be accounted for in the data. In this study, I opted to use a previously established bias correction
of one minus the probability of indicating “old” to each trial type. This metric places all 3 trial
types (i.e., old, rotated, and new) on the same dependent variable, and assumes that the only
ability to indicate that a stimulus has been rotated. To ensure that this bias metric was
appropriate for this data set, I calculated rates of “new” responses both to new trials, and
separately, averaged across old and similar trials. T-tests revealed no significant differences
between YAs (M = 80.48, SD = 9.54) and OAs (M = 78.16, SD = 10.61) in rates of responding
“new” to new trials, t(48) = 0.81, p = .420, and no significant differences in YAs (M = 3.34, SD
= 1.69) and OAs (M = 2.91, SD = 1.5) rates of responding “new” to old or similar trials, t(48) =
0.94, p = .354. I also examined the rates of “new” only to old trials and rates of “new” only to
lure trials. No significant differences were found, all p’s > .18. Therefore, changes in the groups’
performance across the lure discrimination index was not influenced by a difference in the ability
to recognize an object as previously seen.
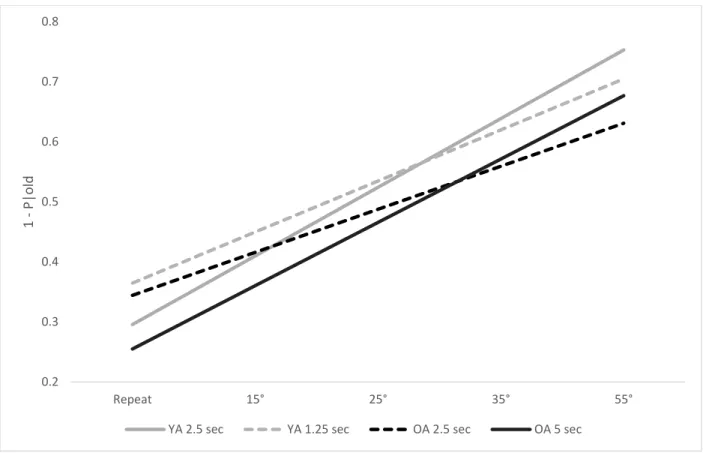
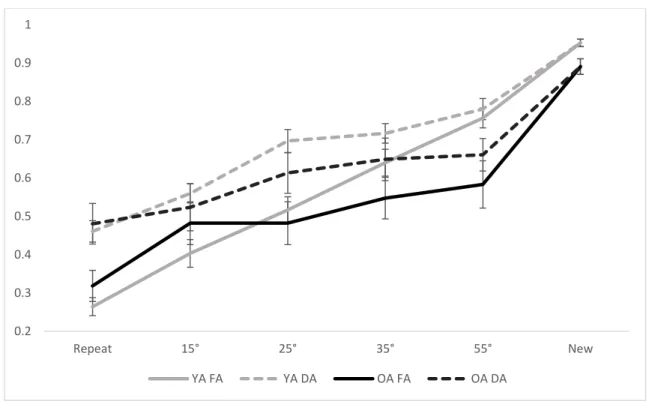
The lure discrimination index across all trials was analyzed using one minus the
probability of old as the dependent variable and a 2(Group: YA vs. OA) x 2(rate of presentation:
standard (2.5 sec) vs. non-standard (1.25 or 5 sec)) x 5(degree of rotation: repeat - 55°) repeated
measures ANOVA. Rate of presentation and degree of rotation were within subjects factor and
group was a between subjects factor (see Figure 4). Results revealed a significant main effect of
degree of rotation, F(4,192) = 121.93, p < .001, ηp2 = .72, such that performance improved
significantly across the increasing degrees of rotation. There was no main effect of rate of
presentation, F(1,48) = .23, p = .633, ηp2 = .01, but there was a significant main effect of group,
F(1,48) = 6.74, p = .012, ηp2 = .12, indicating that YAs performed better than OAs overall. There
were no significant interactions between rate of presentation and group, F(1,48) = 2.13, p = .151,
ηp2 = .04, degree of rotation and group, F(4,192) = 1.62, p = .170, ηp2 = .03, and rate of
presentation and degree of rotation, F(4,192) = .15, p = .964, ηp2 < .01. However, there was a
F(4,192) = 4.06, p = .004, ηp2 = .08. I conducted a repeated measures ANOVA independently at
each degree of rotation to probe the three way interaction with a between subjects factor of group
and a within subjects factor of rate of presentation. The only significant effect of group occurred
at 25° of rotation, F(1,48) = 10.30, p = .002, ηp2 = .18, and at 55° of rotation, F(1,48) = 7.73, p =
.008, ηp2 = .14. There were, however, significant (or marginally significant) interactions between
group and rate of presentation at 15° and 55°, p’s < .066, but no significant interaction between
group and rate of presentation when objects were rotated 25° and 35°, p’s > .715. In general,
YAs outperformed OAs across all degrees of rotation, except for when the objects are exact
repeats. Further, in the exact repeat condition, OAs in the 2.5 sec condition (M = .34, SD = .16)
and YAs in the 1.25 sec condition (M = .35, SD = .11) performed nearly identically, whereas,
both groups performed better when they were given more time to encode the materials (OAs 5
sec: M = .26, SD = .13; YAs 2.5 sec: M = .30, SD = .12). In sum, in the exact repeat condition,
both groups performed better during their respective slower rate of presentation. Further, in the
55° rotation condition, both groups performed better in the slower conditions (see Figure 4).
These results provide evidence that both OAs’ and YAs’ mnemonic performance was improved
when they were given more time to study the objects, suggesting that the rate of presentation
affects pattern separation processes, and that processing speed is an important factor in efficient
PS in both OAs and YAs.
3.1.1.4 Lure discrimination index results across all trials – Multilevel model
The advantage of a repeated measures ANOVA in this context is the comparison of mean
differences in performance at each level of the task. A complementary way to look at the data is
to investigate how YAs’ and OAs’ performance changes across the different degrees of rotation,
I implemented a multi-level model since such models properly account for nesting, in this case
degrees of rotation within people, and account for the correlated residuals within the data set. In
support of this choice, I calculated an intra-class correlation (ICC) by running a model with no
predictors and a random intercept. An ICC provides a measure of how much variance in the
model comes from within subjects as compared to between subjects. The ICC for the current
model was .14, indicating that 14% of the variance came from between subjects. Of note, a
repeated measures ANOVA would make the assumption that this value is zero. Another
advantage of a multi-level model is that it allows for the measurement of within-person change
over degrees of rotation, rather than measuring group mean change over degrees of rotation. This
procedure affords the opportunity to better understand how the individual’s memory
performance changes across rotation.
To build an appropriate model for the data set, I tested to ensure a linear model was the
best fit, as compared to a model with a quadratic term. Including a quadratic term caused a
marginally significant improvement in model fit, χ2(4) = 8.3, p = .081. The quadratic term was significant in this model, t(448) = -2.00, p = .046, however, the estimate of the fixed effect was
-.007 indicating that the slope curved less than a percent at each degree of rotation. Since there
was mixed support for including a quadratic term I did not include it in the final model. Also, the
added complexity of a model with a quadratic term is not warranted given the small estimate of
the fixed effect. I also tested the model to see if allowing for unequal variance between groups
improved model fit and, again, it did not, χ2(4) = 4.0, p = .406. The final model investigating the lure discrimination index, as calculated using one minus the probability of old, was a linear
model with random intercepts (i.e., performance on trials that were exact repeats) and random
effect of group, a within subjects effect of degree of rotation and rate of presentation, and used
YAs in the 2.5 sec condition as the reference group.
The analysis indicated there was no effect of group on the ability to indicate that an exact
repeat was old, t(48) = .90, p = .372, suggesting that when the rate of presentation was the same
between the two groups, the rate of endorsing repeated items as “old” was the same for both age
groups. The rate of presentation manipulation did have an effect on the ability to indicate an
exact repeat was “old” for both groups. An effect of rate of presentation on repeated objects
indicated YAs’ performance was significantly worse when they were given a faster rate of
presentation, t(444) = 2.41, p = .016, and an interaction between group and rate of presentation
on intercepts indicated OAs’ performance was significantly better when they were given a
slower rate of presentation, t(444) = -3.94, p < .001. Therefore, OAs in both rate of presentation
conditions were not significantly different in their ability to indicate a repeated object was “old”
as compared to YAs in the 2.5 sec rate of presentation condition. Young Adults, however,
performed worse during the 1.25 sec rate of presentation condition, as compared to the 2.5 sec
condition and OAs in the 5 sec rate of presentation condition. OAs in the 5000ms rate of
presentation condition performed better than YAs in the 1.25 sec rate of presentation condition
and OAs in the 2.5 sec rate of presentation condition (see Figure 5).
There was a significant effect of degree of rotation, t(444) = 12.71, p < .001, indicating
that YAs’ performance in the 2.5 sec rate of presentation condition improved with greater
rotation of the object. The rate of improvement was significantly worse for OAs in the 2.5 sec
condition, compared to YAs in the 2.5 sec condition, as indicated by a significant interaction
between rotation and group, t(444) = -3.55, p < .001. The rate of improvement for YAs in the
a significant interaction between rotation and rate of presentation, t(444) = -2.48, p = .014.
Finally, OAs in the 5 sec condition’s rate of improvement was significantly better than OAs in
the 2.5 sec condition as indicated by a significant three way interaction, t(444) = 3.82, p < .001.
See Table 2 for parameter estimates.
To better understand the pattern of the results, I calculated simple effects for intercepts
and slopes (see model implied results in Figure 6). The pattern of results indicates that OAs,
regardless of the rate of presentation manipulation, were not significantly different in their ability
to indicate a repeated object is “old” as compared to YAs in the 2.5 sec condition. Further, OAs’
performance in the 5 sec conditions improved (slope = .106) in a similar manner to that of YAs’
performance in the 2.5 sec rate of presentation condition (slope = .117). Older adults in the 2.5
sec condition also exhibited similar rates of improvement (slope = .072), as YAs in the 1.25 sec
condition (slope = .088). Finally, to determine whether the rate of presentation manipulation
matched the performance between OAs and YAs, I conducted two t-tests on slopes (i.e., rate of
improvement across degrees of rotation). Despite the improvement in slopes for OAs in the 5 sec
condition, these participants still had a significantly lower slope than YAs in the 2.5 sec
condition, t(48) = 3.63, p = .001. Similarly, YAs in the 1.25 sec condition had a steeper slope
than OAs in the 2.5 sec condition, t(48) = 5.31, p < .001. Therefore, a slower rate of presentation
significantly improved OAs slopes; however, it did not completely attenuate the deficit in
memory. A faster rate of presentation significantly decreased YAs slopes. However, they still
improved across trials more rapidly than OAs in the 2.5 sec condition. Processing speed
3.1.1.5 Rotation test
Participants were generally quite poor at indicating the exact degree of rotation during the
rotation test. Therefore, I collapsed all estimates of degree of rotation into a single metric of
correctly indicating whether an object was rotated or not. There was a significant difference in
YAs and OAs ability to discern whether an object was rotated or not as revealed by the rotation
test. This difference was significant for accurately indicating an object was an exact repeat, t(48)
= 2.22, p = .031, indicating an object was rotated, t(48) = 3.15, p = .003, and for overall
performance on the rotation test, t(48) = 3.69, p = .001, with YAs (M = .90, SD = .06)
outperforming OAs (M = .83, SD = .08) overall. Since there was a group difference in the ability
to discern whether an object was rotated outside the long term memory aspects of the regular
task, I performed follow up analyses controlling for overall rotation test performance for both the
repeated measures ANOVA and the multilevel model that investigated the lure discrimination
index across all trials. Importantly, the three-way interaction between group, rate of presentation,
and rotation remained significant in the repeated measures ANOVA analysis. Further, the pattern
of results in the multilevel model remained unchanged after controlling for performance on the
rotation test. In combination, these follow up analyses indicate that group differences in the
ability to assess rotation in short term memory is not the primary factor for group differences in
the ability to notice small changes in long term mnemonic representations.
3.1.1.6 Individual differences in the lure discrimination index
Experiment 1 manipulated processing speed to assess whether there is a significant
impact of duration at encoding on measures of pattern separation. While the evidence suggests
that processing speed does significantly moderate the PCB in aging, it is also important to
aging. Prior research has investigated individual differences associated with pattern separation
(e.g., Toner et al., 2009; Stark et al., 2010). However, both studies had much smaller sample
sizes, collected cognitive measures only in OAs, and rarely found significant effects. This leaves
open the question as to what types of non-mnemonic cognitive processes, may support efficient
PS. It is likely that the lack of significant correlations has contributed to the general notion that
PS and PC processes in some ways operate in a vacuum.
As an exploratory analysis, I extracted each individuals’ intercept (i.e., model implied
performance on old trials), slope (i.e., rate of improvement across the degrees of rotation) and
lure trial performance, and correlated that number to their scores on digit span forward and
backward, trails A and B, and the measure of inhibition derived from subtracting the color
naming time from the color-word interference time. First, I combined both OAs and YAs in the
2.5 sec condition into a single group (n = 50). In this condition, both groups were exposed to the
same task, and therefore, it is appropriate to assume that the scores in both groups represent the
same basic effect. Second, I ran the same correlations with YAs in the 1.25 sec condition as a
single group (n = 25) and OAs in the 5 sec condition as a single group (n = 25). Across all
exploratory analyses I performed 45 correlations. A Bonferroni corrected alpha value (i.e.,
.05/45) is .001; however, all significant correlations below an alpha of .05 are reported for
completeness.
Correlations derived from the 2.5 sec condition revealed that measures of processing
speed and inhibition were found to be significantly correlated with both intercepts and slopes.
Participants intercepts were significantly positively correlated with time on Trails B, r(47) = .34,
p = .016. Since Trails B is thought to measure processing speed along with executive function,