EXAMINING THE RELATIONSHIPS AMONG COGNTIVE
PROCESSING, PHYSICAL FUNCTION, AND DISABILITY IN
OLDER ADULTS
by
Lori A. Schrodt
A dissertation submitted to the faculty of The University of North Carolina at Chapel Hill in partial fulfillment of the requirements for the degree of Doctor of Philosophy in the School of Medicine (Program in Human Movement Science).
Chapel Hill 2005
Approved by,
iii
ABSTRACT
LORI A. SCHRODT: Examining the Relationships Among Cognitive Processing, Physical Function, and Disability in Older Adults
(Under the direction of Carol A. Giuliani)
iv
v To Andrew:
vi
ACKOWLEDGEMENTS
There are many for whom I am grateful in the support of my pursuit of a doctoral degree. In particular, I would like to thank the University of North Carolina Institute on Aging and the Carolina Program in Healthcare and Aging Research for financial support and invaluable educational training. I would also like to thank the Graduate School of The University of North Carolina at Chapel Hill for its financial support.
For both professional and financial support I owe a special thanks to Dr. Carol Giuliani, PT, PhD of The University of North Carolina at Chapel Hill Program in Human Movement Science in the Department of Allied Heath Sciences of the School of Medicine at the University of North Carolina at Chapel Hill who’s guidance was invaluable during the course of this effort.
vii
TABLE OF CONTENTS
LIST OF TABLES………... ix
LIST OF FIGURES………... xii
LIST OF ABBREVIATIONS AND SYMBOLS..……… xiii
Chapter
I. INTRODUCTION………... Thesis……….… First Study……….. Second Study……….. Third Study……… References………..
1 4 5 6 7 8 II. FIRST MANUSCRIPT
Examining the relationships among cognitive processing, physical function,
and disability in older adults……….. 10 III. SECOND MANUSCRIPT
Examination of the relationship of cognitive processing to future declines in
physical function and increased disability in older adults………. 41 IV. THIRD MANUSCRIPT
Examination of the relationship of cognitive processing to difficulty and
viii V. SYNTHESIS
Summary of major findings………..……. Significance……… Strengths and weakness………. Future Research……….. References………... 102 111 112 115 116 APPENDICES
A. Literature Review………. B. Protocol and Testing Forms
Form 1: Health status questionnaire……….. Form 2: Center for Epidemiologic Studies Depression Scale (CES-D).... Form 4: Katz Activities of Daily Living Scale……….. Form 5: Symbol Digit Modalities Test……….. Form 6: Trail Making Test Part B………. Form 7: Physical Performance Test………... Form 8: Timed 360-degree Turn………... Form 9: Walking Speed………. Form 10: SF-36 Questionnaire………... Form 11: OARS Instrumental Activities of Daily Living Scale…………. Form 12: Difficulty and Dependence Questionnaire………..
ix
LIST OF TABLES
Table 2.1 Participant demographic characteristics (Manuscript 1)……….. 34 Table 2.2 Medical conditions reported by participants (Manuscript 1)………... 34 Table 2.3 Descriptive statistics for measures of cognitive processing, physical
function, and disability. (Manuscript 1)... 35 Table 2.4 Correlation matrix of associations among cognitive processing,
physical function, and disability measures (Pearson r)
(Manuscript 1)……….. 35
Table 2.5 Unstandardized and standardized coefficients for the direct and indirect effects of cognitive processing (CP) on PF-10 scores via the Physical Performance Test (PPT) (Manuscript 1)……… 36 Table 2.6 Unstandardized and standardized coefficients for the direct and
indirect effects of cognitive processing (CP) on PF-10 scores via
walking speed (WS). (Manuscript 1)………... 36 Table 2.7 Unstandardized coefficients for the direct and indirect effects of
cognitive processing (CP) on PF-10 scores via the Physical
Performance Test (PPT) and walking speed (WS). (Manuscript 1)…. 37 Table 2.8 Contrast between the indirect effects of cognitive processing (CP)
on PF-10 via the Physical Performance Test (PPT) and via walking
speed (WS). (Manuscript 1)………. 37 Table 2.9 Unstandardized and standardized coefficients for effect modification
of cognitive processing (CP) on the relationship between PPT and
PF-10 scores. (Manuscript 1)………... 38 Table 2.10 Unstandardized and standardized coefficients for effect modification
of cognitive processing (CP) on the relationship between walking
speed (WS) and PF-10 scores. (Manuscript 1)………. 38 Table 3.1 Baseline demographic characteristics, performance scores, and
medical conditions for participants and non-participants.
(Manuscript 2)……….. 70
Table 3.2 Baseline and one year follow-up participant characteristics (N=56)
(Manuscript 2)……… 71
x
Table 3.4 Participants demonstrating clinically meaningful decline on physical function and disability outcome measures at one year.
(Manuscript 2) ………. 72
Table 3.5 Linear regression results examining relationships between baseline cognitive processing and change in physical function and disability
over one year (N=56). (Manuscript 2)... 73 Table 3.6 Goodness of fit for logistic regression models examining
relationships of baseline cognitive processing to disability and
decreased independent function. (Manuscript 2)………. 73 Table 3.7 Logistic regression coefficients and odds ratios examining
relationship of baseline cognitive processing to disability and
decreased independent function at one year. (Manuscript 2)………... 74 Table 3.8 Linear regression results examining relationships between change in
cognitive processing and change in physical function and disability
one year later (N=56). (Manuscript 2)……... 74 Table 3.9 Goodness of fit for logistic regression models examining
relationships of change in cognitive processing to disability and
decreased independent function at one year (N=56). (Manuscript 2).. 75 Table 3.10 Logistic regression coefficients and odds ratios examining
relationships between change in cognitive processing and disability
over one year (N=56). (Manuscript 2)……….. 75 Table 4.1 Items included on the difficulty and dependence scales. Participants
responded to levels of difficulty and dependence for each activity.
(Manuscript 3)……….. 95
Table 4.2 Participant demographic characteristics (N=72). (Manuscript 3)…… 95 Table 4.3 Medical conditions reported by participants (Manuscript 3)………... 96 Table 4.4 Descriptive statistics for measures of cognitive processing, difficulty
and dependence disability. (Manuscript 3)………... 96 Table 4.5 Frequency reports of difficulty and dependence disability.
(Manuscript 3)……….. 97
xi
Table 4.7 Participants reporting disability on one or more items defined as
difficulty or dependence. (Manuscript 3)……….… 98 Table 4.8 Goodness of fit for logistic regression models examining
relationships between cognitive processing and disability defined as
difficulty and dependence. (Manuscript 3)……….. 98 Table 4.9 Logistic regression coefficients and odds ratios examining
relationships between cognitive processing and disability defined as
difficulty and dependence. (Manuscript 3)………... 98 Table 4.10 Goodness of fit for logistic regression models examining
relationships between cognitive processing and mobility task and
IADL dependence. (Manuscript 3)………...… 99 Table 4.11 Logistic regression coefficients and odds ratios examining
relationships between cognitive processing and mobility task and
xii
LIST OF FIGURES
Figure 2.1a Direct and indirect effects of cognitive processing on physical function and disability via a single physical function measure.
(Manuscript 1)……….. 39
Figure 2.1b Direct and indirect effects of cognitive processing on physical function and disability via two physical function measures.
(Manuscript 1)……….. 39
Figure 2.1c Effect modification of cognitive processing on the relationship
between physical function and disability. (Manuscript 1)………….. 40 Figure 4.1a Distribution of SDMT scores. (Manuscript 3)………. 100 Figure 4.1b Distribution of TMTB scores. (Manuscript 3)……….… 100 Figure 4.2 Percent of participants reporting disability in one or more items by
xiii
LIST OF ABBREVIATIONS AND SYMBOLS
ADL Activities of daily living BADL Basic activities of daily living
CCRC Continuing care retirement community
CES-D Center for Epidemiologic Studies Depression Scale
CI Confidence Interval
EPESE Established Populations for Epidemiological Studies of the Elderly FICSIT Frailty and Injuries Cooperative Studies of Intervention Techniques IADL Instrumental activities of daily living
MMSE Mini Mental State Exam
OARS Older Americans Research and Service Center Instrument (IADL)
OR Odds Ratio
PF Physical Function
PF-10 Physical Function sub-scale of the SF-36 PPT Physical performance test
SDMT Symbol Digit Modalities Test
SE Standard Error
SF-36 Medical Outcomes Study Questionnaire- Short Form SPMSQ Short Portable Mental Status Questionnaire
TMT Trail Making Test
TMTA Trail Making Test Part A TMTB Trail Making Test Part B
xiv
WS Walking Speed
CHAPTER I
INTRODUCTION
Independent and safe performance of daily living and mobility tasks requires the interaction of cognitive and physical functions. Presently, the relationships between specific aspects of cognitive and physical function and how they contribute to disability in older adults are not well understood. Gaining a better understanding of the relationships between specific aspects of cognition and physical function and how they contribute to everyday task performance is important for identifying impairments that may contribute to current or future functional limitations and disability. Furthermore knowledge of these relationships will provide guidance for developing prevention and rehabilitation programs.
Poor performance on general cognitive screening measures, such as the Mini Mental State Exam (MMSE)1 and Short Portable Mental Status Questionnaire (SPMSQ),2 is
2
disability is critical for designing appropriate intervention programs effective for preserving independence among older adults for as long as possible.
Age-related declines in attention and processing speed are well documented and may contribute to limitations in performing daily living tasks as people age.8-13 Older adults frequently demonstrate decreased performance with visual aspects of attention, such as visual scanning and selection of visual cues from the environment, that are important for
performing daily tasks, such as walking and driving.14,15 Slowed processing speed is
theorized to contribute to the age-related impairments observed in other aspects of cognition, such as memory and problem solving.16 Slowed processing speed may therefore impair an older individual’s ability to organize and sequence both the cognitive and physical aspects of daily tasks and make decisions on how to adapt to changing environments or situations. Cross-sectional research demonstrates stronger associations of attention and
processing speed to physical function17 and ADL and IADL performance18 than other aspects of cognition, such as memory. Several studies provide evidence that poor performance on attention and processing speed measures is associated with poorer performance of physical function skills (such as balance and walking), ADL, IADL, and increased risk of falls.17-23 However, the direct and indirect effects of attention and processing speed on physical function and disability and the prediction of future changes in physical function and disability based on attention and processing speed have not yet been examined.
3
relationships. The first study (Chapter II) examined the direct and indirect effects of cognitive processing on physical function and disability. We also compared the magnitude of the mediating effects of two physical function measures on the relationship between cognitive processing and disability. The second study (Chapter III) examined the predictive relationship of cognitive processing to changes in physical function and disability at one-year follow-up. We also examined the association of change in cognitive processing to change in physical function and disability. In the third study (Chapter IV) we explored the relationship of cognitive processing to self-reported disability measured as difficulty and measured as dependence with daily tasks.
4
Thesis Summary
The central idea for the dissertation is that
Cognitive processing is associated with both concurrent and future levels of physical
function and disability in older adults.
THEORETICAL MODEL
This model guides the theorized relationships among cognitive processing physical function, and disability.
To validate this assumption, the dissertation was organized into three studies. Cognitive
Processing
Physical Function
5
First Study
The objective of this study was to examine the direct and indirect effects of cognitive processing on physical function and disability.
Research Questions
1. Does cognitive processing demonstrate a direct effect on physical function?
Hypothesis: Cognitive processing demonstrates a direct effect on physical function.
2. Does cognitive processing demonstrate an indirect effect on disability mediated by physical function?
Hypothesis: Cognitive processing demonstrates an indirect effect on disability mediated by physical function.
2a. Is the magnitude of the indirect mediating effect of a comprehensive, multiple item physical function measure greater than that of a single-item physical function measure on the relationship between cognitive processing and disability?
Hypothesis: The magnitude of the indirect mediating effect of a comprehensive, multiple item physical function measure is greater than the indirect mediating effect of a single-item physical function measure.
3. Does cognitive processing demonstrate a direct effect on disability?
6
4. Does cognitive processing modify the relationship between physical function and disability?
Hypothesis: Cognitive processing modifies the relationship between physical function and disability.
Second Study
The objectives of this study were to examine: (1) the predictive relationship of cognitive processing to changes in physical function and disability one year later, and (2) the association of change in cognitive processing to change in physical function and disability over one year.
Research Questions
1. Does cognitive processing measured at baseline predict changes in physical function and disability after one year?
Hypothesis: Baseline cognitive processing predicts changes in physical function and disability after one year.
2. Is change in cognitive processing associated with changes in physical function, and disability after one year?
7
Third Study
The purpose of this study was to explore the relationship of cognitive processing to self-reported disability measured as dependence and measured as difficulty.
Research Question
1. Is the association of cognitive processing to self-reported disability stronger when disability is measured as difficulty than when it is measured as dependence?
Hypothesis: Cognitive processing is more strongly associated with disability when disability is measured as difficulty than when it is measured as dependence.
The results of the three studies were organized into three manuscripts. The first manuscript (Chapter II) addresses the direct and indirect effects of cognitive processing on physical function and disability. The second manuscript (Chapter III) describes the
8 REFERENCES
1. Folstein MF, Folstein SE, McHugh PR. Mini-Mental State: A practical method for grading the cognitive state of the patient for the clinician. Journal of Psychiatric Research. 1975;12:189-198.
2. Pfeiffer E. A short portable mental status questionnaire for the assessment of organic brain deficits in elderly patients. J Am Geriatr Soc. 1975;23:433-441.
3. Blaum CS, Ofstedal MB, Liang J. Low cognitive performance, comorbid disease, and task-specific disability: findings from a nationally representative survey. J Gerontol: Med Sci. 2002;57A(8):M523-M531.
4. Fried LP, Ettinger WH, Lind B, Newman AB, Gardin J. Physical disability in older adults: a physiological approach. Cardiovascular Health Study Research Group. J Clin Epidemiol. 1994;47(7):747-760.
5. Gill TM, Williams CS, Richardson ED, Tinetti ME. Impairments in physical performance and cognitive status as predisposing factors for functional dependence among nondisabled older persons. J Gerontol: Med Sci. 1996;51A(6):M283-M288.
6. Greiner PA, Snowden DA, Schmitt FA. The loss of independence in activities of daily living: the role of low normal cognitive function in elderly nuns. Am J Public Health. 1996;86(1):62-66.
7. Njegovan V, Man-Son-Hing M, Mitchell SL, Molnar. The hierarchy of functional loss associated with cognitive decline in older persons. J Gerontol: Med Sci.
2001;56A(10):M638-M643.
8. Salthouse TA. Aging and measures of processing speed. Biol Psychol. 2000;54:35-54.
9. Earles JL, Salthouse TA. Interrelations of age, health, and speed. J Gerontol: Psychol Sci. 1995;50B(1):P33-P41.
10. Allen PA, Weber TA, Madden DJ. Adult age differences in attention: filtering or selection? J Gerontol: Psychol Sci. 1994;49:213-222.
9
12. Rubichi S, Neri M, Nicoletti R. Age-related slowing of control processes: evidence from a response coordination task. Cortex. 1999;35(4):573-582.
13. Sliwinski M, Buschke H, Kuslansky G, Senior G, Scarisbrick D. Proportional slowing and addition speed in old and young adults. Psychol Aging. 1994;9(1):72-80.
14. Owsley C. Vision and driving in the elderly. Optom Vis Sci. 1994;71(12):727-735.
15. Owsley C, Burton-Danner K, Jackson GR. Aging and spatial localization during feature search. Gerontology. 2000;46(6):300-305.
16. Salthouse TA. The processing-speed theory of adult age differences in cognition.
Psychol Rev. 1996;103(3):403-428.
17. Binder EF, Storandt M, Birge SJ. The relation between psychometric test performance and physical performance in older adults. J Gerontol: Med Sci.
1999;54A(8):M428-M432.
18. Carlson MC, Fried LP, Xue QL, Bandeen-Roche K, Zeger SL, Brandt J. Association between executive attention and physical functional performance in community-dwelling older women. J Gerontol: Soc Sci. 1999;54B(5):S262-S270.
19. Lord SR, Clark RD, Webster IW. Postural stability and associated physiological factors in a population of aged persons. J Gerontol: Med Sci. 1991;46(3):M69-M76.
20. Lord SR, Lloyd DG, Li SK. Sensori-motor function, gait parameters and falls in community-dwelling women. Age Ageing. 1996;25:292-299.
21. Nevitt MC, Cummings SR, Kidd S, Black D. Risk factors for recurrent non-syncopal falls: a prospective study. JAMA. 1989;261:2663-2668.
22. Rosano C, Simonsick EM, Harris TB, et al. Association between physical and
cognitive function in health elderly: The Health, Aging and Body Composition Study.
Neuroepidemiology. 2005;24:8-14.
CHAPTER II
FIRST MANUSCRIPT
11 Abstract
Background. Prior research supports that cognitive processing is associated with level of independence in daily activities; however the complexities of this relationship are not well understood.
Purpose. To examine (1) the direct effects of cognitive processing on disability and the indirect effect mediated by physical function, and (2) if the relationship between physical function and disability is modified by cognitive processing.
Method. Volunteers (N=155) from a continuing care retirement community and church congregation (mean age 81.2 ± 5.7 years, 71% female) participated in a wellness assessment that included measures of cognitive processing, physical function, and disability. Cognitive processing, defined as performance on measures of attention and processing speed, was assessed with the Symbol Digit Modalities Test (SDMT) and the Trail Making Test Part B (TMTB). Raw SDMT and TMTB scores were transformed into z-scores to create a
composite score of cognitive processing. Physical function was assessed with the Physical Performance Test (PPT), and walking speed (WS). The SF-36 Physical Function Sub-scale (PF-10) assessed disability. Linear regression models were estimated to examine the relationships among cognitive processing, physical function, and disability.
12
of PPT or walking speed to PF-10 was not modified by level of cognitive processing as indicated by a non-significant interaction.
Conclusion. The relationship between cognitive processing and disability is primarily mediated by physical function, illustrating the importance of cognitive processing on physical function and its indirect relationship to disability.
13 INTRODUCTION
As people age, cognitive function decreases and is associated with limitations in performing daily activities.1-3 Although many older adults worry about memory loss, attention and processing speed also decline with advancing age and may contribute to
limitations in physical function and daily living tasks.1, 4-6 The complex relationships among various aspects of cognition, physical function, and disability are not well understood.
The cognitive processes of attention and processing speed are important for successful completion of both the cognitive and physical aspects of complex daily tasks. Attention and processing speed are reported to have stronger associations to physical function,7 and activities of daily living (ADL) and instrumental activities of daily living (IADL)8 than other aspects of cognition, such as memory. Attention and processing speed promote the cognitive organization, initiation, and sequencing of actions necessary for efficient information processing and performance of daily tasks; such as, finding objects on a crowded shelf, meal preparation, and walking.
Attention, especially visual aspects of attention such as visual scanning and selective attention, is particularly important for performing daily tasks that utilize external cues. For example, maintaining balance during walking requires an individual to select important information about the environment, such as the location of obstacles and movement of other persons, in order to adjust step placement and walking speed.
14
Salthouse proposed that slowed processing speed contributes to many of the age-related impairments observed in other aspects of cognition, such as working memory and problem solving.4 In this way, slowed processing speed may impair an older individual’s ability to organize and sequence daily tasks and make decisions on how to adapt to changing environments or situations. Impaired attention may also interfere with performance of daily tasks by reducing one’s ability to scan the environment and utilize external cues. The relationship between processing speed and balance, a physical function skill, is especially important because sufficient balance is required for successful performance of independent mobility and dynamic daily activities, such as walking and reaching.
Nagi9 proposed that impairments, theorized to result from disease, injury or developmental process, may increase the risk of functional limitations, which may consequently lead to disability. The extent to which physical function limitations and disability are associated with impairments in cognitive processing remains unclear.
Recent studies suggest that declines in attention and processing speed are associated with poorer performance of balance, walking, ADL, and IADL, and with an increased risk of falls.7, 8, 10-12 Because of the relationships of attention and processing speed to balance and other physical functions, and the well documented relationship of physical function to disability level,13-16 it is possible that physical function, and particularly balance, may play a role in mediating the relationship of attention and processing speed to disability.
15
immediate memory and recurrent falls. As with disability, falls often result from decreases in physical function.18, 19 The authors suggest that the attention-demanding nature of the
immediate memory test may have influenced the relationship between memory and recurrent falls. To our knowledge, the direct and indirect effects of attention and processing speed on physical function and disability have not been examined.
Complex daily living and mobility skills require the combination of physical and cognitive resources for independent function. Older adults with physical function limitations may need to rely more heavily on external cues and movement strategy adaptations to
maximize independence in ADL and IADL. Reduced attention and processing speed capabilities may modify the relationship between physical function and disability by
reducing one’s ability to visually scan the environment, direct attention, and process external cues quickly; thus decreasing the utilization of effective compensation strategies. Further examination of the complex relationships among age related changes in attention and processing speed, physical function, and disability is important for identifying impairments that may contribute to loss of independence.
16 METHOD
Study Design and Sample
This was a cross-sectional study using baseline data from the Be Alive project, a larger, ongoing longitudinal study promoting wellness and independence in older adults living in North Carolina. Participants in the Be Alive project were older adults living in the community or a continuing care retirement community (CCRC) who volunteered for on-site wellness assessments (N=195 at baseline) which consisted of a comprehensive battery of measures assessing cognitive and physical abilities. Individuals 50 years of age or older and able to walk independently with or without an assistive device were included in the Be Alive Project. Individuals with medical conditions precluding participation in physical
performance testing, such as uncontrolled hypertension or severe joint pain, were excluded from testing. Prior to testing, a brief medical screen assessing health history, pain,
medication use, and recent surgeries was administered by interview to identify participants with contraindications to performance testing. All participants signed an informed consent form approved by the UNC Chapel Hill School of Medicine Committee for the Protection of Human Subjects. Trained health professionals performed assessments in a single session lasting approximately 90 minutes.
17 Data Collection Procedure
Demographic and Health-Related Measures
Participants in the study completed a series of self-report questionnaires to gather demographic and health-related information. The self-report questionnaires included medical history, the Katz Activities of Daily Living Scale21 and the Older Americans Research and Service Center Instrument (OARS),22 a measure of IADL ability. Because research suggests that depression may contribute to poor cognitive function and disability,23, 24 we also
administered the Center for Epidemiologic Studies Depression Scale25 (CES-D) to identify participants who demonstrated depressive symptoms.
Cognitive, Physical Function, and Disability Measures
All timed performance measures were recorded to the nearest tenth of a second.
Cognitive Processing: Attention and Processing Speed Measures
We operationally defined cognitive processing as performance on measures of attention and processing speed, and selected these aspects of cognition because they are important to both the cognitive and physical aspects of daily tasks.4, 7, 8 We selected the Symbol Digit Modalities Test and the Trail Making Test Part B to measure attention and processing speed based on their sensitivity to age-related impairments and psychometric properties. Participants were tested in a quiet room and wore corrective eyewear if necessary.
18
version of the SDMT to reduce the influence of limited motor ability on test performance (e.g., participants with Parkinson’s Disease or arthritis). Scores were calculated as the total number of items correct in 90 seconds.
(b) Trail Making Test Part B (TMTB): The TMTB assessesvisual attention, processing speed, motor function, and mental flexibility.26, 29 This paper-and-pencil test requires connecting circles in alternating numerical and alphabetical sequence (e.g., 1-A-2-B, etc.) as quickly as possible. Scores were recorded as the time required to complete the test, up to a maximum of 180 seconds. Participants unable to complete the test in the maximum allowed time were assigned scores of 180 seconds.
Physical Function Measures
The Physical Performance Test,30 walking speed,16 and timed 360° turn,13 were used to assess physical function. These measures are performance based and can be administered to older adults with a wide range of ability levels.
(a) Physical Performance Test (PPT): The 7-item PPT was our primary measure of physical function because it assesses several aspects of upper and lower body function and mobility (writing, eating, lifting, dressing, bending, turning, and walking).30 For all items on the PPT except the 360° turn, the time to complete each task was recorded using a stopwatch and then translated into scaled scores ranging from 0 (poor performance) to 4 (best performance). The 360° turn item was scored on a 0-4 scale based on step continuity and steadiness. The
maximum possible score for the 7-item PPT is 28, representing the highest level of function.
19 16, 31
Walking speed was our secondary measure of physical function because it assesses physical mobility compared to the more comprehensive functional assessment, the PPT. Self-selected walking speed was assessed using a 10-meter walk course allowing for acceleration and deceleration by including 1-meter zones at both ends. Participants started walking at the beginning of the acceleration zone and timing started when the participant’s foot crossed the tape at the start of the 10-meter course, and stopped when the foot crossed the line at the end of the course. Two trials were completed and the average walking speed was calculated in meters/second.
(c) Timed 360° Turn (360° turn): The timed 360° turn was used to assess dynamic standing balance because it requires more complex sequencing than static measures of standing balance, such as tandem stance. The 360° turn is a single timed performance measure of balance13 and is an item in several performance-based tests for older adults, including the PPT,30 Berg Balance Scale,32 and the Performance-Oriented Assessment of Mobility
Problems.33 Participants were instructed to stand behind a line on the floor facing the tester and then turn completely around in either direction. Participants performed two trials and the average turn time was used for analysis.
Disability Measure
SF-36 Physical Function Sub-scale (PF-10): The Medical Outcome Survey Short Form (SF-36) is a self-report measure of health status in 8 domains (general health, physical
20
carrying groceries, vacuuming, bathing, and dressing) and because it is a responsive measure of physical abilities in community dwelling older adults.35 Participant responses for each sub-scale were converted to an index score ranging from 0 (worst health) to 100 (best health).34
Statistical Analysis
The data were analyzed using SPSS Version 12.0 (SPSS Inc.; Chicago, IL) and AMOS Version 4 (SmallWaters Corp.; Chicago, IL) statistical software. Univariate analyses of all variables were conducted to examine the data distribution, detect outliers, and
characterize the sample. Because the SDMT scores and TMTB scores were moderately correlated (r = -.63, p<.001), we constructed a composite score. Raw scores on the SDMT and TMTB were transformed to standard z-scores using the sample means and standard deviations. The z-scores were then averaged to create a composite measure of cognitive processing (Z-COG) for each participant.
21
test was used to determine whether the indirect effect of cognitive processing on disability was statistically significant (p < .05).36
For all models, residual analyses were conducted to confirm that the assumptions of linear regression analyses were met. Examination of the indirect effect of cognitive
processing on disability using the 360° turn as a mediating physical function variable was not conducted because the 360° turn residuals were not normally distributed.
To compare the magnitudes of the indirect effects of the two physical function measures (PPT and WS), we examined the specific indirect effects using a multiple mediator model (Fig 2.1b). The specific indirect effects represented in the multiple mediator model are the paths from cognitive processing to disability through PPT (a1b1) and through WS (a2b2). We first used the Sobel test36 to determine the significance (p < .05) of the specific indirect effects associated with PPT and WS in the multiple mediator model. Secondly, we calculated the 95% confidence interval around the difference between the two specific indirect effects (a1b1- a2b2), using the standard error calculation method described by
MacKinnon37 and expanded by Preacher and Hayes.38 The magnitude of the specific indirect effects of the PPT and WS were considered significantly different if the confidence interval around the difference excluded zero.
Multiple linear regression models were also estimated to examine the combined effect of cognitive processing, physical function, and the interaction of cognitive processing and physical function on disability (Figure 2.1c).
22
15,25 N=11), impaired global cognition (SPMSQ scores less than 9,20 N=9), or lived in the assisted living unit of the CCRC (N=18) were compared to regression models conducted with the entire sample.
RESULTS
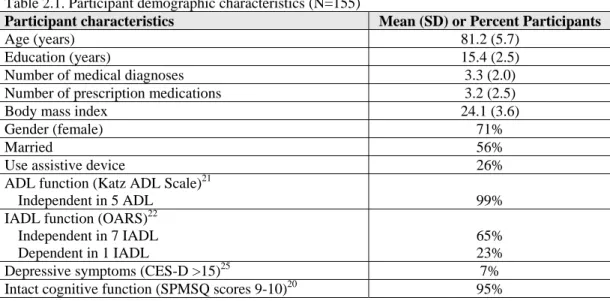
Participant characteristics are presented in Tables 2.1 and 2.2. Most participants were female (71%), lived independently (91%), and had greater than a high school education (84%). On average, participants reported fewer than four medical conditions and
prescription medications. Almost all participants were independent with ADL and 65% were independent with IADL.
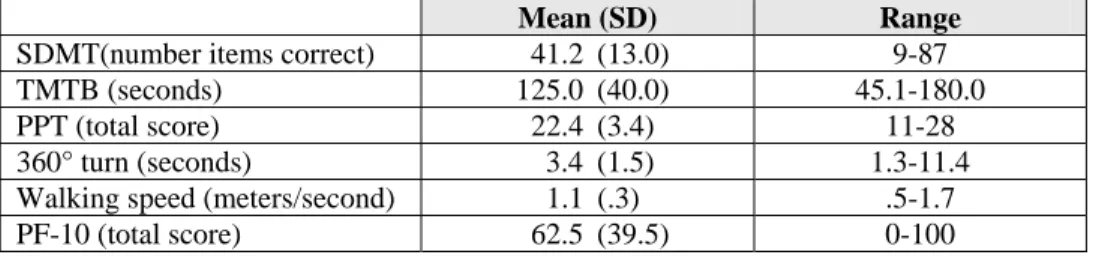
Descriptive statistics for cognitive processing, physical function and disability measures are presented in Table 2.3. A floor effect for TMTB performance was noted in 27 participants who scored 180 seconds. There were no ceiling or floor effects for the SDMT, physical function or disability measures.
The associations among cognitive processing, physical function, and disability measures are presented in Table 2.4. Higher levels of cognitive processing were consistently associated with higher levels of physical function and lower levels of disability (Pearson correlation coefficient range .42 to .60). Similar correlations were demonstrated across all cognitive processing measures with each physical function and disability measure.
23
Does cognitive processing demonstrate an indirect effect on disability mediated by physical
function?
The results of the regression analyses (Fig. 2.1a), examining direct and indirect effects of cognitive processing on PF-10, are presented in Tables 2.5 and 2.6. Because poorer scores on the TMTB are indicated by higher time scores and poorer scores on the PPT and PF-10 are indicated by lower scores, an inverse relationship is observed between the TMTB scores and the PPT and PF-10 scores. The total effect of cognitive processing on disability was significant (p <.001). Z-COG and the SDMT alone each accounted for 14% of the variance in disability, whereas the TMTB accounted for 10%. The indirect effects of cognitive processing on disability mediated by physical function (PPT and WS) were significant (p <.001). The direct effect of cognitive processing on disability was not significant. These results were similar across cognitive processing models.
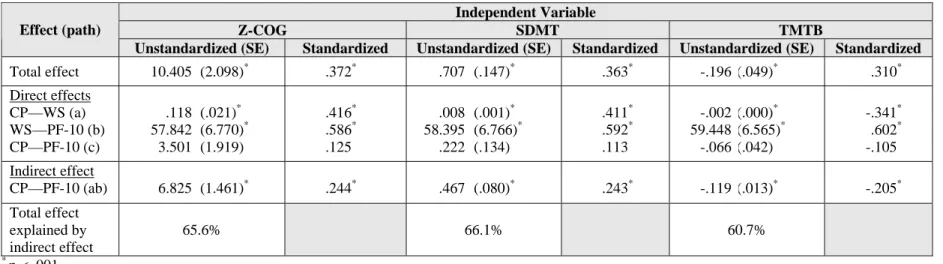
The results of the regression analyses including both PPT and WS as mediators of the relationship between cognitive processing and PF-10 (Fig. 2.1b) are presented in Table 2.7. The indirect effects of cognitive processing on PF-10 were significant for mediation through WS for all cognitive processing measures (p <.001). Indirect effects mediated through PPT were significant only for the individual SDMT and TMTB measures (p < .05 and p <.001, respectively).
24
Does cognitive processing modifying the relationship between physical function and
disability?
Tables 2.9 and 2.10 present the linear regression model coefficients examining the effect modification of cognitive processing on the relationship between physical function and disability. Analyses revealed that the relationship between either PPT or walking speed and disability was not altered by level of cognitive processing as indicated by the non-significant interaction.
DISCUSSION
These results support the hypothesis that the effects of cognitive processing on disability are mediated by physical function. Through this indirect path, decreased cognitive processing is associated with increased disability. These indirect effects were similar for the two measures of physical function, the PPT and walking speed. The results of this study did not support a direct effect between cognitive processing and disability. Levels of cognitive processing also did not modify the relationship between physical function and disability.
25
explained by the cognitive factor than for ADL. In addition, the TMTB alone was associated with IADLbut not ADL performance.8 Carlson and colleagues8 assessed ADL using timed performance on three skills; walking four meters, climbing stairs, and donning a pair of pants. These tasks are similar to the self-report items on the PF-10 and consistent with our finding of no direct effect of cognitive processing on disability.
Our finding that physical function mediates the relationship between cognitive
processing and disability is consistent with the hypothesis that attention and processing speed are important to the performance of physical functions, and balance in particular.7, 40 Slowed processing speed is associated with delayed initiation and decreased accuracy of balance responses.10 Poor performance on the SDMT and TMTB may be indicative of slowed processing, as well as a decreased ability to visually attend to and scan for environmental cues, such as surface properties and movement of other persons or objects, during daily activities. Delayed recognition and processing of these external cues may cause less efficient utilization of them for maintenance of balance during functional tasks. Because adequate balance abilities are important for safe and independent physical function, balance
impairments may result in physical function limitations and subsequent disability.
van Schoor and colleagues17 reported that immediate memory, processing speed, and MMSE scores were predictors of recurrent falls in adults aged 55 and older. However, immediate memory (abbreviated Auditory Verbal Learning Test41) was the only significant predictor after adjusting for age, depressive symptoms, and education. The authors
hypothesized that the relationship between immediate memory and falls risk may be
26
resulting in poorer immediate memory may indicate decreased attention to environmental cues during mobility tasks and contribute to an increased risk of falling. The authors also reported that the relationship between immediate memory and recurrent falls was mediated by grip strength, measures of physical function (walking and turning, chair stands, and tandem stance), and self-report of physical activity. Our results correspondingly demonstrate that physical function mediates the relationship between cognitive processing and disability.
The specific disability measures used in studying the relationships of cognitive processing to disability is an important discussion point. Owsley et al42 and Bell-McGinty et al39 used performance-based measures of disability (IADL) in demonstrating a relationship of choice reaction time42and TMTB39to disability. Carlson and colleagues8also used
performance-based measures of ADL and IADL and reported a stronger relationship for measures of attention and processing speed , particularly TMTB, to IADL than to ADL. Our measure of disability, the PF-10, is a self-report of primarily mobility-related ADL tasks and does not include higher order IADL items that require greater cognitive planning and
27
Comparison of the magnitude of the indirect mediating effects of PPT and walking speed demonstrated that both measures exhibited similar levels of mediation on the
relationship of cognitive processing to disability. Although the PPT is a more comprehensive measure of physical function, and includes items such as sentence writing that require greater emphasis on cognition, there was no difference in the magnitude of mediation when
compared to walking speed. The significant correlation between PPT and walking speed (r = .69) likely contributes to this finding.
Our finding that level of cognitive processing did not modify the relationship between physical function and disability may have been influenced by the relative high functioning of our sample. Older adults with greater limitations in physical function may require greater cognitive resources for problem solving and compensation of functional limitations than our participants did. In such individuals it is possible that the level of cognitive processing may influence the relationship between physical function limitations and disability. Further research should explore lower functioning older adults to examine the potential effect modification of cognitive processing on the relationship between physical function and disability.
28
Regression models including the individual cognitive processing measures
demonstrated similar results compared to models including the composite score, suggesting that a single measure (TMTB or SDMT) may be sufficient when examining the relationship of attention and processing speed to physical function and disability. In light of these similarities and the problem of a floor effect with the TMTB score, we suggest that the SDMT alone may be adequate for examining the role of cognitive processing in physical function and disability in this population.
Despite the significant contributions of cognitive processing to disability, the overall percent of the variance in disability explained by cognitive processing is relatively small (approximately 14%). Factors other than cognitive processing remain important in trying to explain and understand disability. Additional factors may include other aspects of cognition, such as working memory and learning, as well as other contributors to physical function, such as strength and balance.
Limitations
This sample of older adults was predominantly independent with daily activities and had a relatively high educational level limiting generalizability of these results to a more diverse and frail group of older adults. The relatively low level of disability in this sample also limited our ability to explore specific daily tasks that may be difficulty for older adults with cognitive processing deficits.
29
addition, by only excluding those who scored less than 6 on the SPMSQ20 it is possible that a few persons with dementia were included in this sample.
Our included measures also posed certain limitations. The SDMT and TMTB emphasize the cognitive processes of attention and processing speed; however, they are not pure measures of such and require other cognitive skills, such as working memory and learning. Therefore, it is difficult to ascertain the precise contribution of attention and processing speed to physical function and disability. As mentioned previously the omission of higher-level IADL, such as medication and finance management, from the PF-10 may have influenced our results of no direct effect between cognitive processing and disability. Future research should further examine the combined effects of cognitive processing and physical function on performance of IADL.
CONCLUSION
30 REFERENCES
1. Earles JL, Salthouse TA. Interrelations of age, health, and speed. J Gerontol: Psychol Sci. 1995;50B(1):P33-P41.
2. Gill TM, Williams CS, Richardson ED, Tinetti ME. Impairments in physical performance and cognitive status as predisposing factors for functional dependence among nondisabled older persons. J Gerontol: Med Sci. 1996;51A(6):M283-M288.
3. Njegovan V, Man-Son-Hing M, Mitchell SL, Molnar. The hierarchy of functional loss associated with cognitive decline in older persons. J Gerontol: Med Sci.
2001;56A(10):M638-M643.
4. Salthouse TA. The processing-speed theory of adult age differences in cognition.
Psychol Rev. 1996;103(3):403-428.
5. Plude DJ, Doussard-Roosevelt JA. Aging, selective attention and feature integration.
Psychol Aging. 1989;4:98-105.
6. Allen PA, Weber TA, Madden DJ. Adult age differences in attention: filtering or selection? J Gerontol: Psychol Sci. 1994;49:213-222.
7. Binder EF, Storandt M, Birge SJ. The relation between psychometric test performance and physical performance in older adults. J Gerontol: Med Sci.
1999;54A(8):M428-M432.
8. Carlson MC, Fried LP, Xue QL, Bandeen-Roche K, Zeger SL, Brandt J. Association between executive attention and physical functional performance in community-dwelling older women. J Gerontol: Soc Sci. 1999;54B(5):S262-S270.
9. Nagi SZ. An epidemiology of disability among adults in the United States. Milbank Mem Fund Q. 1976;54:439-467.
10. Lord SR, Clark RD, Webster IW. Postural stability and associated physiological factors in a population of aged persons. J Gerontol: Med Sci. 1991;46(3):M69-M76.
31
12. Nevitt MC, Cummings SR, Hudes ES. Risk factors for injurious falls: a prospective study. J Gerontol: Med Sci. 1991;46(5):M164-M170.
13. Gill TM, Williams CS, Tinetti ME. Assessing risk for the onset of functional
dependence among older adults: the role of physical performance. J Am Geriatr Soc.
1995;43:603-609.
14. Gill TM, Williams CS, Mendes de Leon CF, Tinetti ME. The role of change in physical performance in determining risk for dependence in Activities of Daily Living among nondisabled community-living elderly persons. J Clin Epidemiol.
1997;50(7):765-772.
15. Guralnik JM, Simonsick EM, Ferucci L, et al. A short physical performance battery assessing lower extremity function: association with self-reported disability and prediction of mortality and nursing home admission. J Gerontol: Med Sci.
1994;49:M85-94.
16. Guralnik JM, Ferucci L, Simonsick EM, Salive ME, Wallace RB. Lower-extremity function in persons over the age of 70 years as a predictor of subsequent disability.
New Engl J Med. 1995;332:556-561.
17. van Schoor NM, Smit JH, Pluijm SM, Jonker C, Lips P. Different cognitive functions in relation to falls among older persons. Immediate memory as an independent risk factor for falls. J Clin Epidemiol. 2002;55(9):855-862.
18. Tinetti ME, Speechley M, Ginter SF. Risk factors for falls among elderly persons living in the community. N Engl J Med. 1988;319:1701-1707.
19. VanSwearingen JM, Paschal KA, Bonino P, Chen TW. Assessing recurrent fall risk of community-dwelling, frail older veterans using specific tests of mobility and the Physical Performance Test of Function. J Gerontol: Med Sci. 1998;53A(6):M457-M464.
20. Pfeiffer E. A short portable mental status questionnaire for the assessment of organic brain deficits in elderly patients. J Am Geriatr Soc. 1975;23:433-441.
21. Katz S, Ford A, Moskowitz R, Jackson B, Jaffe M. Studies of illness in the aged. The Index of ADL: a standardized measure of biological and psychological funtion.
32
22. Fillenbaum GG. Screening the elderly. A brief instrumental activities of daily living measure. J Am Geriatr Soc. 1985;33(10):698-706.
23. Yaffe K, Blackwell T, Gore R, Sands L, Reus V, Browner WS. Depressive symptoms and cognitive decline in nondemented elderly women: A prospective study. Arch Gen Psychiatry. 1999;56:425-430.
24. Berkman LF, Berkman CS, Kasl S, et al. Depressive symptoms in relation to physical health and functioning in the elderly. Am J Epidemiol. 1986;124(3):372-388.
25. Radloff LS. The CES-D scale: A self-report depression scale for research in the general population. Applied Psychological Measurement. 1977;1:385-401.
26. Spreen O, Strauss E. A compendium of neuropsychological tests: Administration, norms, and commentary. New York: Oxford University Press; 1998.
27. Lezak MD. Neuropsychological assessment. New York: Oxford University Press; 1995.
28. Smith A. Symbol Digit Modalities Test Manual. Los Angeles, CA: Western Psychological Services; 1982.
29. Reitan RM, Wolfson D. The Halstead-Reitan Neuropsychological Test Battery. Tucson, AZ: Neuropsychology Press; 1985.
30. Reuben DB, Siu AL. An objective measure of physical function of elderly
outpatients: the Physical Performance Test. J Am Geriatr Soc. 1990;38:1105-1112.
31. Onder G, Penninx B, Lapuerta P, et al. Change in physical performance over time in older women: The Women's Health and Aging Study. J Gerontol: Med Sci.
2002;57A(5):M289-M293.
32. Berg K, Dauphinee S, Williams JI, Gayton D. Measuring balance in the elderly: preliminary development of an instrument. Physiother Can. 1989;41(6):304-311.
33
34. McHorney CA, Ware JE, Lu JFR, Sherbourne CD. The MOS 36-Item Short Form Health Survey (SF-36): III. tests of data quality, scaling assumptions, and reliability across diverse patient groups. Med Care. 1994;32(1):40-66.
35. Wolinsky FD, Wan GJ, Tierney WM. Changes in the SF-36 in 12 months in a clinical sample of disadvantaged older adults. Med Care. 1998;36(11):1589-1598.
36. Sobel ME. Asymptotic intervals for indirect effects in structural equations models. In: (Ed.) SL, ed. Sociological methodology. San Francisco: Jossey-Bass; 1982:290-312.
37. MacKinnon DP. Contrasts in multiple mediator models. In: J.S. Rose LC, C.C. Pressson, & S.J. Sherman (Eds.), ed. Multivariate applications in substance use research: New methods for new questions. Mahwah, NJ: Erlbaum; 2000.
38. Preacher KJ, Hayes AF. Normal-theory and resampling tests of indirect effects in single and multiple mediator models. Manuscript in preparation.
39. Bell-McGinty S, Podell K, Franzen M, Baird AD, Williams MJ. Standard measures of executive function in predicting instrumental activities of daily living in older adults. Int J Geriatr Psychiatry. 2002;17:828-834.
40. Owsley C, McGwin G. Association between visual attention and mobility in older adults. J Am Geriatr Soc. 2004;52(11):1901-1906.
41. Rey A. L'Examen clinique en psychologie. Paris: Presse universitaire de France; 1964.
42. Owsley C, Sloane M, McGwin G, Ball K. Timed instrumental activities of daily living: Relationship to cognitive function and everyday performance assessments in older adults. Gerontology. 2002;48:254-265.
34
Table 2.1. Participant demographic characteristics (N=155)
Participant characteristics Mean (SD) or Percent Participants
Age (years) 81.2 (5.7)
Education (years) 15.4 (2.5)
Number of medical diagnoses 3.3 (2.0)
Number of prescription medications 3.2 (2.5)
Body mass index 24.1 (3.6)
Gender (female) 71%
Married 56%
Use assistive device 26%
ADL function (Katz ADL Scale)21
Independent in 5 ADL 99%
IADL function (OARS)22 Independent in 7 IADL Dependent in 1 IADL
65% 23%
Depressive symptoms (CES-D >15)25 7%
Intact cognitive function (SPMSQ scores 9-10)20 95%
Notes: OARS = Older Americans Research and Service Instrument, IADL Scale CES-D = Center for Epidemiologic Studies—Depression; SPMSQ = Short Portable Mental Status Questionnaire
Table 2.2. Medical conditions reported by participants N (%)
Arthritis 96 (61.9)
Hypertension 66 (42.6)
Urinary dysfunction 51 (32.9)
Cancer 50 (32.3)
Osteoporosis 43 (27.7)
Heart disease 36 (23.2)
Fracture 35 (22.6)
Pulmonary disease 28 (18.1)
Dizziness 23 (14.8)
Stroke 12 (7.7)
Headache 10 (6.5)
35
Table 2.3. Descriptive statistics for measures of cognitive processing, physical function, and disability.
Mean (SD) Range
SDMT(number items correct) 41.2 (13.0) 9-87
TMTB (seconds) 125.0 (40.0) 45.1-180.0
PPT (total score) 22.4 (3.4) 11-28
360° turn (seconds) 3.4 (1.5) 1.3-11.4
Walking speed (meters/second) 1.1 (.3) .5-1.7
PF-10 (total score) 62.5 (39.5) 0-100
Table 2.4. Correlation matrix of associations among cognitive processing, physical function, and disability measures (Pearson r)
Z-COG SDMT TMTB
Physical Function
PPT total score .60 .56 -.53
Timed 360° turn -.46 -.44 .39
Walking speed .42 .41 -.34
Physical Disability
PF-10 .37 .36 -.31
Table 2.5. Unstandardized and standardized coefficients for the direct and indirect effects mediated by the Physical Performance Test (PPT) of cognitive processing (CP) on PF-10 scores
Independent Variable
Z-COG SDMT TMTB
Effect (path)
Unstandardized (SE)
Standardized Unstandardized (SE) Standardized Unstandardized (SE) Standardized
Total effect 10.405 (2.098)* .372* .707 (.147)* .363* -.196 (.049)* .310*
Direct effects CP—PPT (a) PPT—PF-10 (b) CP—PF-10 (c) 2.296 3.853 1.559 (.246)* (.618)* (2.355) .603* .525* .056 .149 3.799 .142 (.018)* (.595)* (.158) .560* .518* .073 -.046 4.024 -.012 (.006)* (.582)* (.050) -.529* .548* -.020 Indirect effect
CP-PF-10 (ab) 8.846 (1.713)* .317* .566 (.112)* .290* -.185 (.036)* -.290*
Total effect explained by indirect effect
85.0% 80.0% 94.4%
*
p < .001
Table 2.6. Unstandardized and standardized coefficients for the direct and indirect effects mediated by walking speed (WS) of cognitive processing (CP) on PF-10 scores
Independent Variable
Z-COG SDMT TMTB
Effect (path)
Unstandardized (SE) Standardized Unstandardized (SE) Standardized Unstandardized (SE) Standardized
Total effect 10.405 (2.098)* .372* .707 (.147)* .363* -.196 (.049)* .310*
Direct effects CP—WS (a) WS—PF-10 (b) CP—PF-10 (c) .118 57.842 3.501 (.021)* (6.770)* (1.919) .416* .586* .125 .008 58.395 .222 (.001)* (6.766)* (.134) .411* .592* .113 -.002 59.448 -.066 (.000)* (6.565)* (.042) -.341* .602* -.105 Indirect effect
CP—PF-10 (ab) 6.825 (1.461)* .244* .467 (.080)* .243* -.119 (.013)* -.205*
Total effect explained by indirect effect
65.6% 66.1% 60.7%
*
p < .001
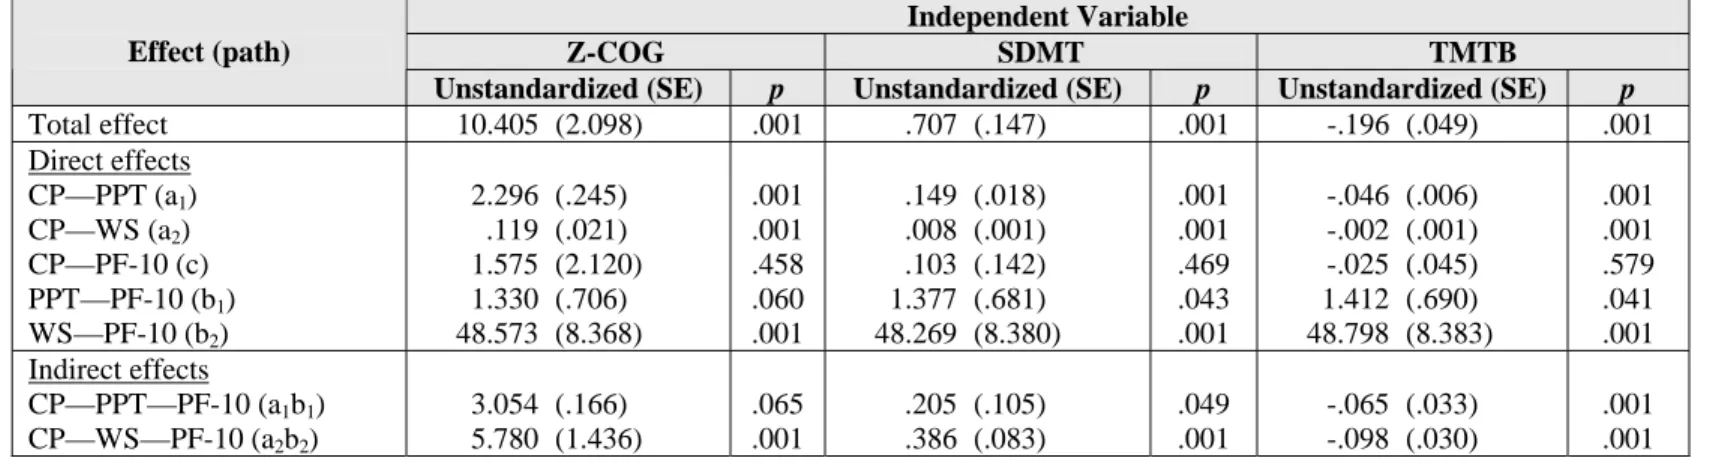
Table 2.7. Unstandardized coefficients for the direct and indirect effects mediated by the Physical Performance Test (PPT) and walking speed (WS) of cognitive processing (CP) on PF-10 scores
Independent Variable
Z-COG SDMT TMTB
Effect (path)
Unstandardized (SE) p Unstandardized (SE) p Unstandardized (SE) p
Total effect 10.405 (2.098) .001 .707 (.147) .001 -.196 (.049) .001
Direct effects CP—PPT (a1)
CP—WS (a2)
CP—PF-10 (c) PPT—PF-10 (b1)
WS—PF-10 (b2)
2.296 .119 1.575 1.330 48.573 (.245) (.021) (2.120) (.706) (8.368) .001 .001 .458 .060 .001 .149 .008 .103 1.377 48.269 (.018) (.001) (.142) (.681) (8.380) .001 .001 .469 .043 .001 -.046 -.002 -.025 1.412 48.798 (.006) (.001) (.045) (.690) (8.383) .001 .001 .579 .041 .001 Indirect effects
CP—PPT—PF-10 (a1b1)
CP—WS—PF-10 (a2b2)
3.054 5.780 (.166) (1.436) .065 .001 .205 .386 (.105) (.083) .049 .001 -.065 -.098 (.033) (.030) .001 .001
Table 2.8. Contrast between the indirect effects of cognitive processing (CP) on PF-10 via the Physical Performance Test (PPT) and via walking speed (WS)
Independent Variable Contrast between PPT and WS (SE) 95% CI
Z-COG -2.726 (2.509) -7.644 - 2.192
SDMT -.181 (.161) -.497 - .135
TMTB .033 (.051) -.068 - .133
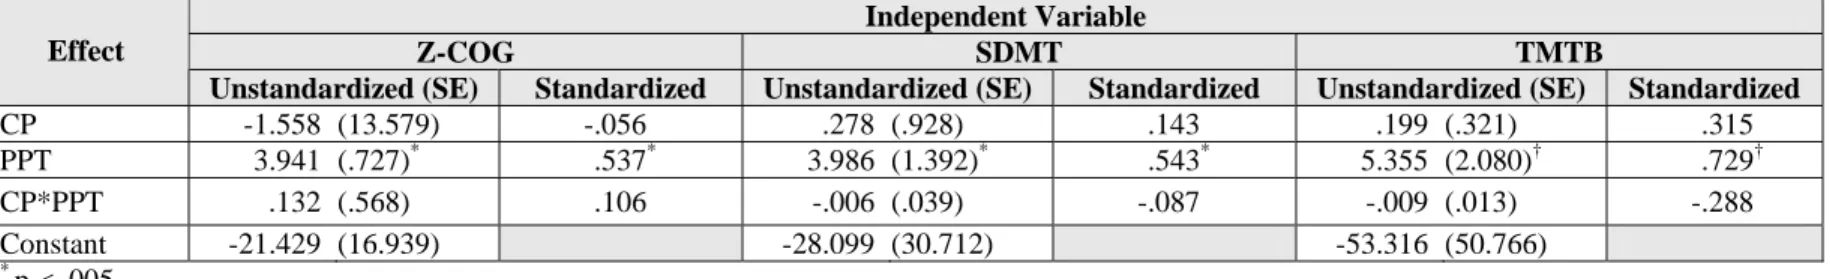
Table 2.9. Unstandardized and standardized coefficients for effect modification of cognitive processing (CP) on the relationship between PPT and PF-10 scores
Independent Variable
Z-COG SDMT TMTB
Effect
Unstandardized (SE) Standardized Unstandardized (SE) Standardized Unstandardized (SE) Standardized
CP -1.558 (13.579) -.056 .278 (.928) .143 .199 (.321) .315
PPT 3.941 (.727)* .537* 3.986 (1.392)* .543* 5.355 (2.080)† .729†
CP*PPT .132 (.568) .106 -.006 (.039) -.087 -.009 (.013) -.288
Constant -21.429 (16.939) -28.099 (30.712) -53.316 (50.766)
*
p < .005
†
p < .020
Table 2.10. Unstandardized and standardized coefficients for effect modification of cognitive processing (CP) on the relationship between walking speed (WS) and PF-10 scores
Independent Variable
Z-COG SDMT TMTB
Effect
Unstandardized (SE) Standardized Unstandardized (SE) Standardized Unstandardized (SE) Standardized
CP 4.432 (7.876) .158 .349 (.527) .178 -.056 (.186) -.089
WS 57.683 (6.917)* .585* 62.798 (18.918)* .636* 60.613 (21.696)† .614†
CP*WS -.815 (6.685) -.034 -.114 (.456) -.094 -.009 (.156) -.017
Constant 2.201 (8.080) -12.572 (20.531) 7.020 (26.740)
*
p < .005
†
p < .010
39
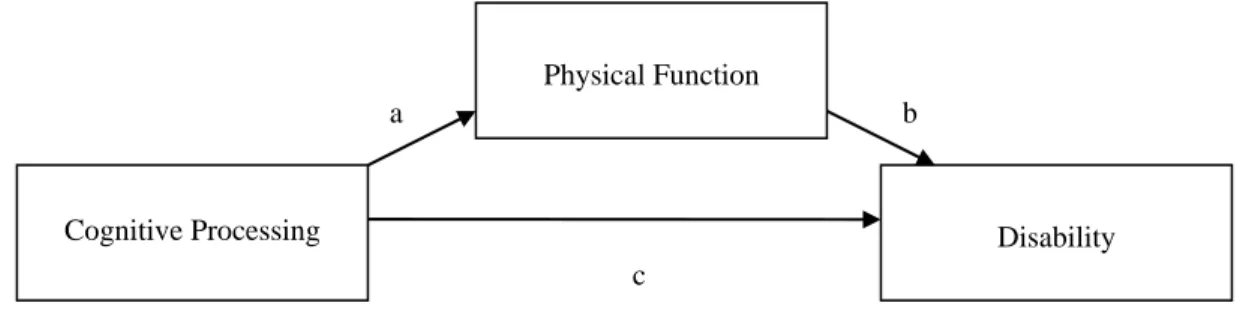
Figure 2.1: Conceptual Models
a. Direct and indirect effects of cognitive processing on physical function and disability via a single physical function measure
b. Direct and indirect effects of cognitive processing on physical function and disability via two physical function measures
Cognitive Processing
Physical Function
Disability
a b
c
Cognitive Processing
Physical Function (PPT)
Disability
a1 b1
Physical Function (Walking Speed)
a2 b2
40
c. Effect modification of cognitive processing on the relationship between physical function and disability
Physical Function
Cognitive Processing
CHAPTER III
SECOND MANUSCRIPT
42 Abstract
Background. Cross-sectional research supports an important relationship between cognitive processing and independent function. However, much remains unknown about the
relationship of cognitive processing to future declines in independent function among older adults.
Purpose. To examine in older adults: (1) the predictive relationship of cognitive processing to changes in physical function and disability one year later, and (2) the association of change in cognitive processing to change in physical function and disability over one year.
Methods. Volunteers (N=62) from a continuing care retirement community and church congregation (mean age 80.7 ± 5.0 years at baseline, 68% female) participated in a wellness assessment that included measures of cognitive processing, physical function, and disability. Cognitive processing, defined as performance on measures of attention and processing speed, were assessed with the Symbol Digit Modalities Test (SDMT) and the Trail Making Test Part B (TMTB). Raw SDMT and TMTB scores were transformed into z-scores to create a
composite score of cognitive processing (Z-COG), our primary measure of cognitive processing. Physical function was assessed with the 360° turn, the Physical Performance Test (PPT), and walking speed. The SF-36 Physical Function Sub-scale (PF-10) and OARS Instrumental Activities of Daily Living Scale (OARS) measured mobility and IADL
43
physical function and disability; and between change in cognitive processing and change in physical function and disability.
Results. Poorer Z-COG scores at baseline were associated with a one year decline in 360° turn (R2=.12, p < .01) and that one-year decline in TMTB was also associated with decline in 360° turn (R2=.072, p< .05). No linear relationship was observed for baseline cognitive processing to change in PPT, walking speed, or PF-10. Logistic regression analyses demonstrated that poorer Z-COG scores at baseline were predictive of decline in PF-10 (OR=2.846, 95% confidence interval [CI] 1.291-6.271) and OARS scores (OR=2.593, 95%CI 1.187-5.665). Poorer TMTB scores also demonstrated significant associations for decline in PF-10 (OR= 1.028, 95% CI 1.009-1.047) and OARS (OR=1.026, 95% CI 1.008-1.045). Z-COG, SDMT, and TMTB demonstrated significant associations for decreased independent function (OR ranged from 1.026 to 3.052).
Conclusions. Cognitive processing is associated with one-year change in balance and disability. Poorer performance on measures of attention and processing speed are associated with declines in balance and increased risk for mobility and IADL disability.
44 INTRODUCTION
Independence in physical function, activities of daily living (ADL), and instrumental activities of daily living (IADL) allows older adults to remain living in the community rather than moving to an assisted living facility or nursing home. Physical function tasks such as walking and climbing stairs and ADL and IADL, such as bathing, preparing a meal, and shopping require adequate cognitive abilities to organize, initiate and properly sequence these complex tasks. Numerous studies support that declines in general cognitive function are associated with declines in physical function and ADL/IADL disability in older adults. adults.1-3
Cognitive measures such as the Mini Mental State Exam4 (MMSE) and Short Portable Mental Status Questionnaire5 (SPMSQ) are intended as screening tools for general cognitive function and dementia. Poor performance on the MMSE, is associated with physical function limitations in tasks such as walking and climbing stairs,6, 7 and with ADL and IADL disability in both cross-sectional and longitudinal research.8-10 Community dwelling older adults demonstrating cognitive dysfunction on general screening measures have twice the risk of developing disability in three years compared to older adults without cognitive dysfunction.2, 8 There is also evidence that older adults who score in the low-normal range on the MMSE (scores of 24-27) are at increased risk for future disability and institutionalization compared to individuals with high-normal scores.8, 9
45
disability is critical for designing appropriate intervention programs effective for preserving independence among older adults for as long as possible.
ADL and IADL, such as dressing and meal preparation, are complex tasks that require organization and sequencing of multiple steps. Two cognitive processes important to information processing and successful completion of these complex tasks are attention and processing speed. Both processes contribute to cognitive organization, initiation, and sequencing of actions necessary for efficient information processing and performance of daily tasks; such as, finding objects on a crowded shelf, meal preparation, and walking. Attention, especially visual aspects of attention, such as visual scanning and selective attention, is particularly important for performing daily tasks that utilize external cues. For example, maintaining balance during walking requires an individual to select important information about the environment, such as the location of obstacles and movement of other persons, in order to adjust step placement and walking speed. Processing speed, or the time it takes to process information about external and internal cues, plays a key role in the planning and execution of coordinated movements and is a critical component of balance responses, with faster processing speed required for quick , compensatory adjustments needed to maintain balance in unstable situations.
46
processing speed may impair an older individual’s ability to organize and sequence daily tasks and make decisions on how to adapt to changing environments or situations. Impaired attention may also interfere with performance of daily tasks by reducing one’s ability to scan the environment and utilize external cues. The relationship between processing speed and balance, a physical function skill, is particularly important because sufficient balance is required for successful performance of independent mobility and dynamic daily activities, such as walking and reaching.
Cross-sectional research demonstrates stronger associations of attention and
processing speed to physical function18 and ADL and IADL performance19 than other aspects of cognition, such as memory. Numerous studies demonstrate that poor performance on attention and processing speed measures is associated with poorer performance of physical function skills (such as balance and walking), ADL, IADL, and increased falls.18-23 Rosano and colleagues22 reported stronger associations between physical function and attention and processing speed (Digit Symbol Substitution Test24) than between physical function and general cognition (Teng-modified Mini-Mental Status Exam25). To the best of our knowledge, the relationship between the cognitive processes of attention and processing speed and future declines in physical function or increased disability in community dwelling older adults has not been reported.
47
disability, and that changes in cognitive processing are also associated with changes in physical function and disability.
METHOD
Study Design and Sample
This was a longitudinal study using data from the baseline and one year follow-up assessments of the Be Alive project, a larger, ongoing longitudinal study promoting wellness and independence in older adults living in North Carolina. Participants in the Be Alive
project were older adults living in the community or in a continuing care retirement
community (CCRC) who volunteered for on-site wellness assessments (N=195 at baseline), which consisted of a comprehensive battery of measures assessing cognitive and physical abilities. Individuals 50 years of age or older and able to walk independently with or without an assistive device were included in the Be Alive project. Individuals with medical