C
2015. The American Astronomical Society. All rights reserved.
THE MASS PROFILE AND SHAPE OF BARS IN THE SPITZER SURVEY OF STELLAR
STRUCTURE IN GALAXIES (S
4G): SEARCH FOR AN AGE INDICATOR FOR BARS
Taehyun Kim1,2,3, Kartik Sheth2, Dimitri A. Gadotti3, Myung Gyoon Lee1, Dennis Zaritsky4, Bruce G. Elmegreen5, E. Athanassoula6, Albert Bosma6, Benne Holwerda7, Luis C. Ho8,9, S´ebastien Comer ´on10,11, Johan H. Knapen12,13,
Joannah L. Hinz14, Juan-Carlos Mu ˜noz-Mateos2,3, Santiago Erroz-Ferrer12,13, Ronald J. Buta15, Minjin Kim16, Eija Laurikainen10,11, Heikki Salo10, Barry F. Madore17, Jarkko Laine10, Kar´ın Men´endez-Delmestre18,
Michael W. Regan19, Bonita de Swardt20, Armando Gil de Paz21, Mark Seibert17, and Trisha Mizusawa2,22 1Astronomy Program, Department of Physics and Astronomy, Seoul National University, Seoul 151-742, Korea
2National Radio Astronomy Observatory/NAASC, 520 Edgemont Road, Charlottesville, VA 22903, USA 3European Southern Observatory, Casilla 19001, Santiago 19, Chile
4University of Arizona, 933 N. Cherry Avenue, Tucson, AZ 85721, USA 5IBM Research Division, T. J. Watson Research Center, Yorktown Heights, NY 10598, USA
6Aix Marseille Universit´e, CNRS, LAM (Laboratoire d’Astrophysique de Marseille) UMR 7326, 13388 Marseille, France 7European Space Agency, ESTEC, Keplerlaan 1, 2200-AG, Noordwijk, Netherlands
8Kavli Institute for Astronomy and Astrophysics, Peking University, Beijing 100871, China 9Department of Astronomy, School of Physics, Peking University, Beijing 100871, China 10Division of Astronomy, Department of Physical Sciences, University of Oulu, Oulu, FIN-90014, Finland 11Finnish Centre of Astronomy with ESO (FINCA), University of Turku, V¨ais¨a¨antie 20, FI-21500, Piikki¨o, Finland
12Instituto de Astrof´ısica de Canarias, E-38200 La Laguna, Tenerife, Spain
13Departamento de Astrof´ısica, Universidad de La Laguna, E-38205 La Laguna, Tenerife, Spain 14MMTO, University of Arizona, 933 N. Cherry Avenue, Tucson, AZ 85721, USA
15Department of Physics and Astronomy, University of Alabama, Box 870324, Tuscaloosa, AL 35487, USA 16Korea Astronomy and Space Science Institute, Daejeon 305-348, Korea
17The Observatories of the Carnegie Institution of Washington, 813 Santa Barbara Street, Pasadena, CA 91101, USA 18Universidade Federal do Rio de Janeiro, Observat´orio do Valongo, Ladeira Pedro Antˆonio, 43, CEP 20080-090, Rio de Janeiro, Brazil
19Space Telescope Science Institute, 3700 San Martin Drive, Baltimore, MD 21218, USA 20South African Astronomical Observatory, Observatory, 7935 Cape Town, South Africa 21Departamento de Astrof´ısica, Universidad Complutense de Madrid, Madrid 28040, Spain
22Florida Institute of Technology, Melbourne, FL 32901, USA
Received 2014 September 1; accepted 2014 November 13; published 2015 January 20
ABSTRACT
We have measured the radial light profiles and global shapes of bars using two-dimensional 3.6μm image
decompositions for 144 face-on barred galaxies from the Spitzer Survey of Stellar Structure in Galaxies. The
bar surface brightness profile is correlated with the stellar mass and bulge-to-total (B/T) ratio of their host
galaxies. Bars in massive and bulge-dominated galaxies (B/T>0.2) show a flat profile, while bars in less massive, disk-dominated galaxies (B/T∼0) show an exponential, disk-like profile with a wider spread in the radial profile
than in the bulge-dominated galaxies. The global two-dimensional shapes of bars, however, are rectangular/boxy,
independent of the bulge or disk properties. We speculate that because bars are formed out of disks, bars initially have an exponential (disk-like) profile that evolves over time, trapping more disk stars to boxy bar orbits. This leads bars to become stronger and have flatter profiles. The narrow spread of bar radial profiles in more massive disks suggests that these bars formed earlier (z >1), while the disk-like profiles and a larger spread in the radial profile in less massive systems imply a later and more gradual evolution, consistent with the cosmological evolution of bars inferred from observational studies. Therefore, we expect that the flatness of the bar profile can be used as a dynamical age indicator of the bar to measure the time elapsed since the bar formation. We argue that cosmic gas accretion is required to explain our results on bar profile and the presence of gas within the bar region.
Key words: galaxies: evolution – galaxies: formation – galaxies: spiral – galaxies: structure
1. INTRODUCTION
The presence and properties of galactic structures such as bars, bulges, rings, and spiral arms are not predetermined at the time of the galaxy formation. Both fast and slow (“secu-lar”) processes can create galactic structures and change their properties by a rearrangement of the mass, angular momentum,
and energy with time (Athanassoula2013; Sellwood2014; also
see reviews in Falc´on-Barroso & Knapen2013). As the merger rate in the universe declines, the evolution of galaxies at their late stages has increasingly been governed by secular evolution (Kormendy & Kennicutt2004), stimulated by nonaxisymmetric structures such as bars, ovals, spiral structures, and triaxial dark matter halos. Among these, bars are one of the most important drivers of internal secular evolution in their host galaxies.
The nonaxisymmetric potential of a bar induces large-scale streaming motions in stars and gas into the central part of
the galaxy (e.g., Athanassoula 1992a, 1992b; Sellwood &
Wilkinson 1993). Being dissipative, the gas loses angular
momentum and energy and flows inward toward the galactic center (Knapen et al.1995; Regan et al.1999; Sheth et al.2000,
2002), accumulating in the central ∼1 kpc of galaxies (e.g.,
and nuclear star clusters (B¨oker et al.2002,2004,2011). Such star formation activities may help to create disky pseudobulges (Kormendy & Kennicutt2004; Sheth et al.2005; Athanassoula 2005; Debattista et al.2006). Bars are the primary mechanism for transporting gas from a few kiloparsec scale to the central kiloparsec. However, there have been mixed answers to the question of whether the presence of a bar and active galactic nucleus (AGN) activity are connected. Some studies find weak statistical links among AGN activity and the presence of bars (e.g., Arsenault1989; Knapen et al. 2000; Laine et al.2002; Laurikainen et al. 2004a; Coelho & Gadotti 2011), whereas others find little or no link (e.g., Moles et al.1995; McLeod & Rieke1995; Mulchaey & Regan1997; Ho et al.1997; Hunt & Malkan1999; Martini et al.2003; Lee et al.2012; Cisternas et al.2013). While bar torques drive gas inside the bar corotation inward, they push the gas between the corotation and outer
Lindblad resonance (OLR) outward (Combes 2008; Kubryk
et al.2013).
Bars have been reported to change the chemical abundance gradient in the disk, presumably as a result of large-scale streaming motions induced by the bar (e.g., Zaritsky et al.1994; Martin & Roy1994; Dutil & Roy1999; but also see P´erez & S´anchez-Bl´azquez2011; S´anchez et al.2012,2014). Bars may change the chemical abundance gradient inside the corotation radius, but they seem to have only a small impact outside the bar itself. Bars may redistribute stars in the galaxy disk, leading to disk breaks in the disk profile (e.g., Debattista et al.
2006; Radburn-Smith et al.2012; Mu˜noz-Mateos et al.2013;
Kim et al.2014, hereafter Paper I). Bars drive the formation
of inner rings and outer rings (Buta & Combes 1996; Buta
et al.2003; Romero-G´omez et al. 2006; Athanassoula et al.
2009a, 2009b) and possibly spiral density waves (Buta et al. 2009; Salo et al.2010). Simulations show that bars may evolve over time by transferring angular momentum from the baryons to the outer disk and/or halo (Sellwood 1980; Debattista & Sellwood1998; Athanassoula2002,2003; Valenzuela & Klypin 2003; Martinez-Valpuesta et al.2006; Begelman & Shlosman 2009; Saha et al.2012). As bars lose angular momentum, their corotation radius moves outward, and they become longer and thinner (Athanassoula2003,2013). Bars thus play an important role in secular evolution of galaxies by redistributing the energy, angular momentum, and mass across the disk.
Bar properties change along the Hubble sequence. Early Hubble-type disks (earlier than SBb) have longer bars, both in an absolute sense and relative to their disks, com-pared to late Hubble-type disk galaxies (later than SBb;
Elmegreen & Elmegreen 1985; Martin 1995; Laurikainen
& Salo 2002; Laurikainen et al. 2004a, 2007; Erwin 2005;
Men´endez-Delmestre et al. 2007; Marinova & Jogee 2007).
Bars in early-type spirals tend to show uniform intensity along the major axis of the bar, i.e., a flat radial light profile compared to the interbar region, whereas bars in late-type spirals tend to have exponential radial profiles (Elmegreen & Elmegreen
1985; Baumgart & Peterson 1986; Elmegreen et al. 1996;
Regan & Elmegreen1997). Flat bars are associated with two-arm grand design spirals. However, exponential bars have multi-ple spirals or flocculent spirals (Elmegreen & Elmegreen1985), and these spirals are often not physically connected directly to the bar structure. As bars evolve, stellar orbits of bars also
evolve (Athanassoula2013). Thus, they may be different
be-tween early- and late-type disk galaxies. Such orbits define the outermost two-dimensional (2D) shape of bars. Therefore, if we investigate both bar profile and shape over Hubble type, and as
a function of structural properties of galaxies, we should be able to better understand how bars evolve.
Previous studies have analyzed at most a few dozen bars with relatively simple (one-dimensional) analysis of their light profile. Although some galaxies have been analyzed using 2D decompositions including bar components (e.g., Laurikainen et al.2004b,2011; Gadotti2009; Vika et al.2012), properties of bars have not yet been studied in detail. With the Spitzer Survey of Stellar Structure in Galaxies (S4G; Sheth et al.2010),
we now have the opportunity to measure the bar light profile, the bar shape, and bulge and disk properties using the survey of 3.6μm images, which are less affected by dust, in a sizable sample of galaxies shedding light on the evolution of bars and
disks. The large, uniform, and homogenous 3.6μm data give us
a virtually dust-free view of stellar structures, which is important because dust can affect the measurement of galactic structures (e.g., Holwerda et al.2005; Gadotti et al.2010; Fathi et al.2010; Kelvin et al.2012; Pastrav et al.2013).
As bars and bulges are embedded in disks, structural proper-ties of bars are best studied through 2D decompositions (e.g., de Jong1996; Laurikainen et al.2005,2007,2010; Gadotti2008, 2009; Durbala et al.2008,Paper I). A shortcoming for most of the previous studies has been the use of a fixed profile for the bar and of a single exponential for the disk. Although several studies have tried to fit bars with a S´ersic or Ferrers function (e.g., Laurikainen et al.2005,2010; Weinzirl et al.2009; Vika et al.2012; Lansbury et al. 2014), light profiles of bars have not been examined. Moreover, a majority of disk galaxies have a disk break (Pohlen et al.2002; Erwin et al.2005; Pohlen & Trujillo2006; Erwin et al.2008; Guti´errez et al.2011; Maltby et al.2012a; Comer´on et al.2012; Mart´ın-Navarro et al.2012; Mu˜noz-Mateos et al.2013; Laine et al.2014); therefore, it is critical to fit both the inner and outer disks (Paper I). The disk break affects the measurement of the structural properties of the bar, bulge, and disk. For example, in down-bending (Type II) disks, we find that B/T and bar-to-total (Bar/T) can change up to 10% and 25%, respectively (Paper I). The disk scale length and central surface brightness of the disk also change once the disk break is properly modeled. However, none of the previous studies consider disk breaks in measuring structural properties of galaxies. In this work we allow the bar profile to vary and fit the disk break in 144 galaxies from S4G. The radial profile and global shape of bars are analyzed with respect to the bulge and disk properties, with an aim of understanding the evolution of disks.
The paper is organized as follows. In Section 2 we give a
brief overview of our sample selection and describe our 2D image decomposition procedure. We explore the radial surface brightness profile of the bar in Section3. Global shapes of bars are examined in Section4. We discuss our results in Section5,
and we summarize and conclude in Section6.
2. DATA AND DATA ANALYSIS
We refer the reader to Paper I for details on the sample
selection and the 2D decomposition methodology, and we briefly summarize the data set and analysis here.
2.1. Data
We use data from S4G (Sheth et al. 2010), a survey of
because they are less hampered by dust with only a small local contamination from asymptotic giant branch stars or hot dust
around red supergiants (Meidt et al. 2012a, 2012b). Thus, in
this study we made use of 3.6μm images that form an ideal
data set for exploring properties of stellar bars.
Our sample of 144 barred galaxies are all the barred galaxies
from the data that had been processed by the S4G pipelines
(Pipelines 1, 2, and 3; Sheth et al. 2010) at the beginning
of this study in 2011 November. Properties of galaxies are
presented in Paper I. The bar classification was first done
visually by K. Sheth, T. Kim, and B. de Swardt, and then later the presence of a bar was confirmed by comparing with the MIR classification (Buta et al.2010,2014). According to this MIR classification, there are∼800 strongly barred (SB) galaxies
and ∼370 weakly barred (SAB) galaxies in the full sample
of the S4G.
2.2. Data Analysis
We performed 2D decompositions on 3.6μm images from
S4G using the BUlge Disk Decomposition Analysis code
(BUDDA v2.2, Gadotti2008; de Souza et al.2004) and fit each galaxy with a disk, a bar, a bulge, and, if present, a central point source. As noted earlier, the majority of disks have a change of slope in their radial light distribution with either down-bending (Type II) or up-bending (Type III) profiles (Pohlen & Trujillo 2006; Hunter & Elmegreen2006; Erwin et al.2008; Guti´errez et al.2011; Maltby et al.2012b; Mu˜noz-Mateos et al.2013; Laine et al.2014). Owing to the disk breaks, disks have inner and outer disk scale lengths that differ in the median by 40% (Paper I) and lead to differences of∼10% in B/T and∼25% in Bar/T in the decompositions.
We follow the procedures detailed inPaper Ibut summarize
the fitting procedures of bars here. The bar surface brightness profile is also modeled with the S´ersic profile (S´ersic1963),
μbar(r)= ⎧ ⎨ ⎩
μe,bar+cn,bar
r re,bar
1/nbar
−1
, ifrrbar
0, ifr > rbar
(1) wherecn,bar =2.5(0.868nbar−0.142) andrbar is the radius of
the bar along the major axis. Beyond this radius the light profile of the bar is truncated to zero level in the model images.
The global shape of each component can be modeled with generalized ellipses (Athanassoula et al.1990),
|x| a
c + |y|
b c
=1, (2)
wherexandyare positions of points,aandbare semimajor and semiminor axis, respectively, andcis the shape parameter that describes the shape of the ellipse. Ifc=2, then the shape of the component is a perfect ellipse. Ifc <2, then the shape of the component is disky, while ifc >2, the shape of the component is boxy. In this study, we only characterize the shape of a bar component, and we fix the shape parameter (c=2) for the disk and bulge.
In case a nuclear point source is present (23/144, 16% of the sample), we model it with a point-spread function profile with its appropriate FWHM, while we fit only for the peak intensity. Possible candidates of nuclear sources are nonstellar emission from AGNs, nuclear star clusters, and unresolved small bulges. The lowest B/T that we obtain is 0.004. This is the lower limit at which we can identify a bulge visually from our analysis. In
0 1 2 3 4 5
Radius 22
20 18 16 14 12
μ
[mag arcsec
-2 ]
n=0.2 n=0.35 n=0.5
Gaussian n=0.75
n=1.0
Exponential n=1.5
n=2.0
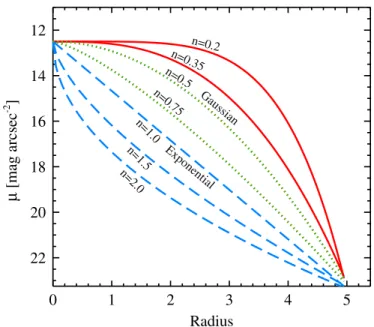
Figure 1.Schematic plot of S´ersic profiles that describe various radial surface brightness profiles of bars. Radial profiles ofn=0.2–2 are presented. Gaussian (n=0.5) and exponential (n=1.0) profiles are also shown. Flat profiles are in red, intermediate profiles are in green, and exponential steep profiles are in blue. Radius is in an arbitrary unit.
our sample, there are a number of bulgeless galaxies. Before
we runbudda, we visually inspect the images and radial light
profiles of the galaxies, and if a galaxy does not have a bulge, then we only fit these galaxies with a disk and a bar; thus, such galaxies have B/T=0. In this study, by “bulgeless” we refer to the galaxies without a classical or a disky pseudobulge. But still, bulgeless galaxies can have a boxy/peanut feature, which is sometimes called a boxy/peanut bulge (For details, readers are referred to Athanassoula2005; Athanassoula & Beaton2006).
3. SURFACE BRIGHTNESS PROFILE OF BARS
3.1. Bar Profiles Fitted with the S´ersic Function
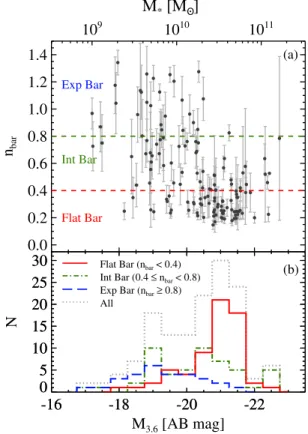
We use S´ersic indices to measure the steepness of the light profile of a bar. Surface brightness profiles with different S´ersic indices fromn=0.2 to 2.0 are shown in Figure1. In Figure2(a) we plot bar S´ersic indices (nbar) as a function of the absolute
magnitude of the galaxy. The 3.6μm magnitudes are converted
to a stellar mass following the method outlined in Appendix
A of Mu˜noz-Mateos et al. (2013), which is based on the
mass-to-light ratio measurement from Eskew et al. (2012).
Figure2(b) shows the distributions of galaxies that have a flat bar, an intermediate bar, and an exponential bar. We find that massive galaxies predominantly have flat bars (nbar < 0.4),
while less massive galaxies primarily have exponential “disk-like” bars (nbar0.8), although some low-mass galaxies show
flat bars. The transition from having predominantly flat bars
to more exponential bars occurs aroundM3.6 ∼ −20 AB mag
(∼M∗/M∼1010.2).
Next we plot the distribution ofnbarin Figures3(a) and (b), now dividing the galaxies based on the bulge dominance: in red we show the bulge-dominated galaxies with a B/T23>0.2,23in
orange we show the intermediate cases with 0.0<B/T0.2,
and in blue we show the disk-dominated systems with B/T=0.
The arrows at the top of the panel indicate the mediannbarfor
0.0 0.2 0.4 0.6 0.8 1.0 1.2 1.4
nbar
1011 1010
109
M
*[M ]
Exp Bar
Flat Bar Int Bar
-16 -18 -20 -22
M3.6 [AB mag] 0
5 10 15 20 25 30
N
All
Exp Bar (nbar≥ 0.8) Int Bar (0.4 ≤ nbar < 0.8) Flat Bar (nbar < 0.4)
-16 -18 -20 -22
0 5 10 15 20 25 30
(a)
(b)
Figure 2.(a) Bar S´ersic indices as a function of absolute magnitude of galaxies. Stellar masses, converted from absolute magnitude of galaxies, are shown on top. Error bars are statistical 1σuncertainty errors for S´ersic indices. (b) Distributions of absolute magnitudes of galaxies having flat bars (nbar<0.4) in red solid line,
intermediate bars (0.4nbar<0.8) in green dot–dashed line, and exponential
bars (nbar0.8) in blue dashed line.
each group. The main point to note is that the distributions of nbarof the three groups are different. Bulge-dominated galaxies have a smallernbar with a median bar S´ersic index, nbar ∼
0.30, whereas disk-dominated systems span a wide range of bar
S´ersic index from 0.25 to 1.4, with a median nbar ∼ 0.85.
The majority of exponential bars are in bulgeless galaxies, and all galaxies withnbar >0.7 are bulgeless galaxies. Thus, bar
profiles can be better separated by bulge dominance and bulge types than by galaxy mass.
Next, we investigate the bar S´ersic index versus the bulge S´ersic index. We divide the bulge light profiles into three groups:
no bulge (nbulge =0), disky pseudobulge24 (0< n
bulge 2.0),
and a classical bulge (nbulge>2.0) following the separation of
Fisher & Drory (2008).
The bar S´ersic index distribution for these groups is shown
in Figure 3(b). We find that classical bulge galaxies have a
smallernbarand show a flatter bar profile compared to bulgeless
galaxies. In Figure3(c) we plot the different bar profiles, but now we overplot the median bar profiles for galaxies with a classical bulge with the red solid line, galaxies with a disky pseudobulge with the green dashed line, and bulgeless galaxies with the blue short-dashed line. There does seem to be a progression
of nbar, but the samples are still not large enough to get a
statistically significant difference in the distribution of the bar profiles between the classical and disky pseudobulge groups. Nevertheless, the basic conclusion from these figures is that the bulge-dominated galaxies and especially those with a classical bulge have the flattest bars, and this is consistent with the early findings of Elmegreen & Elmegreen (1985).
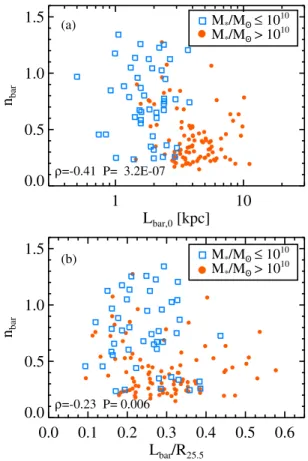
We check hownbarvary with bar length (Lbar) and normalized
bar length (Lbar/R25.5) in Figure 4.25 We find that longer
bars tend to show flatter profiles (Figure 4(a)). This is in
line with the previous studies (e.g., Elmegreen & Elmegreen 1985; Baumgart & Peterson1986), considering that early-type galaxies have longer bars (e.g., Erwin2005; Laurikainen et al. 2007; Men´endez-Delmestre et al.2007). However, when lengths of bars are normalized to R25.5, the correlation is not clear
(Figure4(b)).
For highly inclined galaxies, projection effects could be such that bulge light is mixed with the bar, complicating the decomposition. Nevertheless, this effect is unlikely to influence much in our sample, because we select our samples to have mild inclination (i < 60). The mean of the bulge effective radii to bar ratio (reff,bulge/rbar) is 7.5 for galaxies with a bulge. Thus,
bars span a large enough area compared to bulges, enabling us to well estimate bar S´ersic indices.
3.2. Fitting Bar Model Images with the Modified Ferrers Profile
We model the bar profile with the S´ersic profile that is
provided bybuddato fit bars. However, bars also have been
modeled with the Ferrers function (e.g., Laurikainen et al.2007,
24 In this paper, by “disky pseudobulge”, we specifically refer to a disk-like or
disky bulge and do not include boxy/peanut features that are thick parts of the bar. See Athanassoula (2005), Athanassoula & Beaton (2006) for details.
25 Radius atμ
3.6μm=25.5 AB mag arcsec−2from the S4G Pipeline 3.
0.0 0.5 1.0 1.5 0
5 10 15 20 25
N N
) c ( )
b ( )
a (
0.0 0.5 1.0 1.5 Bar Sersic Index (nbar)
B/T > 0.2 0.0 < B/T ≤ 0.2 B/T = 0.0
0.0 0.5 1.0 1.5 Bar Sersic Index (nbar) 0
5 10 15 20 25
Classical Bulge Pseudo Bulge Bulgeless
0 1 2 3 4 5 Radius
22 20 18 16 14 12
μ
[mag arcsec
-2 ]
n=0.2 n=0.35 n=0.5 n=0.75
n=1.0 n=1.5 n=2.0
Bars in
classical bulge:
bulgeless:
0.27±0.13
0.85±0.38
pseudo bulge: 0.40±0.16
0.0 0.1 0.2 0.3 0.4 0.5 0.6 Lbar/R25.5
0.0 0.5 1.0 1.5
nbar
ρ=-0.23 P= 0.006
M*/M ≤ 10 10
M*/M > 10 10
1 10
Lbar,0 [kpc] 0.0
0.5 1.0 1.5
nbar
ρ=-0.41 P= 3.2E-07
M*/M ≤ 10 10
M*/M > 10 10 (a)
(b)
Figure 4.(a) Bar S´ersic indices (nbar) with bar lengths (Lbar); (b)nbar with
normalized bar lengths (Lbar/R25.5). Massive galaxies are plotted by circles,
while less massive galaxies are plotted by squares. Spearman’s rank correlation coefficient (ρ) and significance are presented in the lower left corner of each panel.
2010; Peng et al.2010). The Ferrers function has the following functional form:
μbar(r)=μ0(1−(r/rout)2)mbar+0.5, (3)
wherembaris a parameter that defines the shape of bar profiles.
The function is only defined out torout, which is the bar radius.
Beyondrout,μbar is set to 0. Kim et al. (2012) compared their
hydrodynamical simulations of galaxies that have a bulge with the observational study of Comer´on et al. (2010)26 and show that observed bars are best represented bymbar0.5.
It would be instructive to compare the two functions (S´ersic and Ferrers profile) for the fits. However, it is not straightforward to convert S´ersic indices to thembar. Therefore, to comparenbar
andmbar, we ran GALFIT (version 3.0.5; Peng et al.2002,2010)
on the bar model images that were obtained withbuddain order
to estimate parameters of the Ferrers profile.GALFITpresents
the modified Ferrers profile that has the following functional form:
μbar(r)=μ0(1−(r/rout)2−β)α, (4)
whereμ0 is the central surface brightness, α describes how
sharply the bar profile drops nearrout, andβdescribes the inner
central slope of the profile. Because of its ability to describe a flat core and sharp truncation, the modified Ferrers profile is often used to model bars or lenses (Peng et al.2010). We refer the readers to Figure 4 of Peng et al. (2010) for details about the profiles.
26 A total of 90% of their sample galaxies have Hubble T4 (SBbc).
Parameters of the Ferrers function and modified Ferrers function are different in a way thatα =mbar−0.5, andβ is fixed to 0 in the Ferrers function. But as we will see in Figure5, many of our bar models, especially those that have no bulge, do
not haveβ =0.
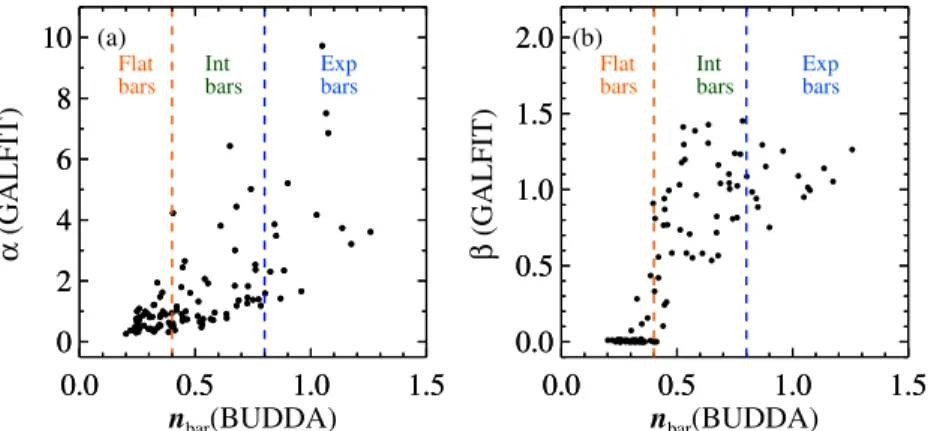
We compareα andnbar andβ andnbar in Figure5. For 35
of the 144 galaxies GALFIT did not converge to a meaningful
solution, and for those we were not able to obtain α and β
values. As we expected,nbarandβare strongly related, andnbar
andα also show a correlation. Flat bars (nbar < 0.4) mostly
haveβ <0.5 andα1.0, whereas the exponential bars have
β >0.5. Therefore, both S´ersic and modified Ferrers profiles can describe the degree of flatness, and our results from the previous section are insensitive to the choice of fitting functions.
4. THE GLOBAL SHAPE OF BARS
Previous observational studies, which were primarily in the optical, found rectangular-shaped bars in strongly barred
early-type galaxies (Athanassoula et al. 1990) and galaxies with
classical and disky pseudobulges (Gadotti2011). We now revisit this topic using our MIR data and the detailed decompositions withBUDDA.
Simulations predict that bars are rectangular in shape (Athanassoula et al. 1990; Athanassoula & Misiriotis 2002;
Scannapieco & Athanassoula 2012). The manifold
theoreti-cal model (Romero-G´omez et al. 2006, 2007; Athanassoula
2012; Athanassoula et al.2010), which has been proposed to
explain the formation and structure of rings and spiral arms in barred galaxy potentials, argues that orbits of confined chaos play a crucial role in explaining the rectangular shape of bars (Athanassoula et al.2010). In particular, the manifold branches produce the building blocks of the rectangular outline of the outer parts of a strong bar.
As discussed in Section2.2, the generalized ellipse equation (Equation (2)) has an exponent “c”, the shape parameter, which can distinguish between diamond-shaped and disky, rectangular and boxy, and an elliptical shape. To help the reader visualize the different shapes, we show three different shapes of the bar models in Figure6. In this study, we model the outermost, global shape of the bar.
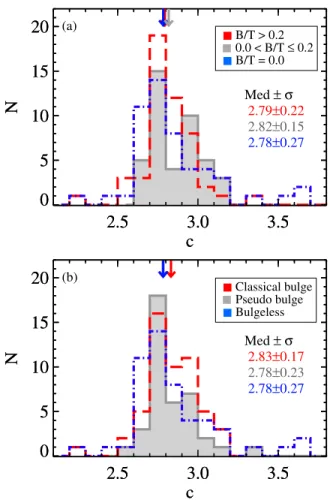
In Figure 7 we show the distribution of the global bar
shape parameter (c) of all the bars we fit for this study. All
bars are boxy and have a shape parameter c greater than 2.
There areno disky barsin our sample. We find no significant
differences in the global shape of bars with different bulge
types—the median bar shape for all B/T and all three bulge
types agrees within one standard deviation of the distributions. The Kolmogorov–Smirnov test confirms that we cannot rule out a null hypothesis that the bar shapes of groups shown in
Figure7 are drawn from the same parent population with the
smallest probability,P∼0.15.
Athanassoula et al. (1990) measured shape parameters as
a function of bar radius for 12 galaxies. We compare our
global shape parameters from theBUDDA fit and those of
Athanassoula et al. (1990) for five galaxies in common and
0.0 0.5 1.0 1.5
nbar(BUDDA) 0
2 4 6 8 10
α
(GALFIT)
0.0 0.5 1.0 1.5
0 2 4 6 8 10
0.0 0.5 1.0 1.5
nbar(BUDDA) 0.0
0.5 1.0 1.5 2.0
β
(GALFIT)
) b ( )
a (
0.0 0.5 1.0 1.5
0.0 0.5 1.0 1.5 2.0 Flat
bars Int bars
Exp bars
Flat bars
Int bars
Exp bars
Figure 5.Comparisons of bar radial profile parameters; bar S´ersic index (nbar) from the S´ersic profile fit, andαandβfrom the modified Ferrers function (Equation (4)).
Figure 6.Morphology of bars that are simulated withBUDDA. From left to right, we plot disky, elliptical, and boxy shapes of bars. The shape parameter “c” from Equation (2) is written in the bottom left corner for each panel. All bars have ellipticity (1−b/a) of 0.65.
Simulations agree with the data that bars are boxy (e.g., Athanassoula et al. 1990, 2010; Athanassoula & Misiriotis 2002; Scannapieco & Athanassoula2012). In addition to what
Athanassoula et al. (1990) found for strongly barred
early-type galaxies and Gadotti (2011) found for classical and disky pseudobulge galaxies, we find that bars are rectangular even in late-type disk galaxies.
One caveat is that we fit the bar with a single component. However, bars are known to experience a buckling instability in which the central regions of the bar puff up and extend vertically out from the disk plane. This has been observed as a peanut-shaped or X-peanut-shaped feature in some edge-on galaxies (Jarvis
1986; L¨utticke et al. 2000). Even in some moderately
face-on galaxies, central parts of bars appear boxy over a regiface-on where the buckling instability has occurred (Athanassoula & Beaton2006; Erwin & Debattista2013), and this is observed as a bar lens seen face-on (Athanassoula et al.2014; Laurikainen et al.2014). Detailed study on the shape of these two different structures of the bar will be performed in the near future.
5. DISCUSSION
5.1. Bar Profiles
Several ideas have been proposed for the different radial light profiles of bars. Combes & Elmegreen (1993) suggested that bars in early- and late-type spiral galaxies have resonances at different locations and that this leads to the different light profiles. They also suggested that the flat profiles along the bar in early-type disk galaxies are due to an inner Lindblad resonance that is absent in late-type galaxies. Quillen (1996) suggested that bars in early-type spirals have a flat surface brightness profile because the ellipticities of the main bar orbits change rapidly as they approach corotation near the bar end, while bars in
late-type galaxies show exponential profiles because the resonances are more spread out. Elmegreen et al. (1996) suggest that flat profiles of bars originated from the excessive stars at the bar ends where the orbits crowd near the inner 4:1 resonance. However, late-type bars do not show such resonance crowding (Elmegreen et al.1996).
Some models find that bars end near the 4:1 resonance
(Contopoulos et al.1989; Athanassoula 1992a; Quillen et al.
1994; Skokos et al.2002) and corotation radius is an upper limit
of the bar extent (Contopoulos 1980; Sellwood & Wilkinson
1993). However, Elmegreen et al. (1996) claim that bars end at no specific resonance, but end in the region covered by many resonances in the range from inner 4:1 to corotation resonance. If the 4:1 and corotation resonances are located close to each other, stellar orbits crowd together between these two resonances. Therefore, it may produce a bar with a nearly constant light distribution, i.e., a flat bar. Such a crowding of resonances mostly occurs in bright, massive galaxies, i.e., in early-type disk
galaxies, where theΩ−κ/2 has large maxima and therefore
bars can be formed with a large pattern speed (Combes &
Elmegreen 1993). However, in late-type disks, Ω−κ/2 has
low values as a whole, and the bar pattern speed is low, locating the corotation radius further out in the disk. So this crowding of resonances would develop early-type bars with flat surface brightness profiles.
N-body simulations of disk galaxies with different central
dark matter halo concentrations have shown that there are differences in the mass density profiles of bars (Athanassoula & Misiriotis2002). Bars in galaxies with centrally concentrated halos (MH model of Athanassoula & Misiriotis2002) show a flat mass density profile followed by a steeply decreasing density
profile toward the end of the bar—this is similar to the S4G
2.5
3.0
3.5
c
0
5
10
15
20
N
B/T > 0.2 0.0 < B/T ≤ 0.2 B/T = 0.0
Med ±σ 2.79±0.22 2.82±0.15
2.78±0.27
2.5
3.0
3.5
c
0
5
10
15
20
N
2.5
3.0
3.5
c
0
5
10
15
20
N
Classical bulge Pseudo bulge Bulgeless
Med ±σ 2.83±0.17 2.78±0.23
2.78±0.27
2.5
3.0
3.5
c
0
5
10
15
20
N
(a)
(b)
Figure 7.Distribution of the bar shape parameter (cfrom Equation (2)) in the generalized ellipse fit for different types of galaxies. Median shape parameters for each group are plotted with downward-pointing arrows. (a) Galaxies are divided by B/T: B/T>0.2 (dashed lines), 0.0<B/T0.2 (solid lines), and B/T=0.0 (dot–dashed lines). (b) Galaxies are divided by bulge types: classical bulge galaxies (dashed lines), pseudobulge galaxies (solid lines), and bulgeless galaxies (dot–dashed lines).
perhaps high-resolution simulation kinematic data will help us test whether the dark matter halos predicted by the simulations are borne out in these galaxies.
Some caveats should be considered. In this study, we assumed that a bar forms in a disk that shows an exponential profile. However, the underlying profile of disks may evolve with redshift. For example, half-mass radii change with redshift (e.g., Dutton et al.2011). Nevertheless, these changes are slow up to z=1–1.5, and a recent study (Kraljic et al.2012) claims that bars start to form around this epoch. Thus, we expect that the impact of intrinsic change of disk profiles would be limited at z <1–1.5.
Disk galaxies at z > 1–1.5 are found to be compact (van
Dokkum et al.2008; van der Wel et al.2011). Such galaxies
exhibit a similar S´ersic index distribution to that of the massive (M∗ > 1011 M) local disk galaxies, though the mean S´ersic index of high-z disk galaxies is a bit larger (Chevance et al. 2012). Most disk galaxies in this mass range today are found to host a bar; thus, those compact disk galaxies are expected to form a bar byz=0. If a bar forms in such a compact, exotic galaxy at an early epoch, it may take longer to change the bar light profile to a flat one. Depending on the initial condition of disk
profiles, this may induce a scatter among high-zprogenitors.
Thus, if profiles of disks vary among galaxies when bars form, our results on bar profiles might also be affected.
5.2. Bar Profile Bimodality?
In Section 3 we show that surface brightness profiles of
bars change with stellar mass. Among less massive galaxies (M∗/M1010), most of the galaxies show steeply decreasing
exponential profiles. On the other hand, flat bars are dominant in massive galaxies (M∗/M > 1010). The transition from
exponential to flat profile occurs at M3.6μm ∼ −20 mag
(M∗/M∼1010.2).
Interestingly, this is the characteristic mass where the bar fraction is at its minimum (Nair & Abraham2010) and close to the characteristic mass that corresponds to the rotation velocity (Vc ∼120 km s−1; see Comer´on et al.2014), where vertical structures of interstellar medium (ISM)traced by dust
morphology show a transition (Dalcanton et al.2004; Yoachim
& Dalcanton2006). Also, it is close to the characteristic mass where the mass-to-light ratios of thin and thick disks change
(Comer´on et al. 2011), and galaxy properties such as age of
stellar populations, surface mass density, and concentration show bimodality (Kauffmann et al.2003). Related to this, galaxy
color (Strateva et al. 2001; Baldry et al. 2004), luminosity
(Balogh et al.2004), and size (Shen et al.2003) are also found to show bimodal distributions.
This suggests that the mechanism that changes bar profiles from exponential to flat may also be associated with global properties of their host galaxies such as galaxy mass, color, size, and also distribution of dust lanes that are related to disk instability (Dalcanton et al.2004).
5.3. Are Bars Robust or Recurrent?
The result that high-B/T galaxies do not have an exponential bar implies that such galaxies did not dissolve a preexisting bar and did not build a new one. Some studies have argued that the central mass concentration can destroy bars (e.g., Hasan & Norman1990; Hasan et al.1993; Norman et al.1996). If bars
in such high-B/T galaxies are destroyed and formed again, at
least some bars should exhibit an exponential bar profile even
among high-B/T galaxies. However, we do not see any in our
study. Simulations find that with the central mass concentration, the strength of the bar decreases (e.g., Shen & Sellwood2004;
Athanassoula et al.2005). However, to be able to completely
destroy a bar, the mass concentration has to be either highly concentrated, whose scale length is less than a few parsecs, or massive enough, at least several percent of the disk mass (Shen & Sellwood 2004; Athanassoula et al.2005; Debattista et al.
2006). For the same central mass concentration, Athanassoula
et al. (2005) find that bars with an exponential surface density profile can be dissolved, while strong bars with a flat surface density profile witness only a decrease of their strength. This is consistent with our results that higher-B/T galaxies only shows flat bars, and this implies that at least bars in galaxies with a big central bulge (high B/T) arenotrecurrent.
5.4. The Invariant Bar Shape and the Bar Profile: An Indicator of Bar Age?
Sellwood 2013; Athanassoula 2003,2013). Because bars are formed out of disk material, we can assume that the light profile of the bar would be exponential-like when they just formed. However, as a galaxy ages and the bar evolves, the galaxy would have enough time to experience resonance crowding (Combes & Elmegreen1993) and trap stars into the bar orbit, and thus the bar becomes longer and stronger (Sellwood & Wilkinson1993; Athanassoula & Misiriotis2002; Athanassoula
2013; Sellwood 2013). This will lead bars to have a flat
profile. Therefore, it is reasonable that the light profile of the bar will change from an initial exponential profile to a flatter profile.
This fits in well with our understanding of the cosmological
evolution of disks and bars. The fraction of bars in L∗ and
brighter galaxies is found to evolve such that it increases from z=0.85 to the present day (Abraham et al.1999; Jogee et al. 2004; Sheth et al. 2008; Cameron et al. 2010; Kraljic et al. 2012; Melvin et al.2014). Moreover, these studies have shown that the bar fraction is the highest in the most massive, bulge-dominated, red galaxies at high redshifts with little evolution in this population over the past 7 Gyr of cosmic time. This is perfectly consistent with this study. We find that massive, bulge-dominated galaxies have flat bars as one would expect if these bars have been in existence for several gigayears and dynamically more evolved. Interestingly, this is also consistent with the result of Holwerda et al. (2012) that dust lanes in
edge-on galaxies have been in existence sincez ∼0.8 in massive
galaxies. This can be interpreted such that massive galaxies had enough time to dynamically evolve so that cold ISM can sink into the galactic plane to form the dust lane (Dalcanton et al.2004).
In low-mass, disk-dominated blue galaxies, studies show that the fraction of bars evolves gradually, increasing the present-day fraction over time (Abraham et al.1999; Sheth et al.2008; Cameron et al.2010; Melvin et al.2014). This means that some low-mass systems had their bars early but more and more of them acquired bars over the past 7 Gyr of evolutionary time. Therefore, today we might expect a larger spread in the bar profile with more exponential profiles in the late-type galaxies, as we see from the analysis presented here. Thus, it stands to reason that if we could ascertain bar profile evolution with time, then we might be able to age-date a bar. However, the rate of capturing stars onto bar orbits may itself evolve in time owing to minor mergers, star formation, and other processes, so the age indicator may still remain elusive.
There have been several studies to infer various ages of bars—using the vertical velocity dispersion (σz) of bars (Gadotti & de Souza2005), comparing gas mass with gas accretion rate
in the bar region (Elmegreen et al. 2009), and age of stellar
populations in bars (S´anchez-Bl´azquez et al.2011). However, we should be careful what we call the bar age. As bars are built out of disk stars and gas, the time elapsed since the formation of bar structure is not necessarily the same as the age of stellar populations that make up the bar.
Although the exact time since the bar formation cannot currently be easily determined, it is certainly a very important parameter to measure in order to understand the impact of bars in galaxy evolution. We expect that the flatness of the bar profile, combined with theoretical work, can be helpful in devising a way to measure the “dynamical age” of the bar. We expect that, in general, more dynamically evolved bars should have a flatter surface brightness profile, and we have presented the observational evidence that this is indeed the case.
5.5. Necessity for Cosmic Gas Accretion?
Previous studies have shown that the formation epoch of bars is correlated with the galaxy host properties—in other words, the more massive, bulge-dominated, early-type disk galaxies
formed their bars early (atz1, Sheth et al.2008; Cameron
et al. 2010; Kraljic et al. 2012; Melvin et al. 2014). Once
formed, bars are resilient and are not likely destroyed easily
(e.g., Athanassoula2003; Athanassoula et al.2013;
Romano-D´ıaz et al.2008) without major mergers.
At the same time, many barred spiral galaxies contain molecular gas within the bar radius (e.g., Sakamoto et al.1999; Sheth et al.2002,2005). This is surprising given that bars in
early-type galaxies have likely been in existence sincez∼1
(∼8 Gyr). Elmegreen et al. (2009) have argued that the ratio of the gas mass divided by the gas accretion rate may be used as an age for the bar. Typical disk gas surface densities in nearby spiral disks are∼5–10Mpc−2(Young et al.1995; Sheth et al.
2005). Typical bar radius is∼2.5 kpc (Erwin2005). Therefore, one expects the total gas mass inside the bar corotation of
∼109M
. Then all the gas within the bar corotation radius
should be deposited into the inner Lindblad resonance region within∼1 Gyr if we assume the gas inflow rate of 1Myr−1.
Indeed, with a detailed estimate, Elmegreen et al. (2009) argue that the bar in NGC 1365 is not much older than 1–2 Gyr.
For barred galaxies, gas within the bar corotation radius is driven inward, and gas outside the corotation radius is driven outward. Thus, in-plane accretion can only come from around the end of the bar region, except for a special case.27Then how
can there be molecular gas in these bars if we have a finite reservoir of gas and a star formation rate in the bar region? We argue that the gas might have been replenished via cosmic gas accretion (e.g., Sancisi et al.2008; Dekel et al.2009; Fraternali & Binney2006; Fraternali2014; Silk & Mamon2012; Combes 2014) for these barred galaxies. In general, gas in spiral galaxies can be replenished from outer disks where there is lots of gas that can come inward from spiral torques. However, for barred spiral galaxies the amount of gas that can be transported inward is limited. Therefore, we indeed need cosmic gas accretion to sustain bars and allow them to grow slowly over time. This is consistent with the results from cosmological simulations of Kraljic et al. (2012), which expect slow emergence of bars from
z∼1, and the slowdown of the bar growth in the presence of
gas (Athanassoula et al.2013). Lastly, such cosmic accretion
might be the origin of the gas that brings galaxies to evolve and renew bars (Bournaud & Combes2002; Block et al.2002).
6. SUMMARY AND CONCLUSIONS
We make use of 2D image decompositions on 144 barred
galaxies of Hubble types from SB0 to SBdm using 3.6μm
images drawn from the S4G. We investigate the structural
properties of bars, in particular radial light profiles of bars and 2D global shapes of bars. We summarize our results as follows.
1. We quantify the surface brightness profile of bars by fitting bar isophotes with the S´ersic profile. We find that massive, higher-B/T, and classical bulge galaxies tend to have flat bars, while less massive and bulgeless galaxies tend to show steeply decreasing exponential bar profiles. We find that whenever there is a bulge, galaxies tend to have flat bars.
27 If the spiral arm and bar are connected and their pattern speeds match, gas
2. We model the global shape of bars with generalized ellipses. All bars are found to be rectangular-like, i.e., boxy. There are no significant differences in the shape of bars among galaxies. This implies that as bars evolve, light profiles of bars change from exponential to flat, although their outermost shapes remain boxy.
3. We conjecture that at earlier evolutionary stages, the bar profile resembles that of the disk that shows an exponential profile (nbar ∼ 1). But as galaxies evolve, bars become stronger, and this leads to the development of flatter profiles. In this regard, our findings are consistent with the cosmological evolution of barred galaxies, which predicts that more massive, bulge-dominated, red disk galaxies formed their bars first and thus had enough time for their bars to evolve toward flat profiles. Combined with theoretical works and simulations, we will be able to diagnose the dynamical status of bars using light profiles of bars.
4. Cosmic gas accretion is strongly required to explain the presence of gas and star formation within bar regions for barred galaxies that have been in existence for more than their gas consumption timescale (∼1–2 Gyr).
We thank Frederic Bournaud, the referee, for insightful com-ments that greatly improved this paper. The authors thank the S4G team for their effort in this project. T.K. is grateful to
Woong-Tae Kim and his research group for their helpful com-ments and discussions. T.K., K.S., J.-C.M.-M., and T.M. ac-knowledge support from the National Radio Astronomy Obser-vatory. The National Radio Astronomy Observatory is a facility of the National Science Foundation operated under cooperative agreement by Associated Universities, Inc. We are grateful for
the support from NASA JPL/Spitzer grant RSA 1374189
pro-vided for the S4G project. T.K. and M.G.L. were supported by
the National Research Foundation of Korea (NRF) grant funded by the Korea Government (MEST; No. 2012R1A4A1028713). T.K. acknowledges the support from ESO for the studentship in 2011–2012. D.A.G. acknowledges funding under the Marie Curie Actions of the European Commission (FP7-COFUND). E.A. and A.B. thank the Centre National d’Etudes Spatiales for financial support. We acknowledge financial support from the People Programme (Marie Curie Actions) of the European
Union’s FP7/2007-2013/to the DAGAL network under REA
grant agreement No. PITN-GA- 2011-289313. L.C.H acknowl-edges support by the Chinese Academy of Science through grant No. XDB09030102 (Emergence of Cosmological Structures) from the Strategic Priority Research Program and by the Na-tional Natural Science Foundation of China through grant No. 11473002. This research is based on observations and archival
data made with theSpitzer Space Telescopeand made use of
the NASA/IPAC Extragalactic Database (NED), which are
op-erated by the Jet Propulsion Laboratory, California Institute of Technology, under a contract with the National Aeronautics and Space Administration (NASA). We acknowledge the usage of the HyperLeda database (http://leda.univ-lyon1.fr).
Facility:Spitzer
REFERENCES
Abraham, R. G., Merrifield, M. R., Ellis, R. S., Tanvir, N. R., & Brinchmann, J. 1999,MNRAS,308, 569
Arsenault, R. 1989, A&A,217, 66 Athanassoula, E. 1992a,MNRAS,259, 328 Athanassoula, E. 1992b,MNRAS,259, 345
Athanassoula, E. 2002,ApJL,569, L83 Athanassoula, E. 2003,MNRAS,341, 1179 Athanassoula, E. 2005,MNRAS,358, 1477 Athanassoula, E. 2012,MNRAS,426, L46
Athanassoula, E. 2013, in Bars and Secular Evolution in Disk Galaxies: Theoretical Input, ed. J. Falc´on-Barroso & J. H. Knapen (Cambridge: Cambridge Univ. Press), 305
Athanassoula, E., & Beaton, R. L. 2006,MNRAS,370, 1499
Athanassoula, E., Lambert, J. C., & Dehnen, W. 2005,MNRAS,363, 496 Athanassoula, E., Laurikainen, E., Salo, H., & Bosma, A. 2014,
arXiv:1405.6726
Athanassoula, E., Machado, R. E. G., & Rodionov, S. A. 2013,MNRAS, 429, 1949
Athanassoula, E., & Misiriotis, A. 2002,MNRAS,330, 35
Athanassoula, E., Morin, S., Wozniak, H., et al. 1990, MNRAS,245, 130 Athanassoula, E., Romero-G´omez, M., Bosma, A., & Masdemont, J. J.
2009a,MNRAS,400, 1706
Athanassoula, E., Romero-G´omez, M., Bosma, A., & Masdemont, J. J. 2010,MNRAS,407, 1433
Athanassoula, E., Romero-G´omez, M., & Masdemont, J. J. 2009b,MNRAS, 394, 67
Baldry, I. K., Glazebrook, K., Brinkmann, J., et al. 2004,ApJ,600, 681 Balogh, M. L., Baldry, I. K., Nichol, R., et al. 2004,ApJL,615, L101 Baumgart, C. W., & Peterson, C. J. 1986,PASP,98, 56
Begelman, M. C., & Shlosman, I. 2009,ApJL,702, L5
Block, D. L., Bournaud, F., Combes, F., Puerari, I., & Buta, R. 2002,A&A, 394, L35
B¨oker, T., Laine, S., van der Marel, R. P., et al. 2002,AJ,123, 1389 B¨oker, T., Sarzi, M., McLaughlin, D. E., et al. 2004,AJ,127, 105 B¨oker, T., Schinnerer, E., & Lisenfeld, U. 2011,A&A,534, A12 Bournaud, F., & Combes, F. 2002,A&A,392, 83
Buta, R., Block, D. L., & Knapen, J. H. 2003,AJ,126, 1148 Buta, R., & Combes, F. 1996, FCPh,17, 95
Buta, R. J., Knapen, J. H., Elmegreen, B. G., et al. 2009,AJ,137, 4487 Buta, R. J., Sheth, K., Regan, M., et al. 2010,ApJS,190, 147 Buta, R., et al. 2014, ApJS, submitted
Cameron, E., Carollo, C. M., Oesch, P., et al. 2010,MNRAS,409, 346 Chevance, M., Weijmans, A.-M., Damjanov, I., et al. 2012,ApJL,754, L24 Cisternas, M., Gadotti, D. A., Knapen, J. H., et al. 2013,ApJ,776, 50 Coelho, P., & Gadotti, D. A. 2011,ApJL,743, L13
Combes, F. 2008, in IAU Symp. 245, Formation and Evolution of Galaxy Bulges, ed. M. Bureau, E. Athanassoula, & B. Barbuy (Cambridge: Cambridge Univ. Press),151
Combes, F. 2014, in ASP Conf. Ser. 480, Structure and Dynamics of Disk Galaxies, ed. M. S. Seigar & P. Treuthardt (San Francisco, CA: ASP),211 Combes, F., & Elmegreen, B. G. 1993, A&A,271, 391
Comer´on, S., Elmegreen, B. G., Knapen, J. H., et al. 2011,ApJ,741, 28 Comer´on, S., Elmegreen, B. G., Salo, H., et al. 2012,ApJ,759, 98 Comer´on, S., Elmegreen, B. G., Salo, H., et al. 2014,A&A,571, 58 Comer´on, S., Knapen, J. H., Beckman, J. E., et al. 2010,MNRAS,402, 2462 Contopoulos, G. 1980, A&A,81, 198
Contopoulos, G., Gottesman, S. T., Hunter, J. H., Jr., & England, M. N. 1989,ApJ,343, 608
Dalcanton, J. J., Yoachim, P., & Bernstein, R. A. 2004,ApJ,608, 189 de Jong, R. S. 1996, A&AS,118, 557
de Souza, R. E., Gadotti, D. A., & dos Anjos, S. 2004,ApJS,153, 411 Debattista, V. P., Mayer, L., Carollo, C. M., et al. 2006,ApJ,645, 209 Debattista, V. P., & Sellwood, J. A. 1998,ApJL,493, L5
Dekel, A., Birnboim, Y., Engel, G., et al. 2009,Natur,457, 451 Devereux, N. 1987,ApJ,323, 91
Durbala, A., Sulentic, J. W., Buta, R., & Verdes-Montenegro, L. 2008,MNRAS, 390, 881
Dutil, Y., & Roy, J.-R. 1999,ApJ,516, 62
Dutton, A. A., van den Bosch, F. C., Faber, S. M., et al. 2011,MNRAS, 410, 1660
Ellison, S. L., Nair, P., Patton, D. R., et al. 2011,MNRAS,416, 2182 Elmegreen, B. G., & Elmegreen, D. M. 1985,ApJ,288, 438
Elmegreen, B. G., Elmegreen, D. M., Chromey, F. R., Hasselbacher, D. A., & Bissell, B. A. 1996,AJ,111, 2233
Elmegreen, B. G., Galliano, E., & Alloin, D. 2009,ApJ,703, 1297 Erwin, P. 2005,MNRAS,364, 283
Erwin, P., Beckman, J. E., & Pohlen, M. 2005,ApJL,626, L81 Erwin, P., & Debattista, V. P. 2013,MNRAS,431, 3060 Erwin, P., Pohlen, M., & Beckman, J. E. 2008,AJ,135, 20 Eskew, M., Zaritsky, D., & Meidt, S. 2012,AJ,143, 139
Fathi, K., Allen, M., Boch, T., Hatziminaoglou, E., & Peletier, R. F. 2010,MNRAS,406, 1595
Fazio, G. G., Hora, J. L., Allen, L. E., et al. 2004,ApJS,154, 10 Fisher, D. B., & Drory, N. 2008,AJ,136, 773
Fraternali, F. 2014, in IAU Symp. 298, Setting the Scene for Gaia and LAMOST, ed. S. Feltzing, G. Zhao, N. A. Walton, & P. Whitelock (Cambridge: Cambridge Univ. Press),228
Fraternali, F., & Binney, J. J. 2006,MNRAS,366, 449 Gadotti, D. A. 2008,MNRAS,384, 420
Gadotti, D. A. 2009,MNRAS,393, 1531 Gadotti, D. A. 2011,MNRAS,415, 3308
Gadotti, D. A., Baes, M., & Falony, S. 2010,MNRAS,403, 2053 Gadotti, D. A., & de Souza, R. E. 2005,ApJ,629, 797
Gadotti, D. A., & dos Anjos, S. 2001,AJ,122, 1298
Guti´errez, L., Erwin, P., Aladro, R., & Beckman, J. E. 2011,AJ,142, 145 Hasan, H., & Norman, C. 1990,ApJ,361, 69
Hasan, H., Pfenniger, D., & Norman, C. 1993,ApJ,409, 91
Hawarden, T. G., Mountain, C. M., Leggett, S. K., & Puxley, P. J. 1986,MNRAS, 221, 41P
Ho, L. C., Filippenko, A. V., & Sargent, W. L. W. 1997,ApJ,487, 591 Holwerda, B. W., Dalcanton, J. J., Radburn-Smith, D., et al. 2012,ApJ,753, 25 Holwerda, B. W., Gonz´alez, R. A., van der Kruit, P. C., & Allen, R. J. 2005,A&A,
444, 109
Hunt, L. K., & Malkan, M. A. 1999,ApJ,516, 660 Hunter, D. A., & Elmegreen, B. G. 2006,ApJS,162, 49 Jarvis, B. J. 1986,AJ,91, 65
Jogee, S., Barazza, F. D., Rix, H.-W., et al. 2004,ApJL,615, L105
Kauffmann, G., Heckman, T. M., White, S. D. M., et al. 2003, MNRAS, 341, 54
Kelvin, L. S., Driver, S. P., Robotham, A. S. G., et al. 2012,MNRAS,421, 1007 Kim, T., Gadotti, D. A., Sheth, K., et al. 2014,ApJ,782, 64
Kim, W.-T., Seo, W.-Y., & Kim, Y. 2012,ApJ,758, 14
Knapen, J. H., Beckman, J. E., Heller, C. H., Shlosman, I., & de Jong, R. S. 1995,ApJ,454, 623
Knapen, J. H., P´erez-Ram´ırez, D., & Laine, S. 2002,MNRAS,337, 808 Knapen, J. H., Shlosman, I., & Peletier, R. F. 2000,ApJ,529, 93 Kormendy, J., & Kennicutt, R. C., Jr. 2004,ARA&A,42, 603 Kraljic, K., Bournaud, F., & Martig, M. 2012,ApJ,757, 60
Kubryk, M., Prantzos, N., & Athanassoula, E. 2013,MNRAS,436, 1479 Laine, J., Laurikainen, E., Salo, H., et al. 2014,MNRAS,441, 1992 Laine, S., Shlosman, I., Knapen, J. H., & Peletier, R. F. 2002,ApJ,567, 97 Lansbury, G. B., Lucey, J. R., & Smith, R. J. 2014,MNRAS,439, 1749 Laurikainen, E., & Salo, H. 2002,MNRAS,337, 1118
Laurikainen, E., Salo, H., Athanassoula, E., Bosma, A., & Herrera-Endoqui, M. 2014,MNRAS,444, L80
Laurikainen, E., Salo, H., & Buta, R. 2004a,ApJ,607, 103 Laurikainen, E., Salo, H., & Buta, R. 2005,MNRAS,362, 1319
Laurikainen, E., Salo, H., Buta, R., & Knapen, J. H. 2007,MNRAS,381, 401 Laurikainen, E., Salo, H., Buta, R., & Knapen, J. H. 2011,MNRAS,418, 1452 Laurikainen, E., Salo, H., Buta, R., Knapen, J. H., & Comer´on, S.
2010,MNRAS,405, 1089
Laurikainen, E., Salo, H., Buta, R., & Vasylyev, S. 2004b,MNRAS,355, 1251 Lee, G.-H., Woo, J.-H., Lee, M. G., et al. 2012,ApJ,750, 141
L¨utticke, R., Dettmar, R.-J., & Pohlen, M. 2000,A&AS,145, 405
Maltby, D. T., Gray, M. E., Arag´on-Salamanca, A., et al. 2012a,MNRAS, 419, 669
Maltby, D. T., Hoyos, C., Gray, M. E., Arag´on-Salamanca, A., & Wolf, C. 2012b,MNRAS,420, 2475
Marinova, I., & Jogee, S. 2007,ApJ,659, 1176 Martin, P. 1995,AJ,109, 2428
Martin, P., & Roy, J.-R. 1994,ApJ,424, 599
Mart´ın-Navarro, I., Bakos, J., Trujillo, I., et al. 2012,MNRAS,427, 1102 Martinez-Valpuesta, I., Shlosman, I., & Heller, C. 2006,ApJ,637, 214 Martini, P., Regan, M. W., Mulchaey, J. S., & Pogge, R. W. 2003,ApJ,589, 774 McLeod, K. K., & Rieke, G. H. 1995,ApJ,441, 96
Meidt, S. E., Schinnerer, E., Knapen, J. H., et al. 2012a,ApJ,744, 17 Meidt, S. E., Schinnerer, E., Mu˜noz-Mateos, J.-C., et al. 2012b, ApJL,
748, L30
Melvin, T., Masters, K., Lintott, C., et al. 2014,MNRAS,438, 2882
Men´endez-Delmestre, K., Sheth, K., Schinnerer, E., Jarrett, T. H., & Scoville, N. Z. 2007,ApJ,657, 790
Moles, M., Marquez, I., & Perez, E. 1995,ApJ,438, 604 Mulchaey, J. S., & Regan, M. W. 1997,ApJL,482, L135
Mu˜noz-Mateos, J. C., Sheth, K., Gil de Paz, A., et al. 2013,ApJ,771, 59 Nair, P. B., & Abraham, R. G. 2010,ApJL,714, L260
Norman, C. A., Sellwood, J. A., & Hasan, H. 1996,ApJ,462, 114
Pastrav, B. A., Popescu, C. C., Tuffs, R. J., & Sansom, A. E. 2013,A&A, 553, A80
Peng, C. Y., Ho, L. C., Impey, C. D., & Rix, H.-W. 2002,AJ,124, 266 Peng, C. Y., Ho, L. C., Impey, C. D., & Rix, H.-W. 2010,AJ,139, 2097 P´erez, I., & S´anchez-Bl´azquez, P. 2011,A&A,529, A64
Pohlen, M., Dettmar, R.-J., L¨utticke, R., & Aronica, G. 2002,A&A,392, 807 Pohlen, M., & Trujillo, I. 2006,A&A,454, 759
Quillen, A. C. 1996, arXiv:astroph/96090141
Quillen, A. C., Frogel, J. A., & Gonzalez, R. A. 1994,ApJ,437, 162 Radburn-Smith, D. J., Roˇskar, R., Debattista, V. P., et al. 2012,ApJ,753, 138 Regan, M. W., & Elmegreen, D. M. 1997,AJ,114, 965
Regan, M. W., Sheth, K., & Vogel, S. N. 1999,ApJ,526, 97
Romano-D´ıaz, E., Shlosman, I., Heller, C., & Hoffman, Y. 2008, ApJL, 687, L13
Romero-G´omez, M., Athanassoula, E., Masdemont, J. J., & Garc´ıa-G´omez, C. 2007,A&A,472, 63
Romero-G´omez, M., Masdemont, J. J., Athanassoula, E., & Garc´ıa-G´omez, C. 2006,A&A,453, 39
Saha, K., Martinez-Valpuesta, I., & Gerhard, O. 2012,MNRAS,421, 333 Sakamoto, K., Okumura, S. K., Ishizuki, S., & Scoville, N. Z. 1999,ApJ,
525, 691
Salo, H., Laurikainen, E., Buta, R., & Knapen, J. H. 2010,ApJL,715, L56 S´anchez, S. F., Rosales-Ortega, F. F., Iglesias-P´aramo, J., et al. 2014,A&A,
563, A49
S´anchez, S. F., Rosales-Ortega, F. F., Marino, R. A., et al. 2012, A&A, 546, A2
S´anchez-Bl´azquez, P., Ocvirk, P., Gibson, B. K., P´erez, I., & Peletier, R. F. 2011,MNRAS,415, 709
Sancisi, R., Fraternali, F., Oosterloo, T., & van der Hulst, T. 2008, A&ARv, 15, 189
Scannapieco, C., & Athanassoula, E. 2012,MNRAS,425, L10 Sellwood, J. A. 1980, A&A,89, 296
Sellwood, J. A. 2014,RvMP,86, 1
Sellwood, J. A., & Wilkinson, A. 1993,RPPh,56, 173 Seo, W.-Y., & Kim, W.-T. 2013,ApJ,769, 100 S´ersic, J. L. 1963, BAAA,6, 41
S´ersic, J. L., & Pastoriza, M. 1965,PASP,77, 287 Shen, J., & Sellwood, J. A. 2004,ApJ,604, 614
Shen, S., Mo, H. J., White, S. D. M., et al. 2003,MNRAS,343, 978
Sheth, K., Elmegreen, D. M., Elmegreen, B. G., et al. 2008, ApJ, 675, 1141
Sheth, K., Regan, M., Hinz, J. L., et al. 2010,PASP,122, 1397
Sheth, K., Regan, M. W., Vogel, S. N., & Teuben, P. J. 2000,ApJ,532, 221 Sheth, K., Vogel, S. N., Regan, M. W., et al. 2002,AJ,124, 2581
Sheth, K., Vogel, S. N., Regan, M. W., Thornley, M. D., & Teuben, P. J. 2005,ApJ,632, 217
Silk, J., & Mamon, G. A. 2012,RA&A,12, 917
Skokos, C., Patsis, P. A., & Athanassoula, E. 2002,MNRAS,333, 861 Strateva, I., Ivezi´c, ˇZ., Knapp, G. R., et al. 2001,AJ,122, 1861 Valenzuela, O., & Klypin, A. 2003,MNRAS,345, 406 van der Wel, A., Rix, H.-W., Wuyts, S., et al. 2011,ApJ,730, 38 van Dokkum, P. G., Franx, M., Kriek, M., et al. 2008,ApJL,677, L5 Vika, M., Driver, S. P., Cameron, E., Kelvin, L., & Robotham, A. 2012,MNRAS,
419, 2264
Wang, J., Kauffmann, G., Overzier, R., et al. 2012,MNRAS,423, 3486 Weinzirl, T., Jogee, S., Khochfar, S., Burkert, A., & Kormendy, J. 2009,ApJ,
696, 411