Research Article
July
2017
Computer Science and Software Engineering
ISSN: 2277-128X (Volume-7, Issue-7)
IoT based e-Healthcare System to Enable Remote Patient
Care based on Cloud Server
1
P.Venu Gopala Rao*, 2Eslavath Raja, 3Ramakrishna Gandi, 4G.Ravi Kumar
1
Asst. Prof in CSE Department, Princeton College of Engineering & Technology, Hyderabad, India
2, 3, 4
Asst. Prof in CSE Department, CMR College of Engineering & Technology, Hyderabad, India
DOI: 10.23956/ijarcsse/V7I7/0108
Abstract— IoT (Internet of Things) has become most significant area of research to design an efficient data enabled services with the help of sensors. In this paper, a low-cost system design for e-healthcare service to process the sensitive health data is presented. Vital signs of the human body are measured from the patient location and shared with a registered medical professional for consultation. Temperature and heart rate are the major signals obtained from a patient for the initial build of the system. Data is sent to a cloud server where processing and analysis is provided for the medical professional to analyze. Secure transmission and dissemination of data through the cloud server is provided with an authentication system and the patient could be able to track his data through a smart phone on connecting to the cloud server. A prototype of the system along with its design parameters has been discussed.
Keywords— Arduino UNO; healthcare; heart rate sensor; temperature sensor, Cloud data analytics, IoT
I. INTRODUCTION
Medical treatment has become a very costly, complicated and time consuming nowadays. With growing population hospitals are always crowded and patients are made to wait a long time before meeting a doctor. Though emergency medical care is given to deserving patients, others are always in a queue. Existing systems work in such a way that patients have to go through a rigorous procedure even if they do not require serious attention. At the same time, hospitals are located mostly in cities. Telemedicine systems are a boon to people living in remote areas where they are connected to hospitals in cities for consultation with expert doctors. If a person or a community is equipped with simple cost effective devices where a measure of the vital signs is collected and sent to a registered doctor for consultation online, then every case need not rush to a hospital. The doctor can judge the severity of the patient’s ailment and recommend a direct consultation and further tests if necessary. For such a system to work, the device has to provide measurements close to clinical devices. Availability of such devices can change the healthcare landscape where people have access to medical care anywhere, anytime. In this work, an end-to-end system with a patient portal and doctor portal hosted on a cloud server is proposed to be connected to a simple healthcare device that can post the measured data on the secure cloud. The system scalable to include more components which can be added to the device for additional measurements and data can be pushed to the cloud server. This low-cost system is capable of working with low bandwidth internet connectivity while connecting a registered patient with a registered doctor 24 x 7. The system may be used for post medical care and follow up services that may be extended to their home instead of frequent hospital visits. To build a system of this kind needs solutions to many challenges. It requires the support of doctors, a secure cloud service provider and a standard to protect the privacy of patient data. In spite of the difficulties involved many service providers have started providing software support for extending hospital services online. It is predicted that a part of medical care available at the hospitals will be made available online as the internet of things architecture keeps evolving and cloud software vendors grow to support this feature.
II. BACKGROUND AND MOTIVATION
Work on remote medical aids has been consistently happening in the past few decades. Healthcare units for monitoring the elderly patients were carried out in [1], using bio-signals measured with a Smartphone. Most of the Arduino projects for medical aids deal with body temperature, body positioning, heart rate etc. [3]. The focus of the projects has been carried out in a most effective manner using a well-equipped tool [6]. Using latest technologies, they are able to reduce the workload of the both patients and doctors [4]. Researchers have proposed for creating a remote medical health-care for people in rural areas where availability of hospitals is profound [5]. Research related to analyzing the body temperature, body positioning, glucose rate etc. have been presented in [2]. Medical personnel can be facilities by providing creating a portable device [9] which has wireless connectivity, which can be used on any patients. Research that have been incorporated with android where also created [7] which can be used to personal data acquisition. Projects such as [8] are created for testing diabetics are also being developed for personal wellbeing. The proposed system explores the integration of smart sensors with low-cost hardware platforms for capturing the vital data on temperature and heartbeat.
III. SYSTEM DESIGN
ISSN(E): 2277-128X, ISSN(P): 2277-6451, DOI: 10.23956/ijarcsse/V7I7/0108, pp. 36-41
shown in the Fig. 1. The patient data is measured using the sensors and arduino board takes care of sending the data to cloud service. The data is viewable by a healthcare professional on smart phone. The system includes testing the heart rate and temperature of the patients. Any analysis of the observed data is done on the cloud service. Initially both patient and doctor should register to the cloud service. The patient is required to explicitly permit the healthcare professional to view his profile and data for any consultation. Only after the patient is registered into the system, the observed data may be sent to the cloud service. A healthcare personal can analyse data and take a decision on the severity of the patient’s health condition. The modules of the proposed system are described below.
Interactive Cloud Storage
The signal that is received from the Arduino board is forwarded to the cloud service and authorized patient is requested to upload their data to the server for further processing. Continuous uploading of data ensures that the data is appended to the earlier sent data so that a record of observations over a period of time is possible. The data is processed and plotted on a graph. Analysis report on the data includes separating the signal patterns to project the characteristics of the signal. Examining patients via the Internet is a challenging job, whereas this system is designed to be user-friendly, for both patients and doctor. Analyzes of observed data enables them to decide on the best possible follow up action. The advantage is that it’s easier to manage and identify the necessity of direct medical aids when the condition is actually demanding. The user interface allows patients to authorize a healthcare professional to access the data sent to the cloud service every time a consultation is requested through the service.
Healthcare Device
The hardware components are capable of measuring the heartbeat and temperature of patients. The signals are sent to the server after encryption for security of patient data during transfer. Data is encrypted during patient registration, access control, device authentication, and data access. The patient can use a smart-phone for all the services. It’s simple and user-friendly and allows patients to keep a close association with a healthcare professional for adequate medical assistance.
IV. SOFTWARE COMPONENTS OF THE SYSTEM
Patient Portal
A patient can create a profile and user account in the cloud service with required documents and picture through the patient portal. Patients can also view their uploaded data or profile anytime. The connected healthcare professional during a session between a patient and the professional gets notification whenever the patient uploads any data. The system acts as a preliminary healthcare assistant before actually going to a hospital for a serious ailment. The system shares the location of the patients on demand. The system also enables a chat session for simple communication between the two parties
ISSN(E): 2277-128X, ISSN(P): 2277-6451, DOI: 10.23956/ijarcsse/V7I7/0108, pp. 36-41
Doctor Portal
The interface of the doctor includes the ability to view any assigned patients and their data for analysis. The basic analysis reports on the measured data will be displayed to the doctor. If there is any abnormality in the data, graphical analysis helps in easy identification. The plotting of data is done without much latency for the doctor to check the fluctuations in data real-time. Doctors can comment data, and these comments are sent to the patients along with the analysis report. The system supports plotting multiple graphs together as well as individually for the convenience of doctor’s diagnosis.
Interactive Cloud Interface
Analyses of the observed patient data is done only in the cloud server. As the raw data that are received from the patients are directly forwarded to the cloud server. The cloud server plays an important role in this system as an analyst for the doctor. The reports on the data are customizable by the doctor. FFT is carried out on the patient data for exposing any abnormal variations in the recorded signals. Using these techniques, we are able to identify the abnormalities in the frequency.
Data Security
Patient signals are forwarded to the cloud service from a smart device using Wi-Fi. Once the patient is registered and authenticated by the system, they are able using their login credentials to upload their data to the server. Once they have done the process, an SMS notification is automatically sent to the doctor. Every data sent to the server and received from the server is encrypted on both the patient portal and doctor portal for secure data transmission. Location of the patient can be viewed by the doctor. As if the vital status of the patient shows any abnormality, then their location can be sketched for any critical situations. It’s also customized in such a way that the patient takes the initiative to share their current location. Chat session for both doctor’s and patient’s interface in order to communicate with each other if required. It’s an easy mode for both parties to share the information within a particular session. The patient’s data is stored in the cloud server in an encrypted form. For a doctor to view the data, patient has to send a code generated by the system. This authentication ensures that nobody accesses the patient data without permission of the patient. Every doctor and patient has to be registered as a user in the whole service. Both the doctor and patient will be authenticated for a particular session. A unique ID is assigned to the users which distinguishes a patient and doctor. Patients can directly request for the same doctor when next consultation is required.
V. HARDWARE COMPONENTS OF THE SYSTEM
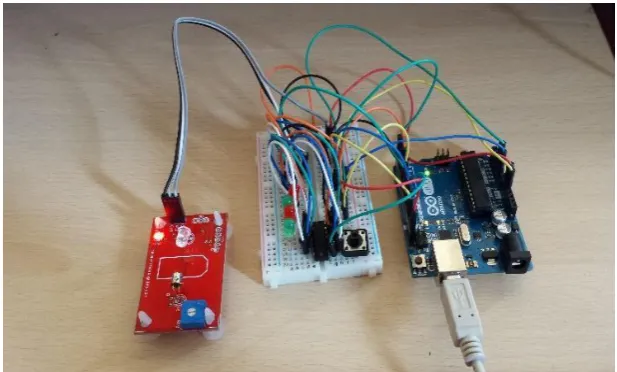
Heartbeat and temperature sensors are used for sensing with the fingertip of a person. A microcontroller such as Arduino and various other tools have been used for developing the device. Figure 4, shows the hardware setup of the healthcare device.
Figure. 2. Physical view of the device
ISSN(E): 2277-128X, ISSN(P): 2277-6451, DOI: 10.23956/ijarcsse/V7I7/0108, pp. 36-41
The sensor characteristics depend on the environment (physical/ electrical), the range of temperature, accuracy, response speed and as well as the thermal coupling. The sensor consists of 3-analog pins which provide a linear output of 10mV0/C with an accuracy rate of +/-1.50c and the temperate range of 0C to +1000C.
VI. RESULT AND ANALYSIS
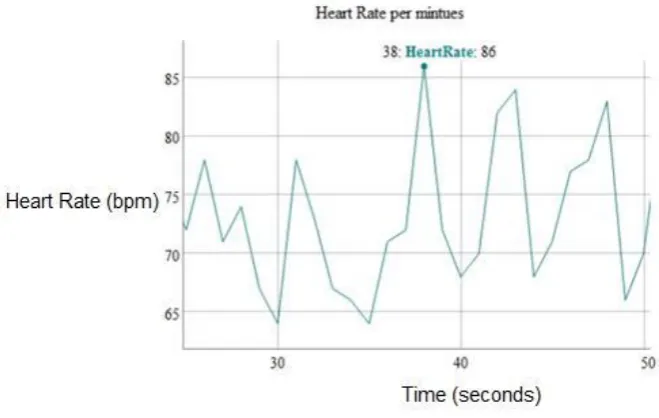
In figure 3, the temperature variation of a particular patient in given period of time. Using this data doctor will be able to analyze the frequency of variation of the body temperature of the patient. The peculiarity of this graphs that the graph can be zoom and the values can be viewed for even between two seconds. From the figure 4, the heart rate variation of the patient is shown over a specified set of the time period. Resultant data measured from the sensors are uploaded to the server where they are processed. The graph is plotted such that they can be zoomed in to monitor smaller variations of the signal. From the observed data, it has been possible to identify the abnormality in the patients. The standard value of both temperature and heart rate is known. The doctors can identify any minute fluctuation is the data. In this system, temperature is measured in terms of Fahrenheit and heart rate in beats per minute. The temperature of a human body in terms of Fahrenheit ranges from 97.3 -99 F and heart beat ranges from 60-110BPM for a healthy person.
Figure 3. Temperature Sensor Data
Figure 4. Heart Rate Sensor Data
ISSN(E): 2277-128X, ISSN(P): 2277-6451, DOI: 10.23956/ijarcsse/V7I7/0108, pp. 36-41
Figure. 5. Analysis using FFT in the temperature graph (a) peaks during the time interval
Figure. 5. b variation during the time intervals
ISSN(E): 2277-128X, ISSN(P): 2277-6451, DOI: 10.23956/ijarcsse/V7I7/0108, pp. 36-41
In figure 6 the doctor is able to view individual patient details in order to analyses their current situation. And they are able to send their comments to the patient through the submit button. At the same time if they want to communicate longer with the patients they are able to chat through a chat window. View image tab is used to view the complete data that the patients have uploaded such pictures, file, data and report in jpg, document file, CSV, and pdf respectively.
VII. PRIVACYANDSECURITYISSUES
The challenges faced is on how securely data is stored in the cloud. Securing information transmission has been done through encryption, but the main aim is to attain secure storage of data through cost effective methods. Better methods need to be identified to overcome the current situation. Securing the data which have been transmitted is yet another issue which plays an important role in the system. Here the system is implemented to incorporate generating code in order to make is secure enough for the transmit the data. Therefore, in future scope, we aim to incorporate encrypting the data that are sent from the patient side and the doctors could only be able to decrypt the data. Encryption-decryption of data must not take much time as we trying to work in a real-time environment. More professional authentication feature must be identified for the reliability of the data that have been send for registering into the system. Validation of the data that are entered must be carried out efficiently.
VIII. IMPACT OF THE SYSTEM
The system is user friendly to give satisfaction and overall value for patient health-care with a closer interaction of healthcare personals. This can also reduce the tension and emergency visits to the hospitals for the patients. Patients can use this device in their home for their healthcare than to be admitted, which in turn have a significant reduction of hospitalization. Modern healthcare products have proved evidence for increased healthcare facilities for the patient, and to manage more patients at a time. A large group of the patient can be supported bysingle healthcare professionals. The system is available at anytime, anyplace for the personal health-care via internet access using any smart device. This device allows a better health tracking system for analyzing information and conditions for the patient.
IX. CONCLUSIONS
The system is developed for cost effective patient care using sensor data routing. Patient’s data is sent to and stored in a cloud server for processing. The analysis of patient data is available and also enables keeping track of the patient data. Using the present system, the user (patient/assistant) has access to the device, and can captures the image/data using the sensors. We can incorporate various another sensor for analyzing the vital statistics of the human body such as ECG, galvanic for skin resistance etc. These sensors use standard methods to produce pictures or signals of the blood vessels. Future this project can be enhanced to analyze the various kinds of patient data based on the efficient data analytic techniques, by using the exiting IoT infrastructure. This type of service is proposed with the intention to provide basic medical care at the location of patients for a minimal cost.
REFERENCES
[1] Altaf Hamed Shajahan, A.Anand. "Data acquisition and control using Arduino-Android Platform." IEEE. 2013.
2.
[2] Hermawan Kemis, Ndibanje Bruce, Wang Ping, Tony Antonio, Lee Byung Gook, Hoon Jae Lee. " Healthcare
Monitoring Application in Ubiquitous Sensor Network: Design and Implementation based on Pulse Sensor with Arduino." IEEE. 2.
[3] I. Orha, S. Oniga."Study regarding the optimal sensors placement on the body for human activity recognition."
20th International Symposium for Design and Technology . Romania: 2014 IEEE, 2014. 2.
[4] Julio, Msc Telecom.Yair Enrique Rivera. "Development Of A Prototype Arduino Mobile In Area Of
Telemedicin For Remote Monitoring Diabetic People." Colombia: 2015 Asia-Pacific Conference on Computer
Aided System Engineering, 2015. 1.
[5] Lee, Y.D. and Chung, W.Y. (2009) “Wireless Sensor Network Based Wearable Smart Shirt for Ubiquitous
Health and Activity Monitoring”, Sensors and Actuators B: Chameical, Vol. 140, No. 2, July, pp. 390-395
[6] B. Schilit, M. Theime, Disseminating active map information to mobile hosts, IEEE Netw. 8 (1994) 22–32.
[7] B. Schilit, N. Adams, R. Want, Context-aware computing applications, in: Proceedings of the IEEE Workshop
on Mobile Computing Systems and Applications, Santa Cruz, CA, 1994, pp. 85– 90.
[8] B. Brumitt, S. Shafer, Topological world modeling using semantic spaces, in: Proceedings of Workshop on
Location Modeling for Ubiquitous Computing, Atlanta, GA, 2001, pp. 55–62.
[9] M. Baldauf, S. Dustdar, F. Rosenberg, A survey on context-aware systems, Int. J. Ad Hoc Ubiquitous Comput. 2
(4) (2007) 263–277.
[10] P. Oreizy, M. Gorlick, R. Taylor, D. Heimbigner, G. Johnson, N. Medvidovic, A. Quilici, D. Rosenblum, A.
Wolf, An architecturebased approach to self-adaptive software, IEEE Intell. Syst. 14 (1999) 54–62.
[11] Niewolny, David. " Freescale medical solutions ." Medical Applications Guide, 2010-2015: 17.
[12] Nishigandha D. Agham, Vijaya R. Thool, Ravindra C. Thool. "Mobile and Web Based Monitoring of Patient’s