ISSN: 2347-7474 International Journal Advances in Social Science and Humanities
Available Online at: www.ijassh.com
RESEARCH ARTICLE
Usage of Digital Resources, Services and Facilities in Minority
Engineering College Libraries under the Jurisdiction of
Jawaharlal Nehru Technological University, Kakinada: A Critical
Study
V. Kameswara Rao1*, M. Anjaiah2
1. Librarian & Ph. D Scholar, NIMRA Institute of Medical Sciences Jupudi, Ibrahimpatnam-521 456 A.P.
2. University Library, Dravidian University Kuppam – 517 426 Chittoor Dist., A.P.
*Corresponding Author:
V. Kameswara RaoAbstract
The basic aim of the study is to observe the usage pattern of electronic information
resources, services and facilities among the users’ of minority engineering colleges
affiliated Jawaharlal Nehru Technological University, Kakinada, Andhra Pradesh. The
survey design method with help of a well-structured questionnaire is used in the study
and 889 users of minority engineering colleges were randomly selected as sample for
this study. The study aimed at identifying the usage of various digital resources and
services, namely, college website, internet, intranet, online public access catalogue,
online databases, CD-ROM databases, online journals online books, and online lectures
in their libraries.
Introduction
In recent times, digital tools and technologies have transformed the entire landscape of library and information services. Today, digital resources allow a cross section of information seekers faster and cheaper access to unimaginably huge amounts of data and information across all areas of knowledge or expertise.
Significantly, Digital resources act as potential research tools that complement and supplement the printed information sources available through the long-established library system. Digital resources represent a huge pool of diverse resources that include documents in the digital or electronic format that is generally accessed via the Internet or, intranet in a digital library environment.
To be more specific, Digital resources refer to the electronic products or services that distribute a collection of data, text messages, image collection, and other multimedia products for the consumption of all user types
at designated library and information centers or, even a place of choice of the user away from it. Such resources can be dynamically shared among users, either on a simple CD-ROM or a DVD to being delivered through the Internet, reducing the time and space constraints. In essence, library users use digital tools to access books, journals, conferences proceedings, databases, e-newsletters, e-theses/projects and web search tools for meeting their varied academic and professional needs across disciplines and expertise.
And what makes digital resources popular and quite useful is its free and non-discriminatory availability to all user communities. All India Council for Technical Education (AICTE), an apex organization is responsible for the planning and the overall development of technical education in India.
(JNTUK) was originally ‘The College of Engineering, Vizagpatnam’ at the time of its establishment in 1946. It is now a sprawling campus of 110 acres, green with mango trees in the fast developing Port city of Kakinada, East coast of peninsula India. Kakinada has a rich political literacy and cultural heritage passed on through generations.
This college became a constituent of the Jawaharlal Nehru Technological University w.e.f 02-10-1972 through an act of legislature along with other sister institutions under the control of the then Director of Technical Education, Government of Andhra Pradesh. Earlier, it was affiliated to Andhra University. In the year 2003 the college has become autonomous.
The University offers undergraduate, post graduate and Ph.D. programmes in the fields of engineering, management and computer applications. Presently, there are 262 colleges affiliated to the University. The colleges are categorized as government, private-aided, and private-unaided based on the type of funding. A few colleges are classified as Minority Linguistic and Minority Religious based on the minority status of languages and religions. Further, these colleges are placed under the Autonomous and Non-Autonomous category of institutions based on the autonomy granted by UGC.
Objectives of the Study
The main objective of the study is to know the extent of usage pattern on various digital resources services and facilities in minority engineering college libraries.
Hypothesis of the Study
There would not be any significant differences in the usage pattern of various digital resources, services and facilities among the undergraduate students, postgraduate students and faculty members. Scope, Limitation and Methodology There are 262 engineering colleges affiliated to the Jawaharlal Nehru Technological University, Kakinada. These colleges are categorized as government, private-aided, and private-unaided based on the type of funding. A few colleges are classified as Minority based on the status of languages and religions.
The researcher has selected the following minority engineering colleges for the study. Al-Ameer College of Engineering and
Technology (AACET)
Bennaiah Institute of Technology Sciences (BITS)
NIMRA College of Engineering and Technology (NIMRA-CET)
NIMRA Institute of Engineering and Technology (NIMRA-IET)
Nova College of Engineering and Technology (NCET)
St. Mary’s Women’s Engineering College (St.MWEC)
The users of these minority engineering college libraries can be categorized as under graduate students, post graduate students, faculty members and others. However, the study is limited to the first three categories of users. The total number of UG, PG and faculty members of the selected colleges are 10080, 1080 and 843 respectively. However, due to the constraints of time, money and efforts involved, a total of 889 users were selected by using the stratified random sampling method. Out of the 889 users selected, 504 are under graduate students, 216 are post graduate students and 169 are faculty members.
While selecting the sample, the entire population is divided into various strata according to the type of college and category of users. From each stratum, a sample 20 percent is selected by applying a simple random method.
Analysis of Data
Users’ Usage Pattern of Digital Resource, Services and Facilities
The extent of users’ usage pattern of various digital resources and services, namely, college website, internet, intranet, online public access catalogue, online databases, CD-ROM databases, online journals online books, and online lectures in their libraries is described in the following paragraphs.
College Website
Table 1: Distribution of users with regard to the usage level of college website
Level of usage
Users
Total Undergraduate
students Postgraduate students
Faculty Members
Highly (43.06) 217 (43.52) 94 (42.01) 71 (42.97) 382
Frequently (23.01) 116 (20.83) 45 (20.71) 35 (22.05) 196
Occasionally (19.64) 99 (15.74) 34 (21.30) 36 (19.01) 169
Rarely (14.29) 72 (19.91) 43 (15.98) 27 (15.97) 142
TOTAL n=504
(100.00)
n=216 (100.00)
n=169 (100.00)
N=889 (100.00) (Note: Numbers indicated in parentheses are percentages)
χ² (UG – PG) : 4.5676 DF: 3 TV: 7.815 NS at 0.05 level χ² (UG – FM) : 0.7517 DF: 3 TV: 7.815 NS at 0.05 level χ² (PG – FM) :2.4693 DF: 3 TV: 7.815 NS at 0.05 level
Table 1 shows that a majority of the users (42.97%) used the college website information highly, 22.05 percent of them used frequently, 19.01 percent used occasionally and the remaining 15.97 percent of them rarely used.
It is also evident from Chi-square values that there are no significant differences in the level of usage of college website information among the under graduate students, post graduate students and faculty members. It is
proved by the χ² values, which are not significant at 0.05 levels with three degrees of freedom.
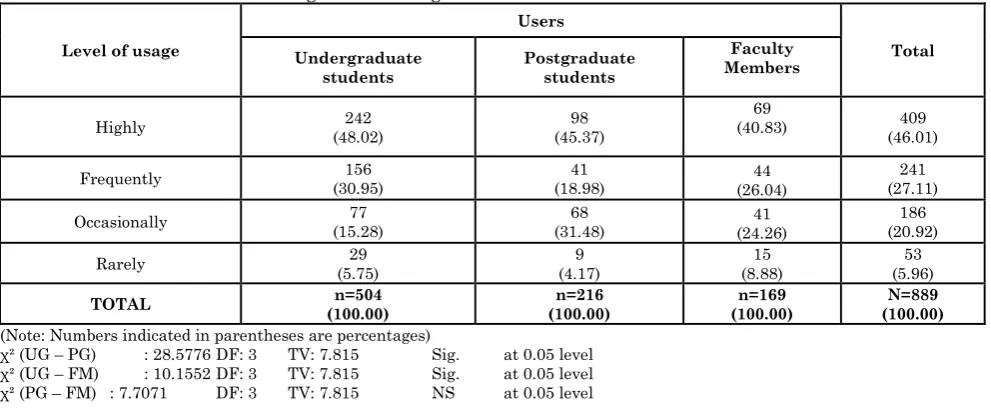
Internet
The distribution of users according to the level of usage pattern of internet is shown in Table 2. Table 2 shows that a majority of the users (46.01%) used internet facility highly, 27.11 percent of them used frequently, 20.92 percent used occasionally and the remaining 5.96 percent of them rarely used.
Table 2: Distribution of users with regard to the usage level of Internet
Level of usage
Users
Total Undergraduate
students
Postgraduate students
Faculty Members
Highly (48.02) 242 (45.37) 98 (40.83) 69 (46.01) 409
Frequently (30.95) 156 (18.98) 41 44
(26.04)
241 (27.11)
Occasionally (15.28) 77 (31.48) 68 41
(24.26)
186 (20.92)
Rarely (5.75) 29 (4.17) 9 (8.88) 15 (5.96) 53
TOTAL (100.00) n=504 (100.00) n=216 (100.00) n=169 (100.00) N=889
(Note: Numbers indicated in parentheses are percentages)
χ² (UG – PG) : 28.5776 DF: 3 TV: 7.815 Sig. at 0.05 level χ² (UG – FM) : 10.1552 DF: 3 TV: 7.815 Sig. at 0.05 level χ² (PG – FM) : 7.7071 DF: 3 TV: 7.815 NS at 0.05 level
It is evident from Chi-square values that there is significant difference in the level of usage of internet between the under graduate students and postgraduate one hand, and undergraduate students and faculty members on the other.
It is proved by the χ² values, which are significant at 0.05 levels with three degrees of freedom. This mean that undergraduate students used more compared to
postgraduate students and faculty members. However, there is no significant difference in this regard between the postgraduate students and faculty members.
Intranet
Table 3: Distribution of users with regard to the usage level of Intranet
Level of usage
Users
Total Undergraduate
students
Postgraduate students
Faculty Members
Highly (43.06) 217 (42.13) 91 (43.79) 74 (42.97) 382
Frequently (24.40) 123 (22.68) 49 (18.93) 32 (22.95) 204
Occasionally (21.43) 108 (17.13) 37 (25.44) 43 (21.15) 188
Rarely (6.55) 33 (8.34) 18 (6.51) 11 (6.97) 62
Not at all (4.56) 23 (9.72) 21 (5.33) 9 (5.96) 53
TOTAL (100.00) n=504 (100.00) n=216 (100.00) n=169 (100.00) N=889
(Note: Numbers indicated in parentheses are percentages)
χ² (UG – PG) : 8.8701 DF: 4 TV: 9.488 NS at 0.05 level χ² (UG – FM) : 2.724 DF: 4 TV: 9.488 NS at 0.05 level χ² (PG – FM) :6.6201 DF: 4 TV: 9.488 NS at 0.05 level
Table 3 shows that a majority of the users (42.97%) used intranet facility highly, 22.95 percent of them used frequently, 21.15 percent used occasionally, 6.97 percent of them used rarely, and the remaining 5.96 percent of them not at all used.
It is also evident from Chi-square values that there are no significant differences in the level of usage of intranet facility among the under
graduate students, post graduate students and faculty members. It is proved by the χ² values, which are not significant at 0.05 levels with four degrees of freedom.
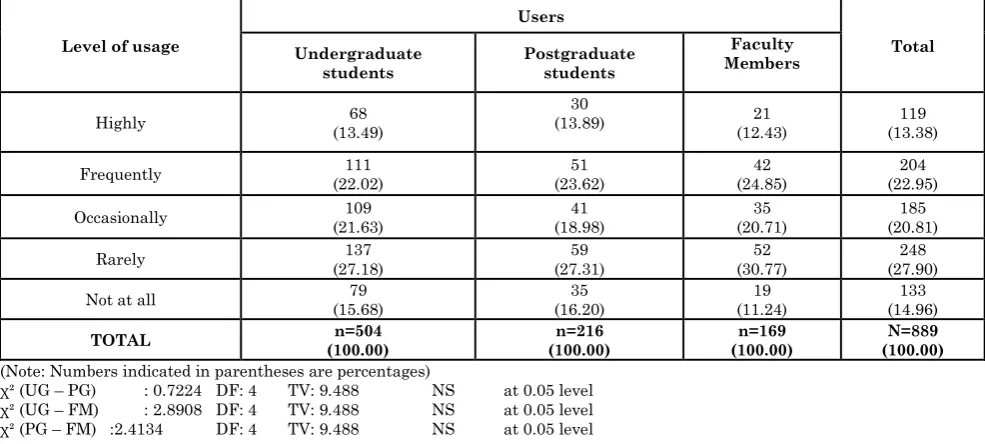
Online Public Access Catalogue
The distribution of users according to the level of usage pattern of online public access catalogue is shown in Table 4.
Table 4: Distribution of users with regard to the usage level of OPAC
Level of usage
Users
Total Undergraduate
students Postgraduate students
Faculty Members
Highly (13.49) 68
30
(13.89) (12.43) 21 (13.38) 119
Frequently 111
(22.02)
51 (23.62)
42 (24.85)
204 (22.95)
Occasionally (21.63) 109 (18.98) 41 (20.71) 35 (20.81) 185
Rarely 137
(27.18)
59 (27.31)
52 (30.77)
248 (27.90)
Not at all (15.68) 79 (16.20) 35 (11.24) 19 (14.96) 133
TOTAL (100.00) n=504 (100.00) n=216 (100.00) n=169 (100.00) N=889
(Note: Numbers indicated in parentheses are percentages)
χ² (UG – PG) : 0.7224 DF: 4 TV: 9.488 NS at 0.05 level χ² (UG – FM) : 2.8908 DF: 4 TV: 9.488 NS at 0.05 level χ² (PG – FM) :2.4134 DF: 4 TV: 9.488 NS at 0.05 level
Table 4 shows that a majority of the users (27.90%) used online public access catalogue rarely, 22.95 percent of them used frequently, and 20.81 percent used occasionally, 14.96 percent of them used not at all, and the remaining 13.38 percent of them highly used.
It is also evident from Chi-square values that there are no significant differences in the level of usage of online public access
catalogue among the under graduate students, post graduate students and faculty members. It is proved by the χ² values, which are not significant at 0.05 levels with four degrees of freedom.
Online databases
Table 5: Distribution of users with regard to the usage level of online databases
Level of usage
Users
Total Undergraduate
students Postgraduate students members Faculty
Highly (16.07) 81 (14.81) 32 (11.83) 20 (14.96) 133
Frequently (17.46) 88 (18.98) 41 (18.94) 32 (18.11) 161
Occasionally (23.02) 116 (22.23) 48 (18.34) 31 (21.93) 195
Rarely 155
(30.75)
81 (37.5)
57 (33.73)
293 (32.96)
Not at all (12.70) 64 (6.48) 14 (17.16) 29 (12.04) 107
TOTAL (100.00) n=504 (100.00) n=216 (100.00) n=169 (100.00) N=889
(Note: Numbers indicated in parentheses are percentages)
χ² (UG – PG) : 7.8829 DF: 4 TV: 9.488 NS at 0.05 level χ² (UG – FM) : 5.1117 DF: 4 TV: 9.488 NS at 0.05 level χ² (PG – FM) :11.3574 DF: 4 TV: 9.488 Sig. At 0.05 level
Table 5 shows that a majority of the users (32.96%) used online databases rarely, 21.93 percent of them used occasionally, and 18.11 percent of them used frequently, 14.96 percent of them used highly, and the remaining 12.04 percent of them not at all used.
It is evident from Chi-square values that there is no significant difference in the level of usage of online databases between the under graduate students and postgraduate one hand, and undergraduate students and faculty members on the other. It is proved by the χ² values, which are not significant at 0.05 levels with four degrees of freedom.
However, there is significant difference in this regard between the postgraduate students and faculty members. This mean that postgraduate students used more compared to faculty members.
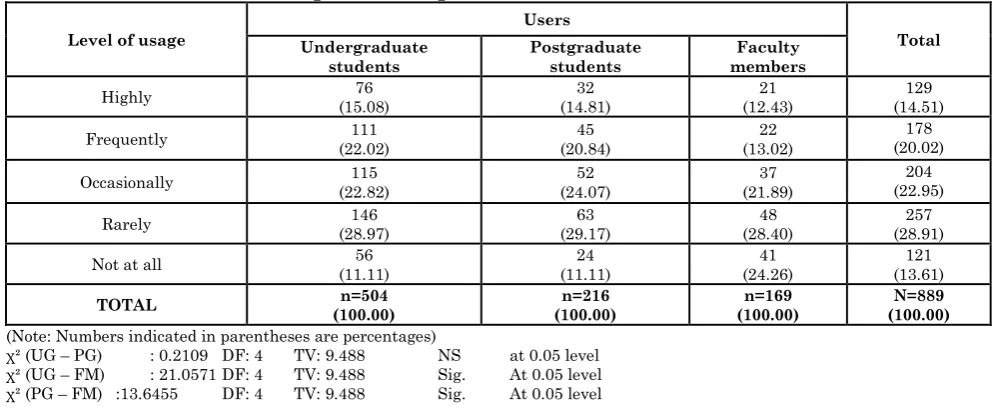
CD-ROM databases
The distribution of users according to the level of usage pattern of CD-ROM databases is shown in Table 6. Table 6 shows that a majority of the users (28.91%) used CD-ROM databases rarely, 22.95 percent of them used occasionally, and 20.02 percent of them used frequently, 14.51 percent of them used highly, and the remaining 13.61 percent of them not at all used.
Table 6: Distribution of users with regard to the usage level of CD-ROM databases
Level of usage
Users
Total Undergraduate
students
Postgraduate students
Faculty members
Highly (15.08) 76 (14.81) 32 (12.43) 21 (14.51) 129
Frequently (22.02) 111 (20.84) 45 (13.02) 22 (20.02) 178
Occasionally (22.82) 115 (24.07) 52 (21.89) 37 (22.95) 204
Rarely (28.97) 146 (29.17) 63 (28.40) 48 (28.91) 257
Not at all (11.11) 56 (11.11) 24 (24.26) 41 (13.61) 121
TOTAL (100.00) n=504 (100.00) n=216 (100.00) n=169 (100.00) N=889
(Note: Numbers indicated in parentheses are percentages)
χ² (UG – PG) : 0.2109 DF: 4 TV: 9.488 NS at 0.05 level χ² (UG – FM) : 21.0571 DF: 4 TV: 9.488 Sig. At 0.05 level χ² (PG – FM) :13.6455 DF: 4 TV: 9.488 Sig. At 0.05 level
It is evident from Chi-square values that there is significant difference in the level of usage of CD-ROM databases between the under graduate students and faculty members one hand, and postgraduate students and faculty members on the other. It is proved by the χ² values, which are
Online Journals The distribution of users according to the level of usage pattern of online journals is shown in Table 8.
Table 7: Distribution of users with regard to the usage level of online journals
Level of usage
Users
Total Undergraduate
students
Postgraduate students
Faculty members
Highly (14.09) 71 (18.98) 41 (23.08) 39 (16.98) 151
Frequently 116
(23.02)
54 (25.00)
35 (20.71)
205 (23.06)
Occasionally (34.92) 176 (31.02) 67 (34.91) 59 (33.97) 302
Rarely (14.68) 74 (11.57) 25 (14.79) 25 (13.95) 124
Not at all 67
(13.29)
29 (13.43)
11 (6.51)
107 (12.04)
TOTAL (100.00) n=504 (100.00) n=216 (100.00) n=169 (100.00) N=889
(Note: Numbers indicated in parentheses are percentages)
χ² (UG – PG) : 4.327 DF: 4 TV: 9.488 NS at 0.05 level χ² (UG – FM) : 11.5854 DF: 4 TV: 9.488 Sig. At 0.05 level χ² (PG – FM) :7.082 DF: 4 TV: 9.488 NS at 0.05 level
Table 7 shows that a majority of the users (33.97%) used online journals occasionally, 23.06 percent of them used frequently, and 16.98 percent of them used highly, 13.95 percent of them used rarely, and the remaining 12.04 percent of them not at all used. It is evident from Chi-square values that there is no significant difference in the level of usage of online journals between the under graduate students and postgraduate one hand, and postgraduate students and faculty members on the other. It is proved by
the χ² values, which are not significant at 0.05 levels with four degrees of freedom. However, there is significant difference in this regard between the undergraduate students and faculty members. This mean that faculty members used more compared to undergraduate students.
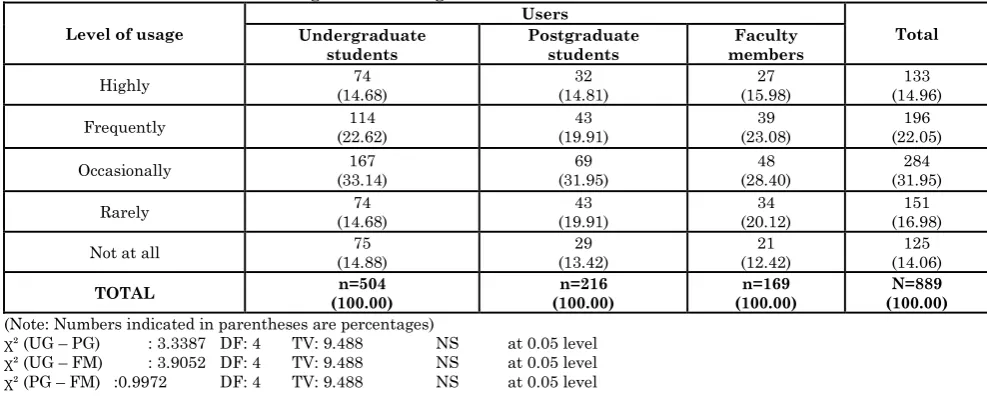
Online Books
The distribution of users according to the level of usage pattern of online books is shown in Table 8.
Table 8: Distribution of users with regard to the usage level of online books
Level of usage
Users
Total Undergraduate
students Postgraduate students members Faculty
Highly (14.68) 74 (14.81) 32 (15.98) 27 (14.96) 133
Frequently (22.62) 114 (19.91) 43 (23.08) 39 (22.05) 196
Occasionally (33.14) 167 (31.95) 69 (28.40) 48 (31.95) 284
Rarely (14.68) 74 (19.91) 43 (20.12) 34 (16.98) 151
Not at all (14.88) 75 (13.42) 29 (12.42) 21 (14.06) 125
TOTAL (100.00) n=504 (100.00) n=216 (100.00) n=169 (100.00) N=889
(Note: Numbers indicated in parentheses are percentages)
χ² (UG – PG) : 3.3387 DF: 4 TV: 9.488 NS at 0.05 level χ² (UG – FM) : 3.9052 DF: 4 TV: 9.488 NS at 0.05 level χ² (PG – FM) :0.9972 DF: 4 TV: 9.488 NS at 0.05 level
Table 8 shows that a majority of the users (31.95%) used online books occasionally, 22.05 percent of them used frequently, and 16.98 percent of them used rarely, 14.96 percent of them used highly, and the remaining 14.06 percent of them not at all used. It is also evident from Chi-square values that there are no significant
Online Lectures The distribution of users according to the level of usage pattern of online lectures is shown in Table 9.
Table 9: Distribution of users with regard to the usage level of online lectures
Level of usage
Users
Total Undergraduate
students
Postgraduate students
Faculty members
Highly (19.05) 96 (17.13) 37 (8.88) 15 (16.65) 148
Frequently 128
(25.40)
49 (22.68)
28 (16.57)
205 (23.06)
Occasionally (30.95) 156 (23.61) 51 (30.18) 51 (29.02) 258
Rarely (16.07) 81 (18.06) 39 (39.64) 67 (21.03) 187
Not at all 43
(8.53)
40 (18.52)
8 (4.73
91 (10.24)
TOTAL (100.00) n=504 (100.00) n=216 (100.00) n=169 (100.00) N=889
(Note: Numbers indicated in parentheses are percentages)
χ² (UG – PG) : 17.0263 DF: 4 TV: 9.488 Sig. at 0.05 level χ² (UG – FM) : 46.6113 DF: 4 TV: 9.488 Sig. at 0.05 level χ² (PG – FM) : 38.6022 DF: 4 TV: 9.488 Sig. at 0.05 level
Table 9 shows that a majority of the users (29.02%) used online lectures occasionally, 23.06 percent of them used frequently, and 21.03 percent of them used rarely, 16.65 percent of them used highly, and the remaining 10.24 percent of them not at all used. It is also evident from Chi-square values that there are significant differences in the level of usage of online lectures among the under graduate students, post graduate students and faculty members.
It is proved by the χ² values, which are significant at 0.05 levels with four degrees of freedom. This means that undergraduate students are more used than the postgraduate students and faculty members. Findings
The following are the findings obtained from the analysis of data collected from users of minority engineering college libraries under the jurisdiction of Jawaharlal Nehru Technological University, Kakinada.
A majority of the users (42.97%) used the college website information highly, 22.05 percent of them used frequently, 19.01 percent used occasionally and the remaining 15.97 percent of them rarely used.
There are no significant differences in the level of usage of college website information among the under graduate students, post graduate students and faculty members. A majority of the users (46.01%) used
internet facility highly, 27.11 percent of
them used frequently, 20.92 percent used occasionally and the remaining 5.96 percent of them rarely used.
There is significant difference in the level of usage of internet between the under graduate students and postgraduate one hand, and undergraduate students and faculty members on the other. This mean that undergraduate students used more compared to postgraduate students and faculty members.
There is no significant difference in this regard between the postgraduate students and faculty members.
A majority of the users (42.97%) used intranet facility highly, 22.95 percent of them used frequently, 21.15 percent used occasionally, 6.97 percent of them used rarely, and the remaining 5.96 percent of them not at all used.
There are no significant differences in the level of usage of intranet facility among the under graduate students, post graduate students and faculty members.
A majority of the users (27.90%) used online public access catalogue rarely, 22.95 percent of them used frequently, 20.81 percent used occasionally, 14.96 percent of them used not at all, and the remaining 13.38 percent of them highly used.
A majority of the users (32.96%) used online databases rarely, 21.93 percent of them used occasionally, 18.11 percent of them used frequently, 14.96 percent of them used highly, and the remaining 12.04 percent of them not at all used
There is no significant difference in the level of usage of online databases between the under graduate students and postgraduate one hand, and undergraduate students and faculty members on the other. There is significant difference in this
regard between the postgraduate students and faculty members. This mean that postgraduate students used more compared to faculty members.
A majority of the users (28.91%) used CD-ROM databases rarely, 22.95 percent of them used occasionally, 20.02 percent of them used frequently, 14.51 percent of them used highly, and the remaining 13.61 percent of them not at all used.
There is significant difference in the level of usage of CD-ROM databases between the under graduate students and faculty members one hand, and postgraduate students and faculty members on the other. This mean that undergraduate students used more compared to postgraduate students and faculty members.
There is no significant difference in this regard between the undergraduate students and postgraduate students.
A majority of the users (33.97%) used online journals occasionally, 23.06 percent of them used frequently, 16.98 percent of
them used highly, 13.95 percent of them used rarely, and the remaining 12.04 percent of them not at all used.
There is no significant difference in the level of usage of online journals between the under graduate students and postgraduate one hand, and postgraduate students and faculty members on the other. There is significant difference in this regard between the undergraduate students and faculty members. This means that faculty members used more compared to undergraduate students.
A majority of the users (31.95%) used online books occasionally, 22.05 percent of them used frequently, 16.98 percent of them used rarely, 14.96 percent of them used highly, and the remaining 14.06 percent of them not at all used.
There are no significant differences in the level of usage of online books among the under graduate students, post graduate students and faculty members.
A majority of the users (29.02%) used online lectures occasionally, 23.06 percent of them used frequently, 21.03 percent of them used rarely, 16.65 percent of them used highly, and the remaining 10.24 percent of them not at all used.
There are significant differences in the level of usage of online lectures among the under graduate students, post graduate students and faculty members. This means that undergraduate students are more used than the postgraduate students and faculty members.
References
1. Doraswamy M (2012) Information use pattern
towards library services and facilities by the faculty members of Siddhartha Educational Institutions Vijayawada, Andhra Pradesh: a study. International
Journal of Information Dissemination and
Technology, 2(3): 176-181.
2. Doraswamy M (2011) Information Seeking
Behaviour and Satisfaction towards Library Resources by the Faculty Members: A Study of Siddhartha Educational Institutions, Vijayawada. International Journal of Library and Information Management, 2(2): 1-8.
3. Millawithnachchi U S (2012) Electronic resources usage by postgraduates at the University of Colombo: Identifying the critical success factors. Annals of Library and Information Studies, 59: 53-63.
4. Pushpalatha K, Mallaiah TY (2009) “Use of Information Resources in Chemistry: A Study of Mangalore University Library”. Annals of Library and Information Studies, 56(3): 175-183.
5. Saikia, Mukesh, Gohain, Anjan. (2013) "Use and User’s Satisfaction on Library Resources and Services in Tezpur University (India): a study". Library Philosophy and Practice (e-journal). Paper
972. Http: //digital commons.
unl.edu/libphilprac/972.