European Journal of Physical Education and Sport Science
ISSN: 2501 - 1235 ISSN-L: 2501 - 1235 Available on-line at: www.oapub.org/eduCopyright © The Author(s). All Rights Reserved.
doi: 10.5281/zenodo.1342463 Volume 4 │ Issue 10 │ 2018
ARE OUR STADIUMS READY FOR EURO 2024?
EVALUATION OF SERVICE QUALITY
iKerem Yıldırım Şimşek,
Hüseyin Çevikii
Department of Recreation, Faculty of Sport Sciences, Eskişehir Technical University, Turkey
Abstract:
For sports enterprisers, providing quality service to sports consumers, such as football supporters helps to achieve the kind of participation in and consumption of important sports events that these businesses want. As a result, it is important that the quality of the service offered is known by both sports marketers and service providers. The aim of the research was to compare the perceptions of service quality of spectators who watched the 2014-2015 football season in an old stadium and the perceptions of service quality of spectators who watched 2016-2017 season in the new stadium, and to determine what needs to be done in order to make the level of service at the new stadium the best possible. The population of the research included the spectators following the Eskisehirspor competitions in the 2014-2015 and 2016-2017 football seasons. A total of 888 (715 male; 173 female) spectators were selected from within the determined population by the convenience sampling method. The “Scale of Event Quality for Spectator Sports” was used as data collection tool in the research. When the data obtained from the study were examined, it was determined that the spectators in new stadium gave a higher average score than the spectators in the old stadium in
terms of the dimensions in which difference occurred. As a conclusion, the
improvement in the event quality was not at the expected level and the event quality required by the spectators in the new stadium was not at the highest level.
Keywords: Euro 2024, football, stadium, event quality
1. Introduction
Quite substantial investments have been made in recent years in Turkey in terms of the facilities established by the football industry. In 2015, the Turkish Ministry of Youth and
Sports announced 26 new stadium projects, and many stadiums have already begun to provide services. In this context, one of the main questions within the scope of this research is as follows: “Are the new stadiums contributing positively to the quality of the
service provided for the event?” Providing a high level of service in new stadiums which
contribute greatly to Turkish football is very important for Turkey’s candidacy for EURO 2024 (2024 European Football Championship). For EURO 2024, UEFA is requesting that the host country have nine or ten stadiums. Two or three of these must have a capacity of at least 50,000, three must seat at least 40,000 and four of these must be able to accommodate at least 30,000 spectators. One of the stadiums that Turkey is planning to use during EURO 2024 is Eskisehirspor stadium, which opened in the 2016-2017 season with a seating capacity of 34,930. Eskisehirspor stadium is an important example of the new stadiums that will be used, because the stadium is easily accessible to spectators by various transport means, the surroundings are designed both for crowd management and entertainment, the city is able to supply the audience required by EURO 2024, and the atmosphere in the stadium and the interior design have features that can affect the spectator. The development of qualifying matches for the events held in the new Eskisehirspor stadium is crucial not only for EURO 2024 but also for Eskisehirspor's Sports Toto Super League competitions. As a club, Eskisehirspor and its stadium have the same problems as many sports organizations in the world. Sports organizations are faced with difficulties retaining customers as a result of rising prices and rising expectations about the quality of the event (Howard & Crompton, 2004). In order to reduce this resistance, sports clubs should try to provide the best possible products and services as well as to reduce their operational costs. The inadequacy of scientific research to determine whether football clubs are receiving appropriate recompense for the services offered is another reason contributing to the formation of this situation. However, all stakeholders can be satisfied, improvements in quality can be achieved and audience participation and retention can be increased by introducing permanent measures and practices on the basis of findings obtained by scientific data. In this context, the research problems were: “What are the differences in spectators' perception of the quality of events in the old and new Eskisehirspor stadiums?” and “What should be done to make the service provided in the new stadium the best possible?” The aim of the research was to compare spectators’ perceptions of the quality of events in the old and the new stadiums and to determine what needs to be done in order to bring the service provided in the new stadium to the highest level.
2. Literature Review
among researchers that the concept of service quality is multidimensional and hierarchical (Yıldız, 2012). Over time, a number of unique scales have emerged that use different factors and measurement structures to measure service quality. Measurement models that assess service quality in the sports industry can be classified under the headings of “participation-based” and “audience-oriented” service quality due to the varying nature of sports services (Theodorakis & Alexandris, 2008). Despite the differences and uniqueness of each of the scales that assessed audience-oriented service quality, a clear theme emerged: they were particularly focused on the service framework, which was defined as the physical environment in which service distribution occurs. Emphasis was placed on physical and tangible resources in the literature among studies focused on service quality and especially sports facilities. Research in the sports field shows how perceived service quality, perceived space quality, intentions to revisit and product and satisfaction perceptions are influenced by the service framework. It is useful to examine some of the developed scales to better understand this effect.
quality (player performance, opponent quality) and aesthetic quality (crowd experience, game atmosphere). The latest model that has evaluated the quality of service in sports for spectators is the MEQSS model developed by Ko et al. (2011). In this model, service quality was measured by quality of game (skill performance, operation time, knowledge), augmented service quality (entertainment, concessions), interaction quality (employee interaction, fan interaction), outcome quality (sociability, value) and physical environment (ambience, design, scoreboard). When the scales and measurement models developed to measure service quality are evaluated, it is thought that two factors are the most important in evaluating service quality. The first is the physical property of the room where the service is offered. It was observed that this dimension was included in many measurement models. The second is game quality or core product dimension. The spectator comes to places offering services for the core product in particular. The performance of the players and the quality of the opponent can affect the perception of quality of the core product. In this study, the model developed by Ko et al.(2011) was used since it uses the two dimensions to evaluate perception of service quality and is one of the most recently developed models.
Event quality is used by researchers for both marketing (Dale et al., 2005; Kelley & Turley, 2001; Shilbury, 1994; Wakefield et al., 1996) and operational aspects. The general impressions about the experience provided determine perceptions about the quality of the event. Providing sustained high-quality services is a goal that sports organizations are aiming to achieve (Tsitskari et al., 2006), and providing quality experiences to consumers supports participation in future sporting events and consumption of these events (Tsuji et al., 2007).
3. Material and Methods
3.1 Participants
The population of the research involves spectators following the Eskisehirspor competitions in the 2014-2015 and 2016-2017 football seasons. For the 2014-2015 season 488 (male 444, female 44) and for the 2016-2017 season 400 (male 271, female 129) were selected from the population with the convenience sampling method, making a total of 888 spectators.
3.2 Data Collection Tool and Technique
The data were collected using the face-to-face interview technique via “Scale of Event Quality in Spectator Sports” (SEQSS) (Ko et al., 2011) and a survey with demographic questions.
3.3 Analysis of Data: The differences in gender, age, education level, occupation and
homogeneity of the t-test and ANOVA for the averages that have difference was assessed by Levene's test.
4. Results
The comparison was made by taking into consideration the groups having the highest average from the tables based on the demographic characteristics. In addition, groups that did not show a difference in the tables were not included.
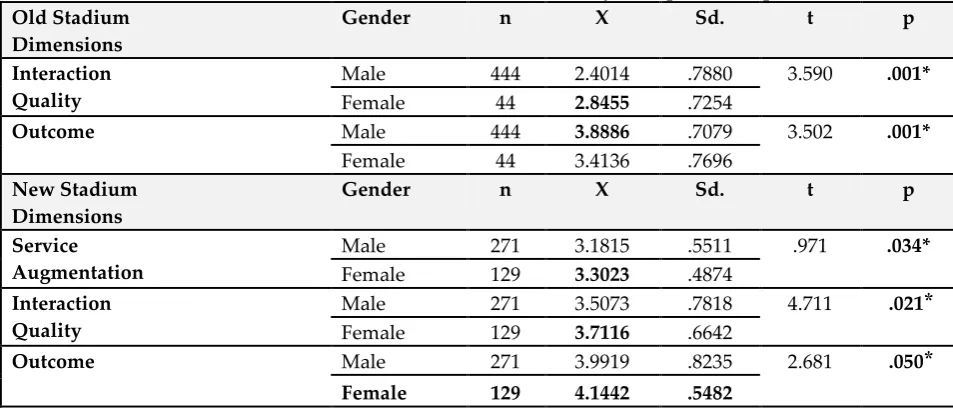
Table 1: Differentiation Status of Sample Group by Gender in 2014-2015 and 2016-2017 Seasons in terms of Dimensions of Scale of Event Quality for Spectator Sports
Old Stadium Dimensions
Gender n X Sd. t p
Interaction Quality
Male 444 2.4014 .7880 3.590 .001* Female 44 2.8455 .7254
Outcome Male 444 3.8886 .7079 3.502 .001*
Female 44 3.4136 .7696 New Stadium
Dimensions
Gender n X Sd. t p
Service Augmentation
Male 271 3.1815 .5511 .971 .034* Female 129 3.3023 .4874
Interaction Quality
Male 271 3.5073 .7818 4.711 .021 ⃰
Female 129 3.7116 .6642
Outcome Male 271 3.9919 .8235 2.681 .050 ⃰
Female 129 4.1442 .5482
Table 1 shows that women had a higher average than men in the interaction dimension of event quality in the old stadium. In the outcome dimension, men had a higher average than women. In the service augmentation, interaction and outcome dimensions of the activity quality in the new stadium, women had a higher average than men.
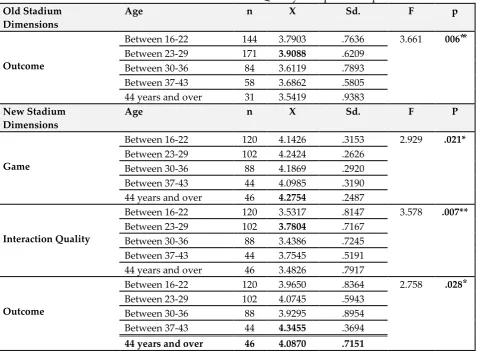
Table 2: Differentiation Status of Sample Group by Age in 2014-2015 and 2016-2017 Seasons in terms of Dimensions of Scale of Event Quality for Spectator Sports
Old Stadium Dimensions
Age n X Sd. F p
Outcome
Between 16-22 144 3.7903 .7636 3.661 006 ⃰⃰
Between 23-29 171 3.9088 .6209 Between 30-36 84 3.6119 .7893 Between 37-43 58 3.6862 .5805 44 years and over 31 3.5419 .9383 New Stadium
Dimensions
Age n X Sd. F P
Game
Between 16-22 120 4.1426 .3153 2.929 .021* Between 23-29 102 4.2424 .2626
Between 30-36 88 4.1869 .2920 Between 37-43 44 4.0985 .3190 44 years and over 46 4.2754 .2487
Interaction Quality
Between 16-22 120 3.5317 .8147 3.578 .007** Between 23-29 102 3.7804 .7167
Between 30-36 88 3.4386 .7245 Between 37-43 44 3.7545 .5191 44 years and over 46 3.4826 .7917
Outcome
Between 16-22 120 3.9650 .8364 2.758 .028 ⃰
Between 23-29 102 4.0745 .5943 Between 30-36 88 3.9295 .8954 Between 37-43 44 4.3455 .3694 44 years and over 46 4.0870 .7151
Table 3: Differentiation Status of Sample Group by Education Level in 2014-2015 and 2016-2017 Seasons in terms of Dimensions of Scale of Event Quality for Spectator Sports
Old Stadium Dimensions
Education Level n X Sd. F p
Interaction Quality
Primary and Secondary Education 214 2.2813 .6922
9.352 .001 ⃰ ⃰ Associate / Bachelor’s 233 2.5983 .8269
Master’s Degree 44 2.3854 .69158
Outcome
Primary and Secondary Education 214 3.8589 .6939
4.555 .001 ⃰ ⃰ Associate/Bachelor 233 3.6712 .7345
Master 44 3.9024 .7295
Table 4: Differentiation Status of Sample Group by Occupation in 2014-2015 and 2016-2017 Seasons in terms of Dimensions of Scale of Event Quality
Old Stadium Dimensions
Occupation N X Sd. F p
Interaction Quality
Worker 88 2.1569 .5928
4.751 .001 ⃰ ⃰ Civil Servant 27 2.1630 .6703
Retired 28 2.5786 .8207
Student 270 2.5252 .8353
Self-employment 75 2.5120 .7872 New Stadium
Dimensions
Occupation N X Sd. F p
Environment
Worker 74 4.1011 .3569
2.606 .035* Civil Servant 40 4.0778 .4799
Retired 53 4.2036 .4233
Student 139 4.1956 .4881
Self-employment 94 4.0053 .5341
According to Table 4, in terms of event quality, retired individuals in both the old and new stadiums had more favorable opinions than other groups about the interaction quality and environment dimensions.
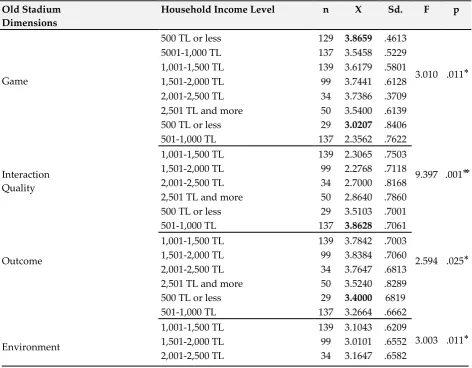
Table 5: Differentiation Status of Sample Group by Income Level in 2014-2015 and 2016-2017 Seasons in terms of Dimensions of Scale of Event Quality
Old Stadium Dimensions
Household Income Level n X Sd. F p
Game
500 TL or less 129 3.8659 .4613
3.010 .011 ⃰ 5001-1,000 TL 137 3.5458 .5229
1,001-1,500 TL 139 3.6179 .5801 1,501-2,000 TL 99 3.7441 .6128 2,001-2,500 TL 34 3.7386 .3709 2,501 TL and more 50 3.5400 .6139
Interaction Quality
500 TL or less 29 3.0207 .8406
9.397 .001 ⃰ ⃰ 501-1,000 TL 137 2.3562 .7622
1,001-1,500 TL 139 2.3065 .7503 1,501-2,000 TL 99 2.2768 .7118 2,001-2,500 TL 34 2.7000 .8168 2,501 TL and more 50 2.8640 .7860
Outcome
500 TL or less 29 3.5103 .7001
2.594 .025 ⃰ 501-1,000 TL 137 3.8628 .7061
1,001-1,500 TL 139 3.7842 .7003 1,501-2,000 TL 99 3.8384 .7060 2,001-2,500 TL 34 3.7647 .6813 2,501 TL and more 50 3.5240 .8289
Environment
500 TL or less 29 3.4000 6819
3.003 .011 ⃰ 501-1,000 TL 137 3.2664 .6662
2,501 TL and more 50 3.0140 .8516 New Stadium
Dimensions
Household Income Level n X Sd. F P
Game
500 TL or less 55 4.0667 .3682
3.632 .003** 5001-1,000 TL 140 4.1508 .2827
1,001-1,500 TL 107 4.2285 .2720 1,501-2,000 TL 43 4.1938 .2818 2,001-2,500 TL 27 4.2840 .2692 2,501 TL and more 28 4.0100 .2235
Outcome
500 TL or less 55 3.7673 1.0123
2.409 .036 ⃰
501-1,000 TL 140 4.0771 .6354
1,001-1,500 TL 107 4.0280 .7409 1,501-2,000 TL 43 4.1860 .5974 2,001-2,500 TL 27 4.2667 .4367 2,501 TL and more 28 3.8871 1.0073
Environment
500 TL or less 55 4.2119 5762
5.399 .001**
501-1,000 TL 140 4.4579 .3664
1,001-1,500 TL 107 4.3075 .4848 1,501-2,000 TL 43 4.4093 .4363 2,001-2,500 TL 27 4.4296 .2743
2,501 TL and more 28 3.7900 .6702
When Table 5 is examined, according to the household income level of the sample group in the old stadium, the perception of event quality had a difference in game, interaction quality, outcome and environment dimensions. In the other dimensions except the interaction quality, individuals with an income of 500 TL or less showed difference. The differences in the perception of event quality according to the household income level of the sampling group in the new stadium were shown in the game, outcome and environment dimensions. Those with an income of 2001-2500 TL showed a difference in the game and outcome dimensions and those with an income level of 501-1000 TL showed a difference in the environment dimension. The following brief summary may be informative in order to better understand the differences in the perceptions of event quality of the Eskisehirspor competitions of the sample group in the old and new stadiums in terms of the demographic characteristics.
2014-2015 Season: Old Stadium
Differences were found in terms of gender, interaction quality (female) and
outcome (male)
In terms of age, outcome (23-29)
In terms of education, interaction quality (associate / Bachelor’s) and outcome
(master)
In terms of occupation, interaction quality (retired)
In terms of income level, game (500 TL and below), interaction (500 TL and
2016-2017 Season: New Stadium
Differences were found in terms of gender, service augmentation (female),
interaction quality (female) and outcome (female)
In terms of age, game (44 and above), interaction (23-29) and outcome (37-43)
There was no difference in terms of education level.
In terms of occupation, environment (retired)
In terms of income level, game (2001-2500 TL), outcome (2001-2500 TL) and the
environment (501-1000 TL) according to income.
3. Discussion
It has been determined that in terms of the findings obtained within the scope of the research, there is a positive improvement in the event quality of the old and the new stadiums in general terms. However, improvement in the event quality was not at the expected level. The question to be asked at this point is: “What are can be done in order to raise the level of event quality in the new stadium to a higher level?” In the discussion section of the study, the findings obtained based on these problems were interpreted and recommendations were made to increase the event quality of Eskisehirspor stadium, which is one of the stadiums in Turkey that is currently a candidate for EURO 2024.
stadium can be said to have overcome the dissatisfaction of women with the old stadium.
It can be said that those who were in 23-29 age group were more satisfied with the quality of event in the old stadium than the other age groups, because this group had a higher average than other related age groups. Mankongvanichkul (2010) stated that young customers have less experience in service and that it is difficult for them to compare services with their past experiences. As a result, they are more satisfied with the service than adults. This may be the reason why young customers have a higher average than adults in the outcome dimension of event services, according to findings from the research. In the new stadium, the number of dimensions and age groups showing a difference increased. Considering the averages, this indicates that the new stadium was able to provide an adequate service quality to different age groups. When the total number of samples was taken into consideration, it was seen that a very large part of the audience was less than 36 years old. Therefore, more emphasis should be given to the diversity of activities, facility and equipment quality and the courtesy shown by the personnel as stated by Mikulic and Prebezac (2011), so that the needs of these consumers in the young age group can be met at a high level. Moreover, it should not be forgotten that the competition, atmosphere created by the facility, other consumers and other concessions sold during the event also affects quality of service (Kelley & Turley, 2001).
It has been noted that educational level has an influence on the perception of service quality and that people with a higher level of education have an expectation of a higher service quality (Chow et al. 2007; Kumari & Rani 2011). Individuals with a Bachelor’s and Master’s degree had the highest average in interaction and outcome quality in the old stadium. This result is consistent with the statements of Chow et al. (2007) and Kumari and Rani (2011). However, as stated earlier, the averages are not at a high level. In the new stadium, there was no difference with regard to the level of education. This result suggests that the expectations of the individuals with high levels of education as regards the new stadium were not fully met. This is because, considering the average scores regarding the new stadium, it seems that the level of perception of event quality should be higher. Ko and Pastore (2005) stated that the most important dimension in terms of increasing service quality is the physical environment. They recommend large and small innovations to improve the atmosphere and design of a facility. Environmental quality can affect customers’ cognitive and emotional situations and purchasing behavior (Donovan & Rossiter, 1982; Wakefield et al., 1996), because most of the services experienced by consumers in a physical facility are produced and consumed at the same time (Bitner, 1992). During sports services, the sports facility is at the center of customers’ service experiences (Westerbeek, 2000).
Understanding the differences between individuals helps organizations to develop better strategies and design service quality for professional groups (Landrum et al., 2010).
The average annual household income in Turkey was 19,139 TL in 2017 (TUIK, 2018). Hence, the income levels of the groups that showed differences between the old and new stadium were low. Scott and Shieff (1993) stated that customers with different income levels have different perceptions of service quality. Lim et al. (2008) stated that individuals with high income levels also have higher education levels. In relation to this situation, individuals with high levels of income tend to ask more questions during the process of acquiring information before making a decision. Therefore, spectators with a high level of income may perceive the quality of the activity differently than those with low income levels and may not be satisfied with the quality of the service provided. The event quality in the old and the new stadium may have satisfied individuals with low income levels. However, it should be noted that all income groups should be highly satisfied with the service provided. Holton (2004) stated that individuals with high income levels want to be served by service providers who are expert, proactive and satisfy their needs, and also indicated that those with high incomes are looking for quality in service interaction. These statements are similar to findings of this study, because the findings show that the higher the income level, the lower the average. Ko and Pastore (2005) found that the attitudes, behaviors and experiences of employees in their activities had an influence on the consumer's service quality evaluations. The consumer’s perception of the quality of a service is also influenced by the attitudes and behaviors of other consumers. This social process is often found in sports services where consumers have high degree of interaction (Ko & Pastore, 2005). This means that the new stadium employees should be more effective in interacting with the audience and meeting the needs of the audience.
6. Conclusion
When the findings of the research are examined in general terms, in all dimensions where the differentiation occurs, the averages were at “I partially agree” and at a lower level in the old stadium, whereas in the new stadium, averages were at “I partially agree” and “I agree” level. These results can be interpreted as a sign that the quality of the events in the old stadium where Eskisehirspor played in the 2014-2015 season did not meet the high quality required by the audience. The result that the new stadium increased average scores for the perception of the event quality was expected
retired individuals. The group with a higher average, in terms of a difference in the perceived event quality in terms of the household income level, consisted mostly of those with a low income level.
6.1 Recommendations
The findings of this study have produced significant results for sports managers. Thanks to the scale used in the research, managers can provide analytical information on the spectators’ perception of the event quality. More specifically, the five dimensions of the scale (game quality, augmented service quality, interaction quality, physical environment quality and outcome quality) can be used to identify potential problem areas in event operations and thus become a reliable source of information for future improvement of services. The study is very important for managers who want to increase the satisfaction and loyalty of the audience through understanding the operational strengths and weaknesses of events and who want to provide the products and services both within and outside of the field. Managers have to constantly gather information if they want to adapt to an intensely competitive marketplace and their expectations and wishes change rapidly with developing technology. Therefore, it is suggested that information should be gathered from consumers with different demographic characteristics and the quality of services provided at events be monitored.
References
1. Aslan M, Koçak MS, 2011. Determination of the Service Quality among Sport and
Fitness Centers of the Selected Universities. International Journal of Human Sciences 8(2): 817-833.
2. Bitner MJ, 1992. Servicescapes: The Impact of Physical Surroundings on
Customers and Employees. Journal of Marketing 56 (2): 57-71.
3. Chow IH, Lau VP, Lo TW, Sha Z, Yun H, 2007. Service Quality in Restaurant
Operations in China: Decision-And Experiential-Oriented Perspectives. International Journal of Hospitality Management 26(3): 698-710.
4. Dale B, Iwaarden JV, Wiele TVD, Williams R, 2005. Service Improvements in a
Sports Environment: A Study of Spectator Attendance. Managing Service Quality. 15(5): 470-84.
5. Donovan RJ, Rossiter JR, 1982. Store Atmosphere: An Environmental Psychology
Approach. Journal of Retailing, (58): 34-57.
6. Gencer RT. 2011. The Relationship between Team Identification and Service
Quality Perceptions in Professional Football. African Journal of Business Management 5(6): 2140-2150.
7. Getz D, O’Neill M, Carlsen J, 2001. Service Quality Evaluation at Events through
8. Greenwell TC, Fink JS, Pastore DL, 2002. Assessing the Influence of the Physical Sports Facility on Customer Satisfaction within the Context of the Service Experience. Sport Management Review 5(2): 129-148.
9. Holton L, 2004. The rich are different. ABA Journal. 85-90.
10. Howard DR, Crompton JL, 2004. Financing Sport, 2nd ed., Morgantown: Fitness Information Technology.
11. Kelley SW, Turley LW, 2001. Consumer Perceptions of Service Quality Attributes at Sporting Events. Journal of Business Research54 (2): 161-6.
12. Koo G, Hardin R, McClung S, Jung T, Cronin J. Vorhees, C, Bourdeau, B, 2009. Examination of the Casual Effects between the Dimensions of Service Quality and Spectator Satisfaction in Minor League Baseball. International Journal of Sports Marketing & Sponsorship 11(1): 46-59.
13. Ko JY, Pastore DL. 2005. A Hierarchical Model of Service Quality for the Recreational Sport Industry. Sport Marketing Quarterly14: 84-97.
14. Ko JY, Zhang J, Cattani K, Pastore D, 2011. Assessment of Event Quality in Major Spectator Sports. Managing Service Quality, 21(3): 304-322.
15.Kuenzel S, Yassim M, 2007. The Effect of Joy on the Behavior of Cricket
Spectators: The Mediating Role of Satisfaction. Managing Leisure 12(1): 43-57. 16. Kumari HV, Rani SS, 2011. Customer Perception of Services Quality in the
Retail-Banking Sector. European Journal of Business and Management 3(3): 299-306. 17. Landrum H, Prybutok VR, Zhang X, 2010. The moderating effect of occupation
on the perception of information services quality and success. Computers & Industrial Engineering 58: 133-142.
18. Lim CG, Bennett RR, Dagger T, 2008. The Impact of Service Contact Type and Demographic Characteristics on Service Quality Perceptions. Journal of Services Marketing 22 (7): 550-561.
19. Liu YD, Taylor P, Shibli S, 2009. Measuring Customer Service Quality of English Public Sport Facilities. International Journal of Sport Management and Marketing 6(3): 229- 252.
20. Mankongvanichkul, W, 2010. Passenger satisfaction with service quality: a case study of thai airways international’s domestic flights. Master Thesis. Srinakharinwirot University.
21. McDonald MA, Sutton WA, Milne GR, 1995. TEAMQUAL: Measuring Service Quality in Professional Team Sports. Sport Marketing Quarterly 4(1): 9-15.
22. Mikulic J, Prebezac D, 2011. Evaluating Hotel Animation Programs at Mediterranean Sun-And-Sea Resorts: An Impact-Asymmetry Analysis. Tourism Management (32): 688-696.
23.Scott D, Shieff D, 1993. Service Quality Components and Group Criteria in Local
Government. International Journal of Service Industry Management 4 (4): 42-53. 24. Shilbury D, 1994. Delivering Quality Service in Professional Sport. Sport
Marketing Quarterly 3(1): 29-35.
26. Theodorakis N, Alexandris K, Rodrigues PMM, Sarmento PJ, 2004. Measuring Customer Satisfaction in the Context of Health Clubs in Portugal. International Sports Journal 8; 44-53.
27. Theodorakis N, Kambitsis C, Laios A, 2001. Relationship between Measures of Service Quality and Satisfaction of Spectators in Professional Sports. Managing Service Quality: An International Journal 11(6): 431-438.
28. Tsittskari E, Tsiotras D, Tsiotras G, 2006. Measuring Service Quality in Sport Services. Totaly Quality Management and Business Excellence 17 (5): 623-631. 29. Tsuji Y, Bennett G, Zhang J, 2007. Consumer Satisfaction with an Action Sports
Event. Sport Marketing Quarterly 16 (4): 199–208.
30. tuik.gov.tr (Internet). TUIK: Turkiye Istatistik Kurumu; c2018 (cited 2018 Mar
09). Available from: www.tuik.gov.tr.
31. Wakefield KL, Blodgett JG, Sloan HJ, 1996. Measurement and Management of the Sportscape. Journal of Sports Management 10 (3): 15-31.
32. Westerbeek HM, Shilbury D, 2003. A Conceptual Model for Sport Services Marketing Research: Integrating Quality, Value and Satisfaction. International Journal of Sports Marketing and Sponsorship 5(1): 3-23.
33. Westerbeek HM, 2000. The Influence of Frequency of Attendance and Age on Place-Specific Dimensions of Service Quality at Australian Rules Football Matches. Sport Marketing Quarterly 9 (4): 194-202.
34. Yildiz, SM, 2012. Instruments for Measuring Service Quality in Sport and Physical Activity Services. Collegium Antropologicum 36(2): 689-696.
35. Yoshida M, James JD, 2010. Customer Satisfaction with Games and Service Experiences: Antecedents and Consequences. Journal of Sport Management 24(3): 338-361.
Creative Commons licensing terms