ISSN: 2347-7474
International Journal Advances in Social Science and Humanities
Available online at: www.ijassh.com
RESEARCH ARTICLE
Job Satisfaction among Library and Information Science Faculty
Members in Annamalai University, Tamilnadu: A Survey
Vijayakumar K*
Dept. of LIS, Annamalai University, Chidambaram, Tamilnadu, India.
*Corresponding Author: Email: [email protected]
Abstract
This work investigates the Job Satisfaction of LIS faculty members of Annamalai University pertaining the motivation among LIS teaching professionals and progress in renovating their knowledge. However a deep analysis has been made to know the strength of LIS faculty members based on their age, gender, caste, religion etc., Based on the survey assessment, the suggestions has been incorporated, according to the job satisfaction. Job Satisfaction refers to the feelings and emotional aspects experienced by the individual towards their jobs which act as a motivation to work. Job satisfaction questionnaires were used to measure the seven demographic components (Age, Sex, Caste, Religion, Education, Qualification, Economic status) comprised of 29 questions. A detailed data analysis and interpretation have been made and the performance is evaluated.
Keywords: Annamalai University, Job Satisfaction, LIS faculty members.
Introduction
Numerous contributions have been made in India in which number of countries has drawn attention to the job satisfaction and motivation among LIS faculty members. Job satisfaction is a primary requisite for any successful teaching and learning process. It is a complex phenomenon that involves various personal, institutional and social aspects. The faculty members will be in a position to fulfill the educational objectives and national goals if only they conquer the adequate job satisfaction. A survey has been made for recognizing the job satisfaction among university faculty members. Job satisfaction refers to the impression a person has of his career. There are many contributing factors and causes of job satisfaction that can be categorized as internal aspects (personality traits, feelings and emotions) and external aspects (organizational, social and cultural conditions and characteristics).
Definition
The term ‘Job Satisfaction’ is derived from the latin work ‘SATIS’ and ‘FACERE’ which means ‘ENOUGH’ and ‘TO DO’ respectively.
Related Work
Various contributions have been made and implemented in literature regarding job satisfaction. The term was brought to limelight by
Hoppock [1] who reviewed 32 studies on job satisfaction conducted prior to 1933 and observed that job satisfaction is a combination of psychological, physiological and environmental circumstances that cause a person to say, "I am satisfied with my job". Such a description indicates the variety of variables that influence job satisfaction but tell us nothing about its nature. Locke [2,3] defined job satisfaction as "a pleasurable or positive emotional state resulting from the appraisal of one's job or job experiences". In simple terms, job satisfaction explains what makes people want to come to work. What makes them happy about their job or not to quit their job? Job satisfaction shows employees emotional state of mind that reflects effective reaction to the job and work conditions [4]. Insufficiency of teaching materials like appropriate books for all subjects that are being taught has been a major challenge facing teachers in both rural and urban areas [5-6].
Objectives
The following objectives are progressed for the purpose of the present study
To understand the sex wise and age wise strength of LIS faculty members
To understand caste wise category groups in LIS profession
To identify the various types of religions the teachers belongs to
To and know the educational qualification and their association with Professional bodies To Know the economic status and educational
developments
Methodology
The researcher has employed a well-structured questionnaire for collecting the data from the LIS faculty members of Annamalai University. The questionnaire has been prepared in such a way that the respondents could easily understand the items. A total number of 40 questionnaires were distributed among the faculty members. They are
personally requested to fill up the questionnaire at their earliest convenience in order to help the investigator to collect the same during his/her next visit. The investigator has to make second, third and fourth visits to collect the filled in questionnaires. During these visits, the investigator could collect the questionnaires from only 26 out of 40 faculty members among whom the questionnaires were distributed. This constitutes 65% of the total response. While selecting samples satisfaction method has been adopted with a view to the respondents of different categories.
Data Analysis and Interpretation
Table 1 shows that the majority of the Male LIS faculty members leads by 69% and 31% were occupied by the female LIS faculty members. From the experimental results it is observed that the male respondents occupies the highest percentage compared to female respondents.
Table 1: Sex- wise distribution of respondents
S. No Sex No. of Respondents Percentage
1 Male 18 69.05
2 Female 08 30.95
Total 26 100
Fig.1: Performance of sex-wise distribution
Table 2: Age - wise distribution of respondents
S. No Age No. of Respondents Percentage
1 25- 35 12 46.15
2 35- 45 06 23.08
3 45- 55 05 19.24
4 56 & Above 03 11.53
Total 26 100
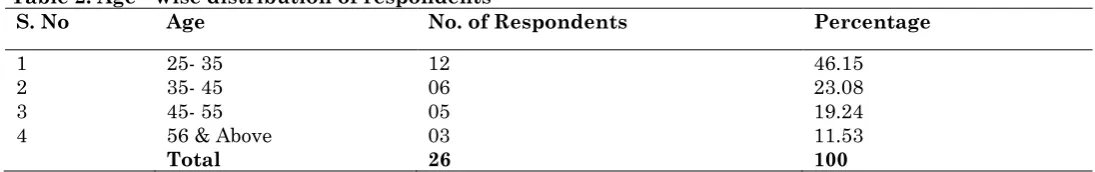
Table 2 illustrates that the number of respondents in between the age groups of 25-35 occupies the dominant place by 46.15%. Similarly the subsequent 23.07% is occupied by the age
Table 3: Caste - wise distribution of respondents
S. No Caste No. of Respondents Percentage
1 OC 17 65.38
2 SC/ ST 06 23.08
3 MBC 03 11.54
4 OTHERS 00 00
Total 26 100
Table 3 demonstrates that 17 respondents of 65.38% were employed by the Other Community faculty members followed by the SC/ ST faculty members of 6 with 23.08%. Rest of the 3 faculty
members of 11.54% were Most Backward Community faculty members. It is concluded that majority of the faculty members are from Other Communities.
Table 4: Religion - wise distribution of respondents
S. No Religion No. of Respondents Percentage
1 Hindu 25 96.15
2 Christian 00 00
3 Muslim 01 03.85
4 Others 00 00
Total 26 100
Table 4 determines that 25 respondents of 96.15%
are Hindus followed by 1 respondent of 3.85% is a Muslim. From the above it is clearly observed that the majority of the respondents are Hindus.
Table 5: Educational qualification
S. No Educational Qualification No. of Respondents Percentage
1 B.LIS 20 76.92
2 M.Lib. Sci/ M.LIS 26 100
3 M.Phil 20 76.92
4 Ph.D 25 96.15
OTHER 05 19.23
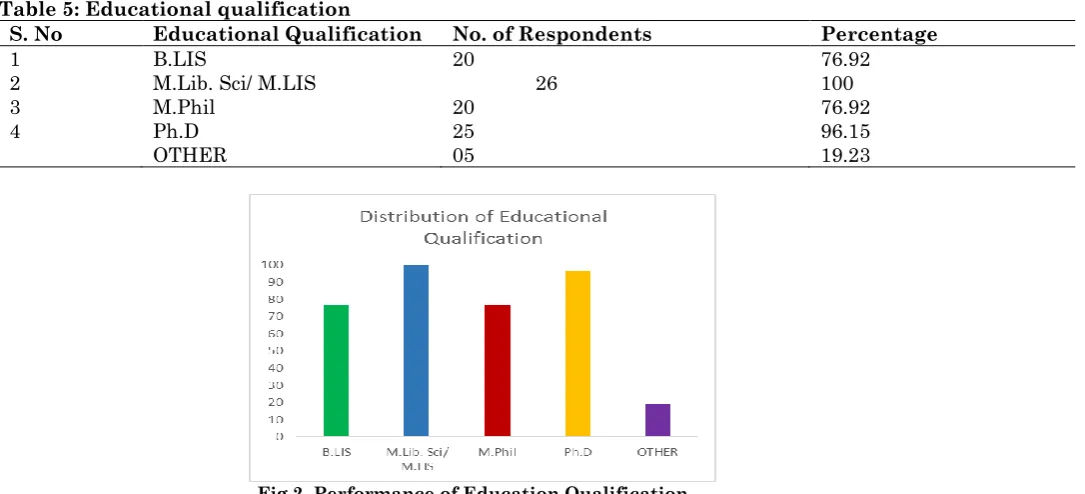
Fig.2. Performance of Education Qualification
Table 5 illustrates that 20 respondents of 76.92% are BLIS degree holders, 26 respondents of 100% are MLib.Sci./MLIS degree holders, 20 respondents of 76.92% are M.Phil degree holders,
25 respondents of 96.15% are Doctorate degree holders and the 5 respondents of 19.23% are other degree holders like PGDCA, PGDLAN etc.,
Table 6: Distribution of Respondents in Professional Bodies
S. No Professional Bodies No. of Respondents Percentage
1 IATLIS 05 19.23
2 IASLIC 08 30.76
3 ILA 10 38.46
4 OTHERS 08 30.76
It is evident from table 6 that most of the faculty members were associated with IATLIS of 19.23%, IASLIC of 30.76%, ILA of 38.46% and other
Table 7: Distribution of economic reason of respondents
S. No Economic Reason No. of
Respondents Percentage
1 To fulfill the Basic minimum needs of Life 16 61.53
2 To supplement of the income of the Principal earners 00 00 3 To support the demands after the death of the breadwinner 00 00
4 To secure higher standard of living 05 19.24
5 To fulfill the desire for economic dependence 02 07.69
6 Other reasons if any 03 11.54
Total 26 100
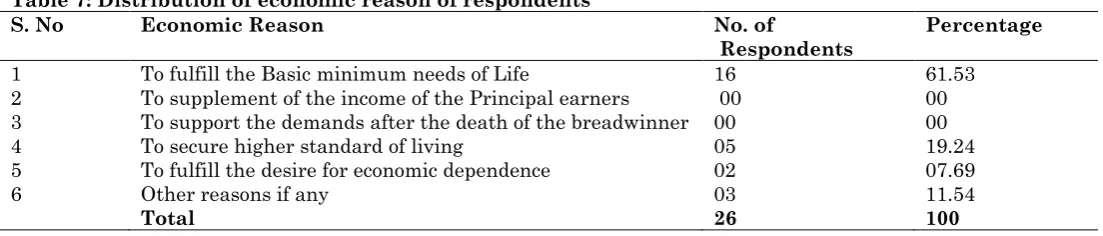
Table 7 investigates that out of 26 faculty members16 are chosen their career as a teaching faculty to fulfill the basic minimum needs of their life and they represents 61.53 of total. 5 faculty members of 19.24% have chosen their career to secure higher standard of living. 3 faculty members of 11.54% have chosen their career for other reasons. Only two faculty members of 7.69% have chosen their career to fulfill the desire for economic dependence. For the above table it is clearly defined that majority of the members have chosen their career to fulfill the basic minimum needs of their life [7].
Suggestions
Dedicated involvement in academic activities and it should be in competitive nature. More autonomy should be given to the teaching departments. Regular one week or 15 days training programmes on latest technological facilities must be made available to faculty members at the computer lab should developed with higher machine facilities.
Government should concentrate more on inter- university faculty exchange programmes. It should implement uniform syllabus in all Universities and the semester system should be removed.
Proper motivation, good supervisor, incentives, promotional opportunities to update the latest developments with the help of orientations, training, workshop programmes and seminar/conferences should be organised frequently in every academic year.
Association and organization related to the profession has to conduct more workshops to cope up with the latest trends of ICT.
The Government ensure reasonable salary/ incentives, proper promotional opportunities from either side.
These suggestions will be more helpful for the faculty members to equip themselves in their teaching environment [8,9].
Conclusion
Job Satisfaction refers to the feelings and emotional aspects experienced by the individual towards their jobs which act as a motivation to work. Job satisfaction questionnaires were used to measure the seven demographic components (Age, Sex, Caste, Religion, Education, Qualification, Economic status) comprised of 29 questions. From the study of Job satisfaction among LIS faculty members it is observed that the job satisfaction is relatively good. From the experimental results it is observed that the male respondents occupies the highest percentage compared to female respondents, the number of respondents in between the age groups of 25-35 occupies the dominant place by 46.15%, the majority of the faculty members are from Other Communities (OC), the majority of the respondents are Hindus, 26 respondents of 100% are M.Lib.Sci./MLIS degree holders, the respondents with ILA professional body occupies the dominant position and it is clearly defined that majority of the members have chosen their career to fulfill the basic minimum needs of their life. Positive attitude towards the job is conceptually equivalent to job satisfaction.
References
1. HoppockR (1935) On Job Satisfaction, New York. p. 20-21.
2. Locke Edwin A (1969)What is job satisfaction.
Organizational Behavior and Human Performance, 4(4):309-336.
3. Locke E (1976) The nature and causes of job
satisfaction. In M. D. Dunnette (Ed.).Handbook of industrial and organizational psychology (1297-1349). Chicago: Rand McNally.
Human Resource Management Centre for Graduate Studies Open University Malaysia.
5. Nyirenda, Masozi (2013) Has politics affected our
education system? (Online)
Available:http://www.ippmedia.com/frontend/?l=546 32 (May, 13 2013).
6. Zombe Gervas -Who is a teacher? Quality teachers for quality education (online). Available:http://hakielimu.org/files/publications/doc ument130WHO%20IS%20A%20TEACHER_R.pdf
7. Balachander KK (1980) Higher Education India: Quest for an Alternate Financing System, University News, 30(5):57-59.
8. Shafi Abadi A (1998) Professional advice and career choice theories, Tehran: Roshd Publication,