Abstract
Malaria has been shown to strongly predispose patients in areas of malaria endemicity to bacteremia with severe outcomes, thus justifying the use of antibiotics in combination with antimalarial therapy in patients with severe malaria. This study describes a High-Performance Liquid Chromatographic (HPLC) method for simultaneous determinations of Ciprofloxacin (CPN), Quinine (QN), and its major metabolite, 3-Hydroxyquinine (3-HQN), in human plasma. Following a simple precipitation with acetonitrile, chromatographic separation was achieved on a reversed-phase Agilent Zorbax (CN) column (5 µm, 150 X 4.6 mm i.d) using a mobile phase consisting of acetonitrile: potassium dihydrogen phosphate (pH = 2.8; 0.02 M) (42:58, v/v). Retention times for CPN, 3-HQN, IS and QN were 2.7, 3.3, 3.6 and 4.9 minutes respectively. The limits of detection and validated lower limits of quantitation were 30 and 70 ng/ml for both QN and 3-HQN while the corresponding values were 50 and 100 ng/ml for CPN, respectively. The new HPLC method here developed, when compared with previous methods for the analysis of either or both drugs is simple, rapid, selective, reproducible and cost-effective. It is also suitable for conducting a simultaneous therapeutic monitoring of quinine and ciprofloxacin in patients when concomittantly administered as demonstrated in five healthy volunteers.
*Author for correspondence
Simultaneous Quantification of Ciprofloxacin,
Quinine and 3-hyrdoxyquinine in Human
Plasma using a HPLC Method
Adebanjo J. Adegbola, Julius O. Soyinka
*and Babatunde A. Adeagbo
Department of Pharmaceutical Chemistry, Faculty of Pharmacy, Obafemi Awolowo University, Ile-Ife, Nigeria; [email protected]
1. Introduction
Co-morbidity of malarial and bacterial infections is a common phenomenon in the world today particularly in the tropics. WHO malaria report for year 2014 revealed that up to 198 million cases of malaria were reported in 2013 and out of this, the death toll was up to 584,0001. Similarly, bacterial infections are ravaging in this same region since a large number of hospital visits results from bacterial infections. A study in Kenya provided evidence that Plasmodium falciparum infection increases the risk for bacteraemia, particularly for gram-negative invasive infections2,3. Co-morbidity of malaria and
bacterial infections could warrant co-administration of antimalarial and antibacterial drugs.
Ciprofloxacin (CPN) is a fluoroquinolone often pre-scribes especially for lower respiratory tract infections probably because of its good tissue penetration and safety profile, and a broad spectrum of action that cov-ers a number of clinically important pathogens, especially Gram-negative bacteria including Pseudomonas aerugi-nosa, against which very few effective oral antibiotics are available5. The use of CPN in paediatrics has been limited due to the fear that it caused arthropathy in weight-bear-ing joint of juvenile animals. However, a recent review depicted that different investigators have used CPN in paediatric patients and the general experience is that it is safe and effective in children also6.
Cinchonism and cardiac arrhythmias are common toxicity of QN therapy and this toxicity may be connected with the plasma concentration of the drug. In the same vein, cardiac arrhythmias and arthropathy are postulated to be associated with quinolones administration. Thus, there may be increased manifestations of these toxicities in a circumstance where CPN and QN are to be adminis-tered concurrently. This is adduced to the fact that toxicity is related to the drugs exposure in the plasma. In order to achieve a good clinical outcome particularly in paediat-rics, therapeutic drug monitoring of the plasma levels of QN and CPN when they are co-administered will be of great benefit. This will help to adjust the dosage regimens of the drugs appropriately in order to meet the therapeu-tic targets or needs without or with minimal unpleasant effects.
In severe P.falciparum malaria, a peak plasma quinine level of 10–15 µg/ml was recommended for effective para-site clearance and tolerable side effects, although, these levels were reported as toxic in non-malaria subjects7. Also, monitoring the plasma levels of 3-HQN along with QN is necessary since this major metabolite is reported to have a higher toxicity than QN, but much less potent as an antimalarial8. To conduct a successful therapeutic drug monitoring, a suitable simple, rapid and cost-effective analytical procedure to quantify the analytes, is of para-mount important.
A number of bioassay techniques have been described in literatures to quantify CPN and QN separately from biological fluids. For instance HPLC determination of quinine with UV detector developed by Babalola et al and Soyinka et al9,10, HPLC with fluorescence to detect quinine by Wanwimolruk et al and Mirghani et al11,12. Similarly, a number of HPLC methods have been described for deter-mination of ciprofloxacin in biological samples but some
of them are limited in application owing to the long run time, requirement for large plasma volume and cum-bersome extraction procedure13–16. In addition to all of these shortcomings, to our knowledge, an assay method to determine both QN and CPN simultaneously in the plasma has not been described. Thus, the objective of this study is to develop and validate a modest, easily operable and reliable HPLC method for the concurrent quantifica-tions of QN, CPN and 3-HQN in human plasma.
2. Experimental
2.1 Chemical and Reagents
Ciprofloxacin (Cyplox® from Medreich, Pharmaceutical Company) and quinine tablets (Quinmax®) were purchased locally from a retail pharmacy outlet. Ciprofloxacin hydrochloride (Figure 1) was sourced from AK Scientific Inc. Union City (USA) while quinine sul-phate (Figure 1) was purchased from BDH chemicals (Poole, UK). 3-Hydroxyquinine (Figure 1) was donated by Prof. James M. Cook, University of Wisconsin, USA. Acetonitrile (HPLC grades), potassium dihydrogen phosphate (analar grade) and hydrochloric acid were all purchased from Sigma–Aldrich Chemicals (Steinheim, Germany). Perchloric acid (Hopkins and Williams, Essex, UK) was of analar grade. Pyrimethamine was obtained from Swiss Pharma Nig Ltd.
2.2 Instrumentation
The chromatographic system consisted of an Agilent 1100 series liquid chromatography (Agilent technologies, Palm alto, USA) using a reversed-phase Agilent Zorbax Cyano (CN) column (5 µm, 150 X 4.6 mm i.d) fitted with a quaternary pump and a Diode array UV detector (DAD, 190-900 nm). DAD was connected to a computer and the signals were recorded therein as chromatograms. Sample injection was through a Rheodyne model 7725 valve (California; USA) fitted with a 20 µl loop. Vortex mixer (Gallenkamp, London, UK) and centrifuge (Gallenkamp) were used in the extraction procedure.
2.3 Chromatographic Conditions
solutions of ciprofloxacin, quinine and its metabolite. 250 µL of drug-free plasma samples were spiked with 50 µL of internal standard solution (10 µg/mL pyrimethamine) and standard solutions (between the range of 0.05 –10 µg/mL) of ciprofloxacin, quinine and its metabolite. To each sample, acetonitrile was added to make up to one-mL and the samples were sequentially vortex-mixed and centrifuged for 1 and 5 minutes respectively and the supernatant (20 µl) was injected into HPLC column. The Peak Area Ratios (PAR) were generated from the ratio of response (peak area) of the analytes to that of the inter-nal standard. A plot of PARs versus concentrations of the standard solutions was done.
2.7 Recovery, Accuracy and Precision
Studies
Blank plasma samples were spiked with standard solutions of ciprofloxacin, quinine and 3-hydroxyquinine to yield concentrations of 0.5, 5.0 and 10.0 µg/ml for ciprofloxacin and quinine and 0.2, 2.0 and 10.0 µg/ml for 3-hydroxyquinine. Then, the samples were taken through extraction procedure. The absolute recovery, expressed as percentage, was determined by comparing the PAR obtained from the extracted samples with the neat injection of reference samples of the same concentration. The PAR was converted to concentration using calibration curves for each of the analytes. Accuracy of the analytical method for 0.02 M) pH was adjusted with a few drops of 60% v/v
per-chloric acid (42:58 v/v) and the effluent was monitored by UV detection at 254 nm for quinine and 3-hydroxy-quinine and 275 nm for ciprofloxacin. The buffer solution was filtered through 0.45μm membrane filter. The mobile phase was pumped through the column at a flow rate of 1.0 mL/min and the injection volume was 20 μL.
2.4 Preparation of Stock Solution
1.0 mg/ml of quinine base, 3-hydroxyquinine and cipro-floxacin were prepared in 0.1 M hydrochloric acid and various concentrations of working solutions were pre-pared from the stock solutions
2.5 Sample Preparation and Extraction
Procedure
To 250 µl of plasma sample placed in a 2-ml eppendorf tube was added 50 µl of 10µg/mL pyrimethamine solu-tion (internal standard). 700 µl of acetonitrile was added and the content was vortex-mixed for 1 min and centri-fuged for 5 min at 3000 g. 20 µl of a clean supernatant was injected into HPLC column.
2.6 Calibration Curve
Calibration curves were constructed based on the rela-tionship between the peak area ratios and the standard
each of the three analytes was determined by the percentage ratio of the estimated concentrations to that of the actual concentrations of the reference standard prepared. Also the coefficients of variation of the estimated concentrations were determined and used for the assessment of precision.
2.8 Application of Analytical Method
Ethical clearance was sought and obtained from the Health Research Ethics Committee (HREC No: IPHOAU/12/124)), Institute of Public Health, Obafemi Awolowo University, Ile Ife. Five healthy volunteers with body weight ranging from 45 to 85 Kg (63.2 ± 14.5 Kg) and age ranging from 25 to 40 years, received 500 mg ciprofloxacin twice daily for one week and 600 mg qui-nine was administered to each of the volunteers as oral dose concurrently with 11th dose of ciprofloxacin. Then, venous blood samples were collected into EDTA bottles just before the concurrent drug administration and at 1, 2, 4, 6, 8, 12 and 24 hours after drug administration. The blood samples were centrifuged at 3000 x g for 5 min to obtain the plasma which was analysed for ciprofloxacin, quinine and 3-hydroxyquinine concentrations following the procedures described above. The maximum plasma drug concentration Cmax and Tmax were obtained by visual
inspection of the concentration–time data. The area under plasma concentration-time curve (AUC0-t) was computed using the log linear trapezoidal method where
t0 = 0 corresponded to C0 = 0 for QN and 3-HQN but this was considered as the trough for ciprofloxacin. AUC0-∞
was obtained from the sum of AUC0-t and Ct/Lz. Lz is the elimination rate constant obtained by linear regression analysis of the terminal phase of the curve.
3. Results
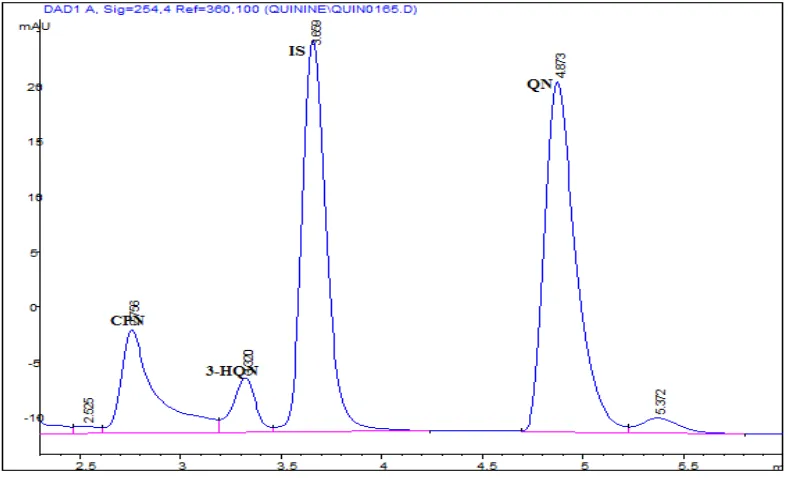
Sample chromatogram is shown in Figure 2 which rep-resents an output from the HPLC method described above. It clearly indicated that the peaks ascribed to QN, 3-HQN and CPN were well separated from one another and they were not in any way interfered with the endog-enous compounds. The retention times were 2.7, 3.3 and 4.9 minutes for CPN, 3-HQN and QN respectively and the run time was 7 minutes. The method was specific for these analytes because there was no interference with the peaks of compounds such as paracetamol, trimethoprim, sulphamethoxazole, proguanil and chlorpheniramine. The lowest detectable concentration or Limit of Detection (LOD) was taken as a concentration producing a peak
Figure 2. High-performance liquid chromatogram of extracted plasma sample obtained from a volunteer at 2 h following
of three times the baseline noise and this parameter was found to be 10 ng/ml for QN, 3-HQN and 40 ng/ml for CPN. The lowest concentrations of the analytes which are assayable with this method with an acceptable level of precision and accuracy1 were 30 ng/ml for QN and 3-HQN while that of CPN was 70 ng/ml. Linear curves were obtained for QN and 3-HQN in the plasma with correlation coefficients of 0.999 with the range of linear-ity between 50 ng/ml to 10,000 ng/ml while the linearlinear-ity for CPN is between 100 ng to 10,000 ng/ml. The results for the accuracy, recovery and precision for the drugs are indicated in Table 1. All the values for precision and accuracy were within the normal limits. The mean recov-ery for the three analytes were between 90.8 to 99.2 % at
a lower, a middle and higher concentration within the range of linearity.
The average plasma concentration-time profiles of QN, 3-HQN and CPN following concomitant adminis-tration of multiple doses of CPN (500mg 12 hourly for 1 week) and a single 600mg oral dose of quinine sulphate to each of seven volunteers are illustrated in Figure 3. The plasma exposure of ciprofloxacin was determined within a dosing interval of 12 hour after the 11th oral dose as this is acceptable measures for evaluation of pharmacokinet-ics of a drug when steady-state drug levels are reached in a multiple dose regimen. The derived pharmacoki-netic parameters for QN, 3-HQN and CPN are shown in Table 2.
Table 1. Precision, recovery and accuracy of the analytical method
Analytes N Concentration
(µg/ml) Intra-day precision (CV) (%) precision (CV) (%)Inter-day mean±S.D. (%)Accuracy mean±S.D. (%)Recovery
QN 6 0.5 3.3 6.0 94.7±5.7 96.7±4.6
6 5.0 4.9 4.4 96.3±4.3 94.6±4.6
6 10.0 1.5 2.3 101.2±2.3 95.9±3.3
3-HQN 6 0.5 7.7 3.2 94±3.0 92±7.4
6 5.0 3.9 2.6 98.0±2.6 93.6±4.2
6 10.0 3.6 2.9 98.7±2.9 95.3±3.9
CPN 6 0.5 5.6 11.6 98.2±7.2 99.2±4.5
6 5.0 6.1 10.2 102.9±10.5 90.8±11
6 10.0 6.1 3.1 99.3±4.5 99.2±3.6
Figure 3. Mean Plasma Concentration vs. time Profiles of Quinine (QN), 3-Hydroxyquinine (3-HQN) and Ciprofloxacin
4. Discussion
A simple protein precipitation applied in order to extract the analytes was efficient. A clear and clean supernatant from plasma was produced after a single step extraction with acetonitrile and there was no interference with the endogenous compounds. QN, 3-HQN and CPN were completely resolved to the baseline with a short run-time of 8 min. In this work, the retention run-times for CPN, 3-HQN and QN were 2.7, 3.3 and 4.9 minutes respec-tively. This offers an excellent efficiency in terms of the time it will require to work on both the extraction and chromatographic procedures. The method also requires low plasma volume of 250 µl compared with higher plasma volume used in other methods which makes it to be suitable for most patients particularly paediat-rics. Similarly, most other methods described for QN and CPN involved cumbersome liquid-liquid extrac-tion, whereas, a-step protein precipitation approach was adopted in this method which removed a more laborious extraction procedure. On this basis, the newly developed method has an edge of simplicity, rapidity and economical when compared to some of the previously developed HPLC methods to determine ciprofloxacin, quinine and its principal metabolite9–17. The percentage recovery and evidence of accuracy of over 90% for each of the analytes also lend credence to the effectiveness of this method. The composition of the mobile phase 52% acetonitrile and 48% 10 nm of potassium dihydrogen phosphate buffer also make the method very affordable to run.
Therapeutic drug monitoring (TDM) is suggested for ciprofloxacin where the ratio between the mini-mum inhibitory concentration (MIC) and the plasma concentration or area under concentration-time pro-file is considered as a predictor of its effectiveness19,20.
MIC is an index to measure or predict clinical efficacy of antibacterial and this factor depends on both the effective plasma concentration and the ability of the antibacterial to penetrate the site of infection19. Difficult-to-predict pharmacokinetics of ciprofloxacin can occur in critically-ill patients and because of this variability in pharmacokinetics; TDM may be of a great importance to avoid treatment failure and emergence of resistance19. For this purpose, sampling times that correspond with the trough and peak concentrations are usually con-sidered and both were measurable with this method. Accumulation of ciprofloxacin in the plasma or serum necessitate dose reduction whereas rapid clearance from the biological fluids may call for upward review of dos-age regimen. The ratio of AUC to MIC of 125 is usually considered for treatment of gram-negative organism. Similarly, Cmax- to-MIC ratio of 8-10 is considered as a surrogate value for effectiveness of ciprofloxacin. Clinicians may want to rely on this parameter in order to prevent exposure to excess plasma concentration especially in paediatrics where the risk of developing musculoskeletal toxicity is probable.
This method was applied to pharmacokinetic studies on ciprofloxacin and quinine after administrations of a single dose of 600 mg quinine and 11th 500 mg oral dose of ciprofloxacin to five healthy volunteers. The average area under the curve (AUC0-∞), Cmax, Tmax and half-life (t1/2) for ciprofloxacin are 22.1 µg/ml*hr, 3.6 µg/ml, 2 h and 5.7 h respectively. Ciprofloxacin pharmacokinetics is dose-dependent where the values for pharmacoki-netic parameters vary with doses. The values obtained from this study were comparable with the established figures15,17,19,21. Derived pharmacokinetic parameters har-vested for quinine after a single oraladministration in the presence of ciprofloxacin were 41.62 µg/ml*hr, 1.64 µg/ml, 3.5 h and 21.4 h for AUC, Cmax, Tmax and half-life (t1/2) respectively and a clearance of 16 L/h. There was a reduced clearance and prolonged t1/2 when the data were compared with the established figures22,23. Also the plasma exposure of 3-HQN was low when compare to literature values obtained from healthy volunteers. A recent report revealed that CPN is capable of inhibit-ing the metabolism of QN in healthy volunteers which resulted in about 39% increase in plasma concentration of QN24. CPN depresses the formation of 3-hydroxy-quinine (3-HQN) through the inhibition of cytochrome
Table 2. Some derived pharmacokinetic parameters for quinine, ciprofloxacin and 3-hydroxyquinine
PK parameters QN CPN 3-HQN
Cmax (µg/ml) 1.64 ± 0.11 3.6± 1.9 0.39 ± 0.06
Tmax (h) 3.5 ± 0.36 2.14± 1.34 4.92 ± 1.05
AUC(0-t) (μg/ml.h) 32.38 ± 2.85 22.14± 14.65 9.54 ± 1.22
AUC(0-∞) (μg/ml.h) 41.62 ± 4.04 29.17± 18.4 14.83 ± 2.04
P450 3A4 (CYP3A4). This is suggestive of metabolic interaction between quinine and ciprofloxacin. This type of interaction would result in increased QN plasma levels with associated toxicities
5. Conclusion
In conclusion, the HPLC method described is very sim-ple, reproducible, and rapid. The method is also accurate, selective and cost-effective. It will help in conducting either individual or simultaneous determination of qui-nine and ciprofloxacin for TDM pursuit based on their Cmax and AUC. It will also facilitate the monitoring of qui-nine metabolite.
6. Acknowledgement
This work was solely carried out within the facility of therapeutic drug monitoring unit of Obafemi Awolowo University Teaching Hospital/Faculty of Pharmacy.
7. References
1. WHO World Malaria Report. World Health Organisation. Geneva: 2014
2. Scott JA, Berkley JA, Mwangi I, Ochola L, et al. Relation between falciparum malaria and bacteraemia in Kenyan children; a population-based, case-control study and longi-tudinal study. Lancet. 2011; 378(9799):1316–23.
3. Were T, Davenport GC, Hittner JB, Ouma C, Vulule MJ, Ong’echa JM, Perkins DJ. Bacteremia in Kenyan children presenting with malaria. J Clin Microbiol. 2011; 49(2):671– 6.
4. Achan J, Ambrose OT, Erhart A, Yeka A, Tibenderana JK, Frederick NB, Rosenthal PJ, D’Alessandro U. Quinine, an old anti-malarial drug in a modern world: Role in the treatment of malaria. Malar J BMC. 2011. DOI: 0.1186/1475-2875-10-144
5. Evan JB, Richard AR, Daren AS, Graham GG, Buttimore RC, Neill AM, Town GI. The pharmacokinetics of oral fleroxacin and ciprofloxacin in plasma and sputum dur-ing acute and chronic dosdur-ing. Br J Clin Pharmacol. 2000; 49:32–8.
6. Adefurin A, Sammons H, Jacqz-Aigrain E, Choonara I. Systematic review Ciprofloxacin safety in paediatrics. Arch Dis Child (ADC). 2011. doi: 10.1136/adc.2010.208843.
7. Yeka A, James T, Jane A, Umberto DA, Talisuna AM. Efficacy of Quinine, Artemether-Lumefantrine and Dihydroartemisinin-Piperaquine as Rescue Treatment for Uncomplicated Malaria in Ugandan Children. PLOS ONE. 2013; 8(1):e53778.
9. Babalola CP, Bolaji OO, Dixon PA, Ogunbona FA. Column liquid chromatographic analysis of quinine in human plasma, saliva and urine. J Chromatogr.1993; 23:151–4. 10. Soyinka JO, Onyeji CO, Igbinoba SI. Simultaneous
liq-uid chromatographic analysis of ritonavir, quinine and 3-hydroxyquinine in human plasma. J Chromatogr B. 2009; 877:441–5.
11. Pukrittayakamee S, Pitisuttithum P, Zhang H, Jantra A, Wanwimolruk S, White NJ. Effects of cigarette smok-ing on quinine pharmacokinetics in malaria, Eur J Clin Pharmacol. 2002; 58(5):315–9.
12. Mirghani RA, Ericsson O, Cook J, Yu P, Gustafsson LL. Simultaneous determination of quinine and four metabo-lites in plasma and urine by high-performance liquid chromatography. J Chromatogr Biomed Sci Appl. 2001; 754(1):57–64.
13. Joos B, Ledergerber B, Flepp M, Bettex JD, Luithy R, Siegenthaler W. Comparison of high-pressure liquid chro-matography and bioassay for determination of ciprofloxacin in serum and urine. Antimicrob Agents Chemother. 1985; 27:353–6.
14. Chan CY, Lam AW, French GL. Rapid HPLC assay of fluoroquinolones in clinical specimens. J Antimicrobial and Chemotherapy. 1989; 23:597–604.
15. Kamberi M, Tsutsumi K, Kotegawa T, Nakamura T, Nakano S. Determination of ciprofloxacin in plasma and urine by HPLC with ultraviolet detection. Clinical Chemistry. 1998; 44(6):1251–5.
16. Davis JD, Aarons L, Houston BJ. Simultaneous assay of fluoroquinolones and theophylline in plasma by high-performance liquid chromatography. J Chromatogr. 1993; 621:105–9
17. Gladys M. Improved high-performance liquid chromato-graphic determination of ciprofloxacin and its metabolites in human specimens. J chromatogrB. 1992; 582:263–7. 18. Centre for Drug Evaluation and Research. FDA. Validation
of chromatographic methods. 1994.
19. Gloria W, Fekade BS, Jeffrey L, Jason AR. How do we use therapeutic drug monitoring to improve outcomes from severe infections in critically ill patients? BMC Infectious Diseases. 2014. DOI: 10.1186/1471-2334-14-288
against urinary pathogen. J Antimicrobial Chemotherapy. 2001; 48:37–45.
21. Lipman J, Allworth A, Wallis SC. Cerebrospinal Fluid Penetration of High Doses of Intravenous Ciprofloxacin in Meningitis. Clinical Infectious Diseases. 2000; 31:1131–3.
22. Wanwimolruk S, Sunbhanich M, Pongmarutai M. Effect of Cimetidine and Ranitidine on the Pharmacokinetics of Quinine. Br J Clin Pharmacol. 1986; 22:346–50.
23. Sowunmi A, Salako LA. Effect of dose size on the phar-macokinetics of orally administered quinine. Eur J Clin Pharmacol. 1996; 49(5):383–6.