Pensions at a Glance 2011
Retirement-income Systems in OECD and G20 Countries
Access the complete publication at:
http://dx.doi.org/10.1787/pension_glance-2011-en
Linking Pensions to Life Expectancy
Please cite this chapter as:
OECD (2011), “Linking Pensions to Life Expectancy”, in
Pensions
at a Glance 2011: Retirement-income Systems in OECD and G20
Countries
, OECD Publishing.
sovereignty over any territory, to the delimitation of international frontiers and boundaries and to
the name of any territory, city or area.
© OECD 2011
PART I
PART
I
Chapter 5
Linking Pensions to Life Expectancy
Increases in pensionable age, described in Chapter 1 above, are only one policy response to the fact that people are living longer. Around half of OECD countries have elements in their mandatory retirement-income provision that provide an automatic link between pensions and a change in life expectancy. This is a result of:
i)mandatory defined-contribution schemes substituting for or adding to public pension provision; ii)transformation of public, earnings-related plans into notional-accounts schemes; and iii)a link between benefit levels or qualifying conditions for pensions and life expectancy. Furthermore, there has been a marked shift from defined-benefit to defined-contribution provision in voluntary, private pensions. These changes have important implications for the way the cost of providing for pensions as life expectancy increases is shared. Increasingly, this will be borne by individual retirees in the form of lower benefits. This chapter measures the degree of uncertainty inherent in projections of life expectancy. Pension entitlements for example individuals in all 34 OECD countries are calculated under different scenarios – from slow to rapid increments in longevity. These calculations are then used to assess the degree to which the additional cost of longer lives has been shifted onto future generations of retirees with longer life expectancy.
O
lder people today live longer and healthier lives than previous generations did. When public pension systems were first established, people could typically look forward to only a few years of life in retirement (even if they were lucky enough to reach pension age). But in 2010, life expectancy at age 65 averaged nearly 17 years for men and 21 years for women in OECD countries. The probability that a newborn boy survives until age 65 is over 80%; the figure is over 90% for a girl.The impressive increase in life expectancy in the course of the last century should surely be celebrated. Ageing populations are “a high-class” problem, said Bill Clinton, President of the United States, in his 1999 State of the Union address. “It’s the result of something wonderful: the fact that we are living a lot longer”.
Nevertheless, ageing populations pose huge challenges for economic, social and health policies in general, and for pension systems in particular. It has been obvious for some time that many pension systems needed or still need reforming to ensure long-term affordability. It is much less clear how the burden of such adjustments should be divided between today’s taxpayers, contributors and retirees and future retirees. Furthermore, the estimates of life-expectancy increases on which pension decisions have been based have, regrettably, often turned out to be wrong. The growth of life expectancy, especially at retirement age, has consistently been underestimated (see Box 5.1).
The disconcerting effect on pension policymaking has been the need for repeated reforms, as changes to parameters and rules succeeded in stabilising the financial situation only for short periods. However, many of the reforms of the past 10-15 years mean that pensions will, in future, take automatic account of both projected increases in life expectancy and the uncertainty surrounding the estimates. Indeed, the rapid spread of such life-expectancy adjustments has a strong claim to be the most important innovation of pension policy in recent years.1
This policy has both economic and political attractions. The automaticity of adjustments means that governments no longer face nasty surprises in pension financing when life-expectancy projections change. Increasing life expectancy provides a neat and logical justification for cutting future benefits that may be politically more palatable than alternative reforms that would also reduce pensions.
This special chapter investigates reforms to mandatory retirement-income provision that have introduced some kind of automatic adjustment to increases in life expectancy. It explores how they have changed the way in which the financial risk of increasing life expectancy is distributed. The aim is to measure the degree to which individual retirees shoulder the extra burden of greater life expectancy on the pension system – or whether the cost is borne solely by pension providers (and, hence, by younger taxpayers and contributors).
5.1. Life expectancy and recent pension reforms
The pension landscape was dominated for much of the 20th century by defined-benefit
Box 5.1. How population projections for the United Kingdom have changed over time
Past projections of life expectancy have turned out to be wrong. Given the difficulties of any kind of forecast – particularly over long time horizons – this is unsurprising. However, life-expectancy projections have consistently under-predicted mortality improvements, often to a substantial degree.
The Government Actuary’s Department is responsible for projecting the population of the United Kingdom, which, among many other things, provides the basis for forecasts of future public spending on pensions. The future number of people aged 65 and over is an easy-to-understand part of these projections that is directly linked to life expectancy.
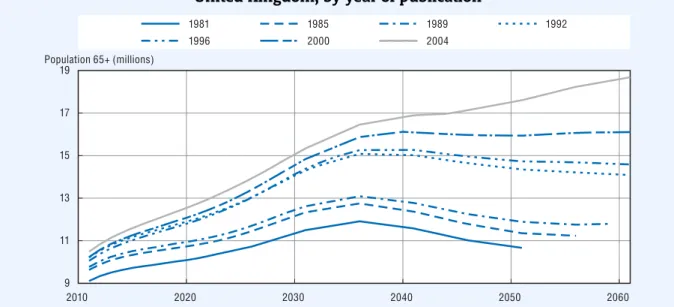
Figure 5.1 shows the number of older people predicted in the future from 2011 to 2061. The different lines show the different years in which the projections were published. In 1981, for example, the number aged 65+ was expected to be just over 9 million in 2011, rising to a peak of just over 12 million in 2036 and declining thereafter. The 1985 and 1989 forecasts had a similar pattern, albeit with half a million extra pensioners in 2011 and a million more in 2036 than predicted earlier.
Figure 5.1. Official projections of population aged 65+ for the years 2011-61, United Kingdom, by year of publication
Source: Government Actuary’s Department, United Kingdom.
1 2 http://dx.doi.org/10.1787/888932370645
The 1992 and 1996 projections involved a substantial revision: the peak population aged over 65 was 15 million in the latter, compared with the 12 million that had been expected in 1981. In contrast, the later forecasts alter the pattern over time of the number of older people. In the 2000 forecast, instead of a decline in the number of 65+ year-olds, this was expected to remain constant after 2036. The 2004 projection, in yet another contrast, showed a continued increase in the population aged over 65 from 2011 to 2061.
The scale of these changes in forecasts is huge. For 2036, for example, the earliest forecast (when the future pensioners were aged 10 and above) has increased by 36%: from around 12 million to 16.5 million. For 2051, the increase in projections over time has been greater still: 65%.
It is perhaps a little unfair to pick on the United Kingdom: undoubtedly, other OECD countries have seen similar underestimates. For example, the National Academy of Sciences, in a study of UN population projections, showed under-predictions of the population at older ages in Europe and North America of around 10% just 15 years forward (National Research Council, 2000). One problem has been the repeated assumption that humankind is reaching some “biological” limit to life expectancy only for mortality improvements to surpass their projections, sometimes within five years or fewer. This effect is illustrated vividly in Oeppen and Vaupel (2002).
1981 1985 1989 1992 1996 2000 2004 2010 2020 2030 2040 2050 2060 9 11 13 15 17 19
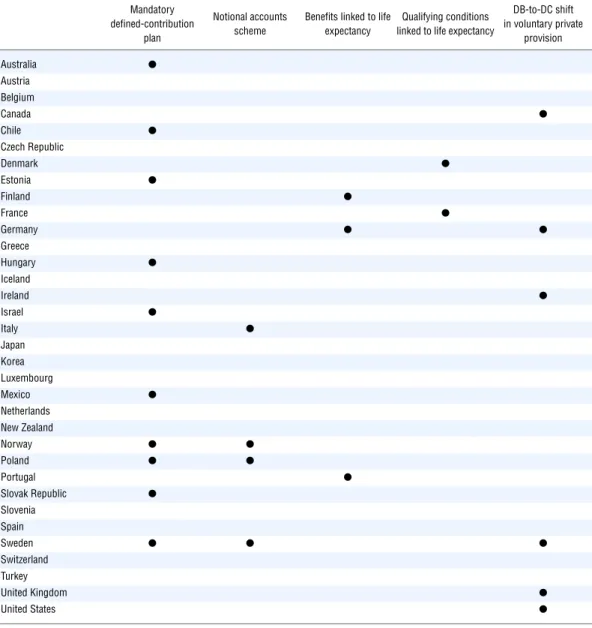
and a measure of individual earnings. This was true of both public retirement-income provision and employer-provided private pension plans. Over the past two decades, however, this defined-benefit paradigm has been diluted. Pension systems around the world have become much more diverse. Table 5.1 sets out the main changes relevant to this special chapter: those that involve an automatic link between pensions and life expectancy.
The most significant reform has been the expansion of private, defined-contribution pension schemes. In some countries – such as Chile, Estonia, Hungary, Mexico, Poland, the Slovak Republic and Sweden – these have replaced all or part of the public, defined-benefit pension scheme.2 In others, a requirement to contribute to a defined-contribution plan was added on top of existing state pensions: examples are Australia, Israel and Norway.
Table 5.1. Different ways of linking pensions to life expectancy
Mandatory defined-contribution
plan
Notional accounts scheme
Benefits linked to life expectancy
Qualifying conditions linked to life expectancy
DB-to-DC shift in voluntary private provision Australia ● Austria Belgium Canada ● Chile ● Czech Republic Denmark ● Estonia ● Finland ● France ● Germany ● ● Greece Hungary ● Iceland Ireland ● Israel ● Italy ● Japan Korea Luxembourg Mexico ● Netherlands New Zealand Norway ● ● Poland ● ● Portugal ● Slovak Republic ● Slovenia Spain Sweden ● ● ● Switzerland Turkey United Kingdom ● United States ●
Note:See country profiles in Part III for more details on national schemes. DB = Defined benefit; DC = Defined contribution.
Thus, 10 OECD countries have mandatory defined-contribution schemes at present. Also, Denmark has very broad coverage of quasi-mandatory occupational plans that are of the defined-contribution type.
In countries with widespread, voluntary occupational pensions, employers have tended to shift these from defined benefit to defined contribution (or a mix of the two). This trend began as early as the 1970s in the United States, with Canada, Ireland and the
United Kingdom following a similar pattern.3 The two quasi-mandatory occupational
schemes for private-sector workers in Sweden have also been fully defined-contribution since 2006. One motivation for these changes has been the increase in cost of defined-benefit plans as retirees live longer compared with the stable and relatively predictable cost to the employer of a particular contribution rate to a defined-contribution scheme. In Germany, the new “Riester” pensions mean that defined-contribution schemes have become more prominent in voluntary private provision of retirement income.
In defined-contribution schemes, the burden of changes in life expectancy is borne by individual retirees in the form of lower pensions. When people retire in a defined-contribution plan, the accumulated contributions and investment returns must is converted from a lump sum into a regular pension payment, known as an “annuity”. The calculation of the annuity will be based on projected life expectancy of retirees at the time of retirement. So, pension replacement rates will automatically be lower as people live longer.
People do not always convert their lump sums at retirement into annuities. But even if they periodically withdraw money from their pension accounts, the amount that they can sustainably take out each period is smaller the longer is life expectancy. The lump sum accumulation at retirement is the same: it must be spread over a longer period whether it is withdrawn as an annuity or in any other way.
Notional-accounts schemes also include an annuity calculation. At the time of retirement, the accumulated contributions and notional interest is converted into a periodic payment. The rate of conversion, like the annuity rate, depends on life expectancy. This similarity between defined-contribution and notional-accounts schemes is why notional
accounts have attracted the moniker of “notional-defined contribution” schemes.4 Four
OECD countries have adopted notional accounts: Italy, Poland, Norway and Sweden.
A shift from defined-benefit plans to defined-contribution or notional accounts schemes is often called a “systemic” reform because it alters the architecture of the national pension system. In contrast, some countries have carried out “parametric”reforms
that have introduced a link to life expectancy. For example, Finland and Portugal have retained their defined-benefit, public plans. In the future, benefits will be reduced by a factor directly related to life expectancy.
In Germany, the link to life expectancy is more complex. Germany has a points scheme, where a year’s contributions at average earnings covered by the pension system earns one point. The accumulated points at the time of retirement are then converted into a stream of pension payments based on a pension-point value. The adjustment of the pension point value over time now reflects the financial sustainability of the scheme. This is measured principally by the system dependency ratio: the number of people of pensioners relative to the number of workers.
To help define the kinds of pension reform analysed in this special chapter, it is useful to contrast these automatic adjustments of benefits to life expectancy with alternative reform strategies. The 2004 reform in Japan introduced an adjustment to benefits related to life
expectancy. Public-pension benefits have been cut by 0.9% a year for new retirees; this process will continue until 2023. These adjustments, designed to stabilise the finances of the pension system in the face of rapid population ageing. They are based on the assumption of constant increase in life expectancy of 0.3% per year. But there is no mechanism by which these adjustments vary should life expectancy increase at a different rate than that anticipated. There is no automatic link between pensions and life expectancy.
It is, perhaps, surprising that few OECD countries have formally adopted the most obvious form of link between pensions and life expectancy: to increase the pensionable age
as people live longer. There will be such a link in Denmark once the pension age completes its increase from 65 to 67 in 2027. Italy and Greece will link pension age to life expectancy from 2015 and 2020 (respectively). However it will still be possible to claim the pension at any age with 40 years of contribution in both cases.
The Pensions Commission in the United Kingdom, headed by Lord Turner, proposed an increase in the pension eligibility age from 2020 that would leave life expectancy at pension age constant. The Commission also suggested that some catch-up for past increases in life expectancy that have not been taken into account, with an additional increase in pension age by 2050 of up to two years. However, the previous government proposed instead a
pre-announced schedule of increases in pension age, with an increase from 65 to 66 starting in 2024, to 67 from 2034 and to 68 starting in 2044 (phased in over a two-year period in each case).5 As shown in the Part I, Chapter 1 on “Trends in pensionable ages and life expectancy, 1950-2050”, this will broadly stabilise the expected time in retirement in the United Kingdom. Again, however, there is no automatic link with life expectancy.
France has adopted a policy of linking the number of contribution years required for a full pension to changes in life expectancy.6 As a result, this condition is increasing from 40 years’ contribution (2003-08) gradually to 41.5 years from 2013. The link is not quite as strong as that implicit in many other arrangements, such as defined-contribution plans, notional accounts or benefit links. The aim is to maintain the ratio of the expected duration of retirement to the expected length of career. Thus, extra years of life expectancy partially increase the length of retirement.
To summarise, governments commonly use increases in life expectancy to justify pension reforms, such as increasing pension ages or reducing benefits. What distinguishes the reforms analysed in this special chapter is the automatic link to life expectancy. Table 5.1 shows that there have been five important developments producing such an automatic link. The majority of OECD countries – 20 out of 34 – have seen one or more of these changes in the past two decades and, arguably, the effects go somewhat wider than this.7
5.2. How uncertain is life expectancy?
The unwelcome experience of errors in projections of life expectancy (as outlined in Box 5.1) has encouraged the development of new techniques. A fundamental objective of this endeavour has been to improve the information on which pension-policy decisions are made. Lee and Carter (1992) both formalised and popularised “extrapolative methods”, illustrating their technique by projecting past mortality trends to future mortality rates in the United States until 2065.8 The argument for extrapolating from the past is that forecasts implicitly assuming a slowdown in mortality improvements have repeatedly proved wrong. This technique has been widely applied and adopted by many official forecasters.
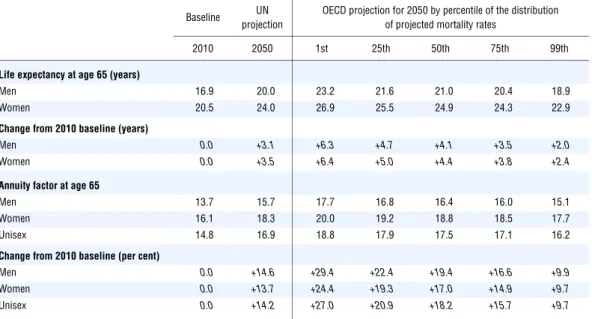
The baseline for the projections is mortality rates by sex and age in 2010. What these mean for life expectancy at age 65 – the most relevant age for pension policy – is shown at the left-hand side of Table 5.2. The second column shows the projections from the database of the United Nations for 2050 for the same variable. Between 2010 and 2050, life expectancy for men at age 65 is forecast to increase by about three years to 20 years (that is a total life of 85 years of age, conditional on having survived until age 65). For women the increase is projected to be 3.5 years to reach 24 years in 2050.
The five columns at the right show a series of different projections made by the OECD. (These use a type of extrapolative method as discussed above; see Whitehouse (2007) for a detailed presentation of the techniques employed.) These show different scenarios for changes in mortality rates, represented here by the percentiles of the distribution resulting from 2 000 simulations.9 At the optimistic end of the range, 1% of the time life expectancy increases by nearly 6.5 years between 2010 and 2050 (the 1st percentile column). Again, 1% of the time, life expectancy is expected to increase by 2.4 years for women and 2.0 years for men (the 99th percentile column). The median increase in these forecasts is over four years for both men and women, about one year greater than in the United Nations projections.
The degree of uncertainty in the projections is central to this special chapter. Life expectancy at age 65 differs by 4-4.5 years between the best and the worst scenarios for changes in mortality rates over the next 40 years.
The lower panel of Table 5.2 explores the financial implications of these changes. The analysis makes use of “annuity factors”: the lifetime value of the flow of a pension of one unit per period.10 For example, the baseline 2010 unisex annuity factor is 14.8. This means that the lifetime value of a USD 10 000 pension, indexed to prices, would be USD 148 000.
Table 5.2. Life expectancy and annuity factors: Baseline data for 2010 and alternative projections for 2050
Baseline UN projection
OECD projection for 2050 by percentile of the distribution of projected mortality rates
2010 2050 1st 25th 50th 75th 99th
Life expectancy at age 65 (years)
Men 16.9 20.0 23.2 21.6 21.0 20.4 18.9 Women 20.5 24.0 26.9 25.5 24.9 24.3 22.9
Change from 2010 baseline (years)
Men 0.0 +3.1 +6.3 +4.7 +4.1 +3.5 +2.0 Women 0.0 +3.5 +6.4 +5.0 +4.4 +3.8 +2.4
Annuity factor at age 65
Men 13.7 15.7 17.7 16.8 16.4 16.0 15.1 Women 16.1 18.3 20.0 19.2 18.8 18.5 17.7 Unisex 14.8 16.9 18.8 17.9 17.5 17.1 16.2
Change from 2010 baseline (per cent)
Men 0.0 +14.6 +29.4 +22.4 +19.4 +16.6 +9.9 Women 0.0 +13.7 +24.4 +19.3 +17.0 +14.9 +9.7 Unisex 0.0 +14.2 +27.0 +20.9 +18.2 +15.7 +9.7
Note:All projections based on unweighted average mortality rates for the 34 OECD member countries. Annuity factors are based on a price-indexed payment using a real discount rate of 2% per year.
Source:United Nations, World Population Prospects – The 2008 Revision; OECD projections based on these data: see Whitehouse (2007) for the detailed methodology.
(Note that this calculation is a “present value”: future payments are discounted at a rate of 2% a year.) Looking at the OECD projections for 2050, the unisex annuity factor is 17.9 under the median mortality rate projection. That is about 20% higher than the level in 2010: a measure of the additional cost of providing a pension for a longer period as life expectancy increases. The span of costs under different life-expectancy scenarios is also instructive: 1% of the time the annuity factor is at least 18.8 and, again 1% of the time, at most 16.2. This range is equivalent to a cost increase of providing pensions between 2010 and 2050 of 10% to 27%.
5.3. Two benchmark pension plans
In more than half of OECD countries, there have been shifts in policy and practice that link pension benefits automatically to life expectancy (Section 5.1). To explore the impact of these changes, it is useful to begin with two measures of pension entitlements. The first is the pension replacement rate: the annual value of the benefit relative to individual earnings when working. The second is pension wealth: the present value (or “stock”) of the lifetime flow of pension benefits. Pension wealth is calculated by multiplying the replacement rate by the annuity factors discussed in Section 5.2 above. (Both replacement rates and pension wealth are discussed in greater detail in the indicators of pension entitlements in Part II.2 of this report.)
Two generic types of pension scheme are the second element of this illustration, providing a benchmark against which the features of real-world pension systems can be assessed.
● Under a pure defined-benefit pension scheme, a particular level of benefits is provided regardless of what happens to life expectancy. This means that the replacement rate is constant in different scenarios for mortality rates. However, pension wealth varies with life expectancy: a longer retirement duration means that lifetime benefits are higher and
vice versa.
● Under a pure defined-contribution plan, the accumulation of contributions and
investment returns at the time of retirement is pension wealth: it is the same whatever happens to life expectancy. However, as people live longer, pension wealth must be spread over a longer retirement duration. This is clearest in the cases where individuals buy an annuity at the point of retirement. The annuity provider will offer a lower proportion of the lump sum in pension as life expectancy increases. But it is also true when people do not buy an annuity: they cannot spend as much per period of their pension accumulation as people live longer over time. Notional-accounts schemes have similar effects: it is just that they attract notional interest and it is notional capital that is converted at retirement into a periodic payment.
It is important to remember that these are theoretical benchmarks. As with all benchmarks, it is necessary to impose a rule of ceteris paribus: holding other things equal. In the real world, outcomes can vary. First, the defined benefit often turns out to be not so well defined. The additional cost of longer life expectancy is initially borne by the pension provider. But this must be passed on: to contributors and taxpayers in the case of public schemes and contributors and shareholders in the case of employer-sponsored plans. Some of the extra cost has often been offset by changes in the parameters and rules of pension systems: higher pension ages, lower benefits or changed indexation of pensions in payment, for example.11 The precise outcome, however, depends on the political process and not on some automatic rule.
Secondly, the political process can also intervene in schemes that are closer to the pure defined-contribution benchmark. Governments, for example, may fail to implement changes in benefits that are specified by the rules. This can lead to an additional burden – temporary or permanent – on contributors and taxpayers.
Individual behaviour also responds to the pension system. For example, people may choose to work longer as replacement rates fall because of longer life expectancy in the pure defined-contribution case (see also the discussion in Section 5.7). This will augment benefits through additional contributions, returns on accumulated capital and a shorter expected duration of retirement. But the increment to replacement rates from working an additional year also falls as life expectancy increases in schemes with a link to life expectancy. (These different effects are discussed in “Pension incentives to retire”: Part I, Chapter 4 of this report.) The behavioural response is therefore not clear cut. Moreover, any behavioural effect will apply equally to cuts in benefits that are not a result of life-expectancy links in the pension system.
5.4. Pension entitlements and uncertain life expectancy
Pension entitlements have been calculated for all OECD countries under five different scenarios for the development of national mortality rates between 2010 and 2050. The five scenarios are the median of the distribution of outcomes, the upper and lower quartiles and the 1st and 99th percentiles. (The implications of these scenarios for mortality rates for life expectancy were illustrated in Table 5.2 above.) The two key measures of entitlements are replacement rates and pension wealth.
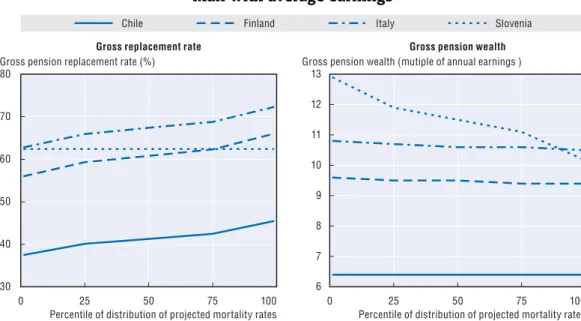
Four example countries, representing different types of retirement-income provision, are used to illustrate the results. Chile has a mandatory defined-contribution scheme and Italy has notional accounts. The other two countries have public defined-benefit schemes: with adjustments for life expectancy in Finland and without in Slovenia.
The left-hand chart in Figure 5.2 shows the replacement rate under the different mortality scenarios. All the results are for a man on average earnings. With Slovenia’s defined-benefit plan, the replacement rate is constant at 62%. But in the other three cases, replacement rates are lowest at the highest life expectancy (1st percentile of the distribution) than they are with low life expectancy (99th percentile). In Finland, for example, the replacement rate is 56% with the lowest mortality rates and 66% with the highest.
Pension wealth is shown in the right-hand chart of Figure 5.2. In Slovenia, pension wealth is nearly 13 times annual earnings in the high life expectancy scenario but just over ten times with low life expectancy. In Chile, pension wealth is constant under the different scenarios for mortality rates. There is a slight decline in pension wealth as mortality rates increase in Finland and Italy, but this is substantially shallower than for Slovenia. For example, pension wealth is higher in Slovenia than Italy in most cases, but if mortality improvements were especially slow, Italy would show higher pension wealth than Slovenia. Recall the two benchmarks from Section 5.3. Under a pure defined-benefit plan, replacement rates are constant while pension wealth varies with life expectancy. This is illustrated by the Slovenia case. Under a pure defined-contribution plan, the reverse is true: pension wealth is constant but the replacement rate varies with life expectancy. This is illustrated exactly by the Chile case and is close to the picture for Finland and Italy.
Space constraints preclude illustrating the pension systems of all 34 OECD countries in this manner. Instead, Figures 5.3 and 5.4 combine the information on replacement rates and pension wealth under different scenarios for future mortality rates. The charts show the replacement rate on the vertical axis and pension wealth on the horizontal. Thus, in the first benchmark case of a pure defined-benefit scheme, the curve linking the results for the different mortality scenarios would be horizontal: a constant replacement rate and varying pension wealth. A vertical curve would be the result for the second, pure defined-contribution benchmark: varying replacement rate and constant pension wealth.
Figure 5.3 looks at four sets of countries, grouped by the linkage to life expectancy in mandatory or quasi-mandatory parts of the pension system. At the top left of the figure are countries with mandatory defined-contribution schemes (including Denmark’s quasi-mandatory plans). These countries differ markedly in the size of the mandate to provide retirement incomes. Denmark, Hungary and Israel have high replacement rates and pension wealth, while Australia, Chile and Mexico have much smaller mandatory systems. These countries also differ in the structure of the retirement-income package. In Estonia, Hungary and the Slovak Republic, public earnings-related schemes provide a significant part of retirement incomes. And none of these plans has a link to life expectancy. In Australia and Denmark, the majority of retirees receive resource-tested public benefits. Thus, as increases in life expectancy reduce the payout from defined-contribution plans, the government makes up part of the difference in higher public benefits. In Chile and Mexico, by contrast, minimum pensions do not affect the retirement income of an average earner.
These differences in the retirement-income package show up clearly in the results. Chile and Mexico are very close to the pure defined-contribution benchmark: a vertical line indicating that replacement rates vary with life expectancy but pension wealth is constant. Israel’s curve is close to vertical: most of retirement-income comes from the mandatory
Figure 5.2. Pension entitlements under different life-expectancy scenarios: Man with average earnings
Source: OECD pension models.
1 2 http://dx.doi.org/10.1787/888932370664 6 8 7 9 10 11 12 13 30 40 50 60 70 80 0 25 50 75 100 0 25 50 75 100 Chile Finland Italy Slovenia
Percentile of distribution of projected mortality rates Percentile of distribution of projected mortality rates
Gross pension wealth (mutiple of annual earnings ) Gross pensionreplacement rate (%)
defined-contribution scheme but there is a basic pension in addition. But the other five countries have sloping curves. High life expectancy means somewhat lower replacement rates but also, somewhat higher pension wealth due to public benefits.
The four countries with notional accounts are shown in the upper right panel of Figure 5.3. Three of them – Norway, Poland and Sweden – also have mandatory defined-contribution pensions. In addition, the calculations for Sweden include quasi-mandatory, defined-contribution, occupational benefits. In all four cases, an average earner would not be eligible for minimum pensions or resource-tested benefits and so all of their pension entitlements are linked to life expectancy.
Figure 5.3. Pension entitlements under different life-expectancy scenarios: Man with average earnings
Note:The impact of the sustainability adjustment for Germany is too complex be modelled. In fact, replacement rates will vary under different life-expectancy scenarios. The calculations for Norway in this figure include the minimum (“guarantee”) pension, notional accounts and the mandatory defined-contribution plan. See Figure 5.4 for information including voluntary defined-contribution plans in addition.
Source: OECD pension models.
1 2 http://dx.doi.org/10.1787/888932370683 100 75 50 25 75 50 75 50 75 50 25 25 25 0 5 10 15 20 0 5 10 15 15 10 5 5 10 15 20 0 20 0 20
Gross pensionreplacement rate (%) Gross pensionreplacement rate (%)
100 100
Gross pension wealth (multiple of annual earnings) Gross pension wealth (multiple of annual earnings)
Countries with life-expectancy adjustments Countries with no life-expectancy link
Gross pensionreplacement rate (%) Gross pensionreplacement rate (%)
Gross pension wealth (multiple of annual earnings) Gross pension wealth (multiple of annual earnings)
100
Slovak Republic Estonia Israel Hungary Mexico Australia Chile Denmark Poland Norway Italy Sweden France Germany Finland Portugal Iceland Korea Slovenia Austria Netherlands Turkey Switzerland Spain Japan Luxembourg Greece
Countries with mandatory defined-contribution plans Countries with notional accounts
The curves are close to vertical, indicating that they conform closely to the pure defined-contribution benchmark. The curves are not precisely vertical, for various technical reasons. The main one of these explanations is that the standard real discount rate used in the actuarial calculations in Pensions at a Glance is 2% a year. Benefits in Poland are calculated using a zero discount rate, while the rate is 1.5% in Italy and 1.6% in Sweden.
Countries with life-expectancy adjustments in defined-benefit or points schemes are shown at the bottom left of Figure 5.3. In Finland and Portugal, all the benefits for an average earner are linked to life-expectancy changes: there is no entitlement at this earnings level to minimum pensions or resource-tested benefits. The results for these countries are close to the pure defined-contribution benchmark.
The French case poses some modelling difficulties. To recapitulate, the policy is designed to keep the ratio between the number of contribution years and the duration of retirement constant. From the current plan to increase the contribution requirement to 41 years from 2012, the median scenario for mortality rates implies an increase to 43.75 years in 2050.12 At the highest percentile of mortality improvements, the number of years required would be 44.5 and at the lowest, 42.5. The replacement is pretty much constant across the mortality scenarios. Pension wealth is larger, the lower the mortality rates. This appears to conform to the pure defined-benefit model. However, the age at which the pension can be drawn increases with the number of contribution years as life expectancy gets longer. The implication is that about a third of the difference in lifetime pension between the scenarios is borne by retirees by having to claim their pension later while the remainder feeds through into pension wealth.13
There are also some difficulties in the modelling for Germany. The sustainability adjustment depends on the system dependency ratio. But it is not possible for the OECD to model this ratio under different scenarios for mortality rates. The data for Germany
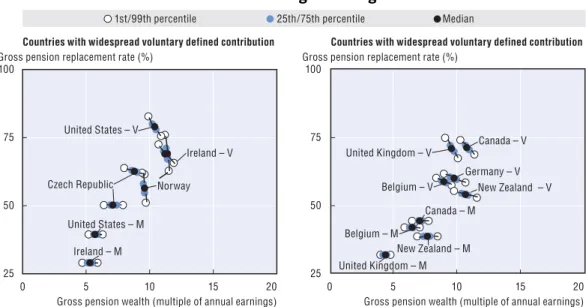
Figure 5.4. Pension entitlements under different life-expectancy scenarios: Man on average earnings
Note:See Figure 5.3 for mandatory-only analysis of Germany and Norway.
M = Mandatory provision; while V = Mandatory plus voluntary private entitlements.
Source: OECD pension models.
1 2 http://dx.doi.org/10.1787/888932370702 100 75 50 25 75 50 25 0 5 10 15 20 0 5 10 15 20
Countries with widespread voluntary defined contribution Countries with widespread voluntary defined contribution
Gross pensionreplacement rate (%) Gross pensionreplacement rate (%)
Gross pension wealth (multiple of annual earnings) Gross pension wealth (multiple of annual earnings)
100
United States – V
Ireland – M
Czech Republic Norway United States – M Ireland – V New Zealand – M United Kingdom – M New Zealand – V Germany – V Canada – M Canada – V Belgium – V Belgium – M United Kingdom – V 1st/99th percentile 25th/75th percentile Median
therefore take account of the sustainability only at the central demographic projection of the German authorities: in practice, the replacement rate will vary as life expectancy changes.
The results for countries without a link to life-expectancy are presented in the final chart in Figure 5.3. Among this group are the five OECD countries with the highest replacement rates for full-career workers on average earnings: Greece, Iceland, Luxembourg, the Netherlands and Spain. But it also includes countries – Japan and Korea – with relatively low replacement rate. Pension entitlements derive mainly from public earnings-related plans in eight countries. However, Iceland and Switzerland have mandatory private defined-benefit plans and in the Netherlands, quasi-mandatory occupational schemes are overwhelmingly of the defined-benefit type. Naturally, these countries show the characteristic pattern of the pure defined-benefit benchmark: replacement rates are constant between different scenarios for mortality rates, but pension wealth increases as life expectancy gets longer.
The final pair of charts (Figure 5.4) covers nine countries where this is widespread coverage of voluntary private pensions (40% or more of the workforce). A defined-contribution plan is modelled. Even though there remains some defined-benefit provision in some of these countries, generally this is concentrated among public-sector workers and in the private-sector is being phased out as defined-benefit plans are closed to new members.
Pensions at a Glance deals with private-sector workers and new labour-market entrants, among whom defined-benefit coverage is low in most cases.
In all the countries shown in Figure 5.4, the mandatory part of the pension system (generally marked “M”) delivers entitlements in line with the pure defined-benefit model: a constant replacement rate but varying pension wealth under different mortality scenarios, the same pattern as in the bottom right-hand panel of Figure 5.3. (Results for just mandatory schemes in Germany and Norway were show in Figure 5.3 and are not repeated here.)
Once account is taken of additional voluntary defined-contribution provision (mainly marked “V”), replacement rates do vary with pension age. However, only in Norway – with a mix of notional accounts, mandatory contribution plans and voluntary defined-contribution provision – is the curve close to vertical. In other cases, replacement rates are somewhat lower with higher life expectancy. But public pension benefits mean that pension wealth increases somewhat with life expectancy. When voluntary schemes are taken into account, the pattern is similar to many of the countries with voluntary private pensions in the top right-hand chart of Figure 5.3 (Chile and Mexico apart).
5.5. An indicator of automatic life-expectancy links in pension systems
Retirement-income systems are generally made up of more than one scheme. There are the different schemes that provide an automatic link to life expectancy and those that do not. There are also means-tested retirement-income programmes that can offset some or all of the cuts in the life-expectancy-linked scheme. The is apparent from the illustrations in Figures 5.3 and 5.4, but these are complex. This section summarises these results, by calculating a simple summary index of the degree to which pension benefits from all components of the national scheme are linked to life expectancy.
The index is calibrated so that the pure defined-contribution benchmark (introduced in Section 5.3) would show a figure of 100%: all retirement benefits are linked to life
expectancy and the link is complete.14 The second benchmark – a pure defined-benefit
Figure 5.5 presents the results. The left-hand panel shows countries with a link to life-expectancy among the mandatory or quasi-mandatory parts of their retirement-income systems. Fully 100% of the pension rights of an average earner are linked to life expectancy in three countries. But this is achieved through different means: an adjustment in the defined-benefit scheme in Portugal, a defined-contribution plan in Chile and a mix of notional accounts and two defined-contribution plans in Sweden. The link to life expectancy is also strong (75%-100%) in Finland, Italy, Mexico and Norway.
At the other end of the spectrum, the proportion of earnings going into defined-contribution plans is relatively small in Estonia and Hungary. In Australia and Denmark, the majority of retirees receive means-tested retirement payments. Lower benefits from defined-contribution plans are partially made up by higher entitlements to means-tested benefits, significantly reducing the effective link between pensions and life expectancy. In Germany, the formula underlying the sustainability adjustment means that only some of the cost of longer life expectancy is borne in the form of lower benefits.
Most of the countries in the right-hand panel of Figure 5.5 have no link to life expectancy in the mandatory parts of their pension system: hence, countries from Austria down to Turkey are shown as zero. The same is true of the mandatory schemes in Belgium, Canada, the Czech Republic, Ireland, New Zealand, the United Kingdom and the United States. However, for these countries the bars show the degree of life-expectancy link for people covered by a voluntary defined-contribution plan, which amounts to between 40% and 60% of the workforce. The key difference between countries here is the size of the typical or average contribution to the private pension. Also, with the United Kingdom increasing pension age to 68 and the United States to 67, people are assumed to contribute for longer in these countries and accumulate investment returns over a longer period. Still, in none of
Figure 5.5. Percentage of pension entitlements linked to life expectancy: Man on average earnings
Source: OECD pension models.
1 2 http://dx.doi.org/10.1787/888932370721
0 25 50 75 100 0 25 50 75 100
Countries with no life-expectancy links or links in voluntary private plans Countries with life-expectancy links
in mandatory retirement-income programmes
Percentage of total pension linked to life expectancy Percentage of total pension linked to life expectancy
Australia Estonia France Hungary Germany Denmark
Slovak Republic Israel Italy Norway Finland Mexico Poland Chile Portugal Sweden
Mandatory DC Notional accounts Adjustments Voluntary DC
Turkey Switzerland Spain Slovenia Netherlands Luxembourg Korea Japan Iceland Greece Austria Czech Republic New Zealand Belgium Canada Ireland United States United Kingdom Germany Norway
these cases are more than 50% of overall retirement benefits linked to life expectancy because public schemes (without links) are an important source of income in old age.
For completeness, the calculations in this chart also show the effect of adding voluntary defined-contribution plans to the links to life expectancy in Germany and Norway. The overall proportion of pensions – mandatory plus voluntary – linked to life expectancy is about 55% and 85% respectively.
5.6. The impact of taxes
Most OECD counties tax pensions in payment. All OECD countries have “progressive” income taxes, meaning that the proportion of income paid in tax increases with income. In turn, this means that the marginal tax rate (the extra tax on an additional unit of income) is higher than the average tax rate (the proportion of income paid in tax). If a longer life expectancy cuts the value of pension entitlements, then the income tax liability falls at the marginal rate and the average tax rate falls. Thus, pension entitlements net of taxes are less sensitive to changes in life expectancy (where there is a link with pensions) than the gross benefit.
Figure 5.6 shows the results. Again, at the left-hand side, are countries with mandatory defined-contribution or notional accounts schemes, as well as those with life-expectancy links in public defined-benefit plans. At the right-hand side are countries that do not have such links. But the calculations have been performed on the same basis for typical voluntary private schemes in seven countries where these have broad coverage. Taxes make a difference in most cases: it is particularly large in Finland, Ireland, Israel,
Italy and Norway.15 The Slovak Republic does not tax pensions in payment, while
entitlements in Canada, the Czech Republic, Hungary, Mexico and New Zealand are below the basic income-tax relief (see “Tax treatment of pensions and pensioners” in Part II.2).
Figure 5.6. Percentage of pension entitlements linked to life expectancy: Before and after taxes and contributions
Note:Because of the complex nature of the link between pensions and life expectancy in France and Germany, it has not been possible to calculate net data for these countries.
Source: OECD pension models.
1 2 http://dx.doi.org/10.1787/888932370740
0 25 50 75 100 0 25 50 75 100
Countries with no life-expectancy links in mandatory programmes Countries with life-expectancy links
in mandatory retirement-income programmes
Percentage of total pension linked to life expectancy Percentage of total pension linked to life expectancy
Net terms Gross terms
Australia Estonia Hungary Denmark
Slovak Republic Israel Italy Norway Finland Mexico Poland Chile Portugal Sweden Turkey Switzerland Spain Slovenia Netherlands Luxembourg Korea Japan Iceland Greece Austria Czech Republic New Zealand Belgium Canada Ireland United States United Kingdom
5.7. The impact of individual earnings
The results shown so far have looked at the case of an average earner. But the structure of retirement-income packages varies in many countries between individuals with different levels of earnings. Low earners, for example, are much more reliant on basic, means-tested or minimum pensions. Figure 5.7 shows how the index of the strength of the link between pensions and life expectancy varies with individual earnings.
Starting with the countries with a link in mandatory retirement-income provision, the top left-hand chart shows cases where the link is stronger for higher earners. The patterns in Chile, Finland, Norway and Portugal are very similar. People earning 50% of the average have pensions relatively invariant to changes in life expectancy, because as benefits from defined-contribution or earnings-related schemes are adjusted, some or all of the loss is
Figure 5.7. Percentage of pension entitlements linked to life expectancy: Impact of individual earnings
Source: OECD pension models.
1 2 http://dx.doi.org/10.1787/888932370759 100 75 50 25 75 50 25 0 100 0 0 50 100 150 200 0 50 100 150 200 75 50 25 100 0 0 50 100 150 200
Voluntary private pensions
Norway Denmark Estonia Australia Finland Mexico Chile Portugal
Countries with life-expectancy links in mandatory retirement-income programmes
Poland
Slovak Republic
Sweden
Hungary Italy
Israel Germany
Percentage of gross total pension linked to life expectancy Percentage of gross total pension linked to life expectancy
Individual earnings, per cent of economy-wide average Individual earnings, per cent of economy-wide average
United Kingdom United States
Canada Czech Republic New Zealand
Belgium
Ireland
Percentage of gross total pension linked to life expectancy
made up with a larger entitlement to safety-net benefits. Mexico shows a similar picture, although the minimum pension affects workers on 75% as well as those on 50% of average earnings. The other three countries show a much more gradual shift to stronger links between pensions and life expectancy as earnings rise. This is because the resource-tested schemes in Australia and Denmark cover a majority of retirees from the lowest incomes upward. However, high-income retires in Australia will not be entitled to their benefit, and so there is a large jump in the curve between 150% and 200% of average earnings. Denmark and Estonia have basic pensions. Both mean that public benefits, not linked to life expectancy, provide a greater share of income in old age for low earners. For high earners, the defined-contribution scheme plays a much greater role.
In most of the countries in the right-hand chart, the share of total pensions linked to life expectancy is roughly constant with earnings. The basic pension in Israel and the guarantee pension in Sweden affect the pattern in a similar way as the countries in the left-hand chart. The slight decline in Italy at higher earnings reflects the policy of “progressive indexation”, whereby smaller pensions are price indexed while larger benefits are uprated by only 75% of price inflation.
Countries with widespread voluntary private pension coverage are shown at the bottom of Figure 5.7. Most of them – Canada, the Czech Republic, Ireland, New Zealand and the United Kingdom – have basic schemes. In Belgium, the minimum pension provides a significant part of retirement incomes for low earners. The Czech Republic, the United Kingdom and the United States have progressive formulae in their public, defined-benefit schemes. As a result, low earners receive a much higher replacement rate from mandatory public programmes than high earners do. The pattern in the chart is therefore very similar to Denmark and Estonia in the chart above.
5.8. Living longer, working longer?
A link between benefit levels and life expectancy predominate in the pension reforms analysed in this chapter. Advocates of these reforms have argued that individuals will respond by working longer as successive cohorts live longer and benefits for a given retirement age are consequently lower.16
Table 5.3 gives some indication of the extra length of work required for selected countries17 with a link to life expectancy in their mandatory retirement-income provision. It shows the current normal pension age and, using different projections for life expectancy in 2050, the age of claiming the pension that would deliver the same benefits.
In Chile, for example, the current normal pension age is 65. Under the median mortality scenario, an individual would have to work to age 66.4 years. The extra work adds to annual benefits in three ways: additional contributions, extra investment returns on accrued pension capital and a shorter duration of retirement. In the low-mortality scenario, however, work until age 68.0 would be needed to maintain benefits, while a pension age of 65.9 would be sufficient in the high-mortality scenario. This pattern is broadly replicated in other countries, such as Finland, Italy, Mexico, Poland and Sweden. The extra years needed between 2010 and 2050 from Norway’s current normal pension age of 67 are also similar. Typically, just under one extra year’s work will deliver the same benefit as 2010 under the high-mortality scenario, 1.5 years’ in the median case and around three years with the most rapid mortality improvements.
In Estonia and the Slovak Republic, the extra years of work are smaller, reflecting the significance of elements of the pension package not linked to life expectancy, as illustrated in Figure 5.5 above. In Portugal, the extra years of work needed to offset life-expectancy related reductions in benefits are also small. This reflects the large increments to accrued benefits for people working after normal pension age. This can be as high as 12.0%, well above the OECD average of 4.8%.18
5.9. Conclusions and policy implications
Retirement used to be a luxury enjoyed only by the few; now it is an expectation for the many. The huge increase in life expectancy in the 20th century is a wonderful achievement. The first decade of the 21st century has seen continued longevity gains in most of the world. However, when added to the decline in the birth rate, the result is rapid population ageing and a rapidly growing cost of paying for pensions. As a result, pension expenditures grew 15% faster than national income between 1990 and 2007. And population ageing in OECD countries will accelerate between 2010 and 2030.
This chapter has explored automatic links between pensions and life expectancy, which are now in place in at least 20 of the 34 OECD countries. These can act as a mechanism for spreading the pension cost of longer lives between generations and helping the long-term financial sustainability of the retirement-income system.
It is hard to see why people approaching retirement should not bear at least some of the cost of their generation living longer than previous generations. After all, living longer is desirable. A longer life and a larger lifetime pension payout due to increased life expectancy confers a double advantage. Some link between pensions and life expectancy is therefore optimal.
The question then is: should all of the cost of longer lives be shifted onto new retirees, in the form of lower benefits or a requirement to work longer for the same benefit? The issue is complex because each individual has a lifecycle that includes periods as a contributor and as a beneficiary. There is a trade-off: greater certainty over retirement age and/or benefits versus greater certainty over the amount of contributions or taxes paid when working. The optimum is therefore unlikely to be a 100% link between pensions and life expectancy. In five countries with life-expectancy links in their mandatory pension
Table 5.3. Pension ages needed to equalise benefits in 2010 and 2050 under different mortality scenarios: Man on average earnings, selected countries
Current normal pension age
Pension age delivering equal replacement rate in 2050 Low mortality Median mortality High mortality
Chile 65 68.0 66.4 65.9 Estonia 63 64.0 63.5 63.3 Finland 65 68.0 66.3 65.9 Italy 65 67.7 66.2 65.9 Mexico 65 67.9 66.2 65.9 Norway 67 69.8 68.3 67.9 Poland 65 67.9 66.3 65.9 Portugal 65 66.8 65.5 65.5 Slovak Republic 62 63.4 62.7 62.4 Sweden 65 68.2 66.4 66.0
Source: OECD pension models.
system, there are also benefits without such links. In Australia, Denmark, Estonia, Hungary and the Slovak Republic, less than half of the retirement-income package is linked to life expectancy for the majority of workers.
This issue is particularly relevant for low-income workers. Cutting their already low benefits as life expectancy increases might risk a resurgence of old-age poverty. The analysis has shown that low earners in Chile, Finland, Mexico, Norway, Portugal and Sweden are protected by safety-net benefits. However, life-expectancy links are constant across the earnings range in Germany, Hungary, Italy, Poland and the Slovak Republic, although only in Italy and Poland are the links very strong.
This demonstrates that linking benefit levels to life expectancy must have limits. If benefit cuts push low earners onto social-assistance and other safety-net programmes in their retirement, this will offset some or all of the savings from the life-expectancy link in public earnings-related benefits (notional accounts, defined-benefit or points). It will mean additional public expenditure with private defined-contribution plans. Financial stability may be improved for parts of the pension system, but not for retirement-income provision as whole.
It is worth returning to the question raised in Section 5.1: why have countries overwhelmingly chosen to link benefit levels to life expectancy rather than pension age? If people simply continue to retire at the same age as present, then benefits will fall as life expectancy grows. The idea is that people will work longer to make up the shortfall. (The implications of this were explored in Section 5.8.) However, there is no mechanism in place to ensure that they do so.
A link of pension age to life expectancy should surely make at least as much or more intuitive sense to voters as a benefit link. It is also much better suited to countries with redistributive public pension programmes, such as Belgium, the Czech Republic, Canada, Ireland, Korea, Switzerland and the United Kingdom. The OECD’s periodic Economic Surveys
of member countries recommended a link between pension ages and life expectancy in ten of the 17 that addressed retirement-income policy (including Belgium, the Czech Republic, Hungary, the Netherlands, Slovenia and the United States). Reflecting the concerns expressed above, Poland and Sweden – with notional accounts and defined-contribution schemes – were advised in addition to increase pension ages in line with life expectancy. Only in the Slovak Republic and Slovenia was it proposed to have either pension ages or benefit levels linked to life expectancy.
On balance, a link between pension ages and life expectancy, rather than benefit levels, is the preferred policy. This, can, however, act in concert with benefit links in notional accounts, defined-contribution plans and through adjustments in other earnings-related schemes. The policy is most pressingly needed in countries with relatively high public pensions, where benefit levels are not linked to life expectancy and there are no plans to increase pension ages at present. This applies particularly to Austria, Greece, Luxembourg, Slovenia and Spain. In other cases – such as the Czech Republic, Hungary and the United States – this might be adopted once planned increases in pension age are in place.
Notes
1. This special chapter is based on earlier work, published as Whitehouse (2007, 2010). The analysis here has been updated with new information on mortality rates for 2010, to reflect systemic pension reforms – such as the introduction of notional accounts in Norway – and changes in parameters and rules in other countries between 2004 and 2008. The analysis has also been substantially extended. First, it includes the four new OECD member countries, three of which have mandatory defined-contribution plans of relevance to this chapter. Secondly, it now covers voluntary private schemes in seven OECD countries with widespread coverage of such plans. Thirdly, the impact of taxes and contributions on the results has been measured.
2. The reforms in Central and Eastern Europe have faced considerable pressure for reversal in the last two years. This is primarily for fiscal reasons, as the financial and economic crisis has significantly worsened public finances.
Estonia diverted contributions from defined-contribution plans to the government budget for part of 2009 and all of 2010. The current plan is that contributions will be resumed at some point in 2011 and that compensation will be paid into individual accounts for the diverted contributions in the period 2014-17.
Hungary has enacted a 14-month suspension of contributions to individual accounts for late 2010 and the whole of 2011. However, the government has recently proposed to appropriate the balances in individual accounts and permanently move contributions to the public sector (with the option to retain an individual account only available on extremely unfavourable terms.
The previous government of the Slovak Republic attempted in 2008 and 2009 to encourage people to switch back voluntarily to the public scheme, but few chose to do so. The new administration is less keen on reversing the reform. There have been a number of proposals for reversal in Poland, including a temporary diversion of contributions from individual accounts to the government. However, there has been no action as yet.
The calculations in this chapter assume that reforms are not reversed and temporary diversion of contributions to the government are reversed.
3. See Box 1.1 in OECD (2009) for detailed data on this trend.
4. See Whitehouse (2010) for a detailed analysis of notional accounts compared with other forms of public, earnings-related pension provision (that is, defined-benefit and points schemes).
5. See Department for Work and Pensions (2006). Note that the new government elected in May 2010 is conducting a review of this policy and has floated the idea of bringing forward the pension age increases. But there has been no mention of an automatic link between pension age and life expectancy.
6. Note that this was legislated in 2003 and does not form part of the recent pension reform. 7. For example, both the Czech Republic and New Zealand have seen a significant expansion of
voluntary defined-contribution plans: see the indicator of “Coverage of private pensions” in Part II.6. The policy of conditional indexation and valorisation in the quasi-mandatory occupational plans in the Netherlands introduces a significant “defined-contribution element” into these predominantly defined-benefit schemes. Adjustments to accrued pension rights and pensions in payment are now dependent on the financial performance of the pension funds’ investments. See the discussion in Box 1.1 of OECD (2009), Bikker and Vlaar (2006) and Dutch Central Bank (2007, 2010).
8. However, stochastic methods in demography are not really that new: they have been used since the late 1960s (Sykes, 1969, for example). Also, at the same time as Lee and Carter were developing their approach, McNown and Rogers (1989) devised a different stochastic technique.
9. The simulations were carried out using the standard “Monte-Carlo” method, which provides approximate solutions to a variety of mathematical problems by performing statistical sampling experiments. It uses pre-defined probability distributions of risk variables and sampling from a random number sequence to perform modelling over many simulations or trials. In this case, the underlying data are mortality rates in five-year age bands for the G7 countries from 1950 to 2002. After 2 000 draws, the results had converged.
10. See Box 3 in Whitehouse (2007) or Box 2 in Queisser and Whitehouse (2006) for a detailed explanation of how to calculate annuity factors.
11. See Whitehouse (2009) on the differences between indexation policy and practice. Parts I.2 and I.3 of OECD (2009) and Whitehouse et al. (2009) look at the impact of recent pension reforms on benefits for future retirees.
12. The contribution requirement is expressed in the number of quarters (trimesters) of contributions, so 43.75 years is possible within the current set-up. The exact nature of the calculation is unclear: these estimates are based on the standard Pensions at a Glance assumption of a full career starting at age 20. The Expected duration of retirement would increase by over four years without the adjustment: with the adjustments, the increase varies between approximately 0.5 and 2.0 years in the different mortality scenarios.
Note also that the OECD pension models are designed to calculate pension entitlements only on an annual basis. Therefore, the calculations for partial-year values are an approximation. 13. The one-third figure makes intuitive sense, since life expectancy at pensionable age is roughly half
of the 41-year contribution requirement at present. Three extra years’ life expectancy are therefore (roughly) divided into two extra contribution years and one additional year in retirement. 14. Note that values have been capped at 100%. The results for Portugal and Sweden would be greater
than 100% on the index formula. The curves for these two countries in Figure 5.3 go beyond the vertical of the pure defined-contribution model. They have a slight upward slope moving from left to right, indicating that pension wealth is slightly higher with lower life expectancy (rather than the same, as in the pure defined-contribution benchmark). The reasons for this are highly technical. The main one is due to the discount rate used in the calculation of benefits. Portugal’s adjustment is based on life expectancy alone, which implies a discount rate of zero in the annuity-factor calculation. Sweden uses a discount rate of 1.6%. This means that there is slight over-compensation for changes in life expectancy compared with the OECD standard discount rate of 2% (which is by no means meant to imply that 2% is the “correct” rate).
15. As explained in the previous note, the true index for Portugal and Sweden in gross terms exceeds 100%, while the net terms index is exactly 100% for Sweden and a little above 100% for Portugal. 16. The phrase “live longer, work longer” is borrowed from the title of OECD (2006).
17. There is no legislation for increases in pension ages for men in the countries illustrated in Table 5.2. Other countries with links to life expectancy in mandatory retirement income programmes plan to increase pension ages. Australia, Denmark and Germany will move normal pension age from 65 to 67 and Hungary from 62 to 65. (See “Trends in pensionable ages and life expectancy, 1950-2050” in Part I, Chapter 1; “Normal, early and late retirement” in Part II.2; and Chomik and Whitehouse, 2010.) The analysis presented in Table 5.2 only makes sense in cases where there are no plans to increase normal pension ages. It is also not relevant where benefit levels rather than qualifying conditions are linked to life expectancy (Denmark and France). 18. See “Normal, early and late retirement” in Part II.2.
References
Bikker, J.A. and P.J.G. Vlaar (2006), “Conditional Indexation in Defined Benefit Pension Plans”, Working Paper, No. 86, De Nederlandsche Bank, Amsterdam.
Chomik, R. and E.R. Whitehouse (2010), “Trends in Pension Eligibility Ages and Life Expectancy, 1950-2050”,
Social, Employment and Migration Working Paper, No. 105, OECD Publishing, Paris.
Department for Work and Pensions, United Kingdom (2006), Security in Retirement: Towards a New Pensions System, Cm 6841, The Stationery Office, London.
Dutch Central Bank (De Nederlandsche Bank) (2007), “Pension Contributions Stabilised, Indexation of Pensions Resumed”, Statistical Bulletin, pp. 19-22, March.
Dutch Central Bank (De Nederlandsche Bank) (2010), “Pension Indexation Lags Behind Rising Wages and Prices”, Statistical Bulletin, pp. 24-29, March.
Lee, R.D. and L. Carter (1992), “Modeling and Forecasting the Time Series of US Mortality”, Journal of the American Statistical Association, Vol. 87, No. 419, pp. 659-671.
McNown, R. and A. Rogers (1989), “Forecasting Mortality: A Parameterized Time Series Approach”,
Demography, Vol. 26, No. 4, pp. 645-660.
National Research Council (2000), Beyond Six Billion: Forecasting the World’s Population, Panel on Population Projections, in John Bongaarts and Rodolfo A. Butatao (eds.), Committee on Population, Commission on Behavioural and Social Sciences and Education, National Academy Press, Washington DC.
OECD (2006), Ageing and Employment Policies: Live Longer, Work Longer, OECD Publishing, Paris.
Oeppen, J. and J.W. Vaupel (2002), “Enhanced: Broken Limits to Life Expectancy”, Science, Vol. 296, pp. 1029-1031.
Queisser, M. and E. Whitehouse (2006), “Neutral or Fair? Actuarial Concepts and Pension-System Design”, Social, Employment and Migration Working Paper, No.40, OECD Publishing, Paris.
Sykes, Z.M. (1969), “Some Stochastic Versions of the Matrix Model for Population Dynamics”, Journal of the American Statistical Association, Vol. 44, pp. 111-130.
Whitehouse, E.R. (2007), “Life-Expectancy Risk and Pensions: Who Bears the Burden?”, Social, Employment and Migration Working Paper, No. 60, OECD Publishing, Paris.
Whitehouse, E.R. (2009), “Pensions, Purchasing-Power Risk, Inflation and Indexation”, Social, Employment and Migration Working Paper, No. 70, OECD Publishing, Paris.
Whitehouse, E.R. (2010), “Decomposing Notional Defined-Contribution Pensions: Experience of OECD Countries’ Reforms”, Social, Employment and Migration Working Paper, No. 109, OECD Publishing, Paris. Whitehouse, E.R., A.C. D’Addio, R. Chomik and A. Reilly (2009), “Two Decades of Pension Reform: What Has Been Achieved and What Remains To Be Done?”, Geneva Papers on Risk and Insurance, Vol. 34, pp. 515-535.