THEORETICAL AND COMPUTATIONAL BIOPHYSICS GROUP
2006 VMD SURVEY REPORT
D. BRANDON, M. PUNKE AND J. STONE
EXECUTIVE SUMMARY
The VMD 2006 Survey was announced on July 31 - August 3, 2006 to 26,079 registered users of VMD versions 1.8.3 and higher, and ran through August 7 of that year. Survey questions examined user satisfaction, the impact of the software on work quality, and user ratings of existing and planned features; demographic questions were asked as well.
A total of 1,596 usable responses were returned by the survey, yielding a response rate of 6.1%. Using standard test percentages, sample size calculations indicate that it can be said with 95% confidence that results for a given question fall within a +/-2.4% confidence interval (i.e., for any one question, the sample provides 95% confidence that the population response falls within plus or minus 2.4% of a given percentage). Please see the appendix on survey methodology below for more detail.
Survey results indicate that the majority of VMD users are affiliated with academic institutions (90%) and use VMD for research purposes (91%) with approximately one-fifth indicating research funded at least in part by NIH (21%). Most VMD users are the sole VMD user at their site (34%). A majority of VMD users consider
themselves to have an average level expertise with the software (52%) with slightly more users indicating a low level of expertise than a high level. Most survey
respondents (63%) had downloaded more than one version of VMD.
Most users are satisfied with VMD – 94% agreed or strongly agreed with the statement “I am satisfied with VMD”.
VMD was judged to have a positive impact on work quality – 88% of respondents agreed or strongly agreed with the statement “VMD has improved the quality of my work”.
A majority of users agree that not having VMD available would have a negative impact on their productivity – 78% agreed or strongly agreed with the statement “Not having VMD available (e.g., in case of discontinued funding of VMD development) would negatively impact my scientific productivity”.
O V E R V I E W
VMD (Visual Molecular Dynamics) is a molecular visualization program for displaying, animating, and analyzing large biomolecular systems using 3-D
graphics and built-in scripting. VMD supports computers running MacOS-X, Unix, or Windows, is distributed free of charge, and includes source code. The VMD home page at the TCBG web site, http://www.ks.uiuc.edu/Research/vmd/, provides more information about the program. The VMD 2006 survey is part of an ongoing effort (similar surveys were conducted in 2000 and 2003) to ensure that VMD is up to date, relevant, and of high quality by collecting and analyzing user opinion about the application. VMD users were identified via registration records, and contacted via email with requests that they complete an on-line survey about VMD (see locations below for a copy of the survey) during August, 2006. The following report details the results and administration of the survey.
VMD 2006 Survey (complete copy)
A link to the survey form the users completed is available below; questions are also listed in the appendix. Note that for analysis, interpretation and review purposes all references to the items within the report are based on the numbering of the items as used in the original survey.
VMD 2006 Survey
http://www.ks.uiuc.edu/Research/vmd/survey/report2006/
Table of Contents
• VMD User Profile………..……….. 4
• Ratings of Satisfaction………..………. 7
• Ratings of Impact on Work Quality ………...……….……….. 8
• Ratings of Impact of VMD Unavailability……….. 9
• Ratings of Support, Documentation, and Overall Usability……….. 10
• Ratings of Planned Items……….……….. 12
• Ratings by NIH Funding Status………. 14
• Ratings by Repeat User Status 16 • Appendix: Survey Methodology ………... 18
VMD USER PROFILE
User profile characteristics of those answering the survey are illustrated below:
90% of users have academic affiliations.
21% are funded at least partially by NIH.
91% use VMD for research purposes.
34% are the sole user of VMD at their site.
52% identified themselves as average-level users of the software.
56% indicated using VMD for all or most of their molecular visualization tasks.
26% of users also use NAMD.
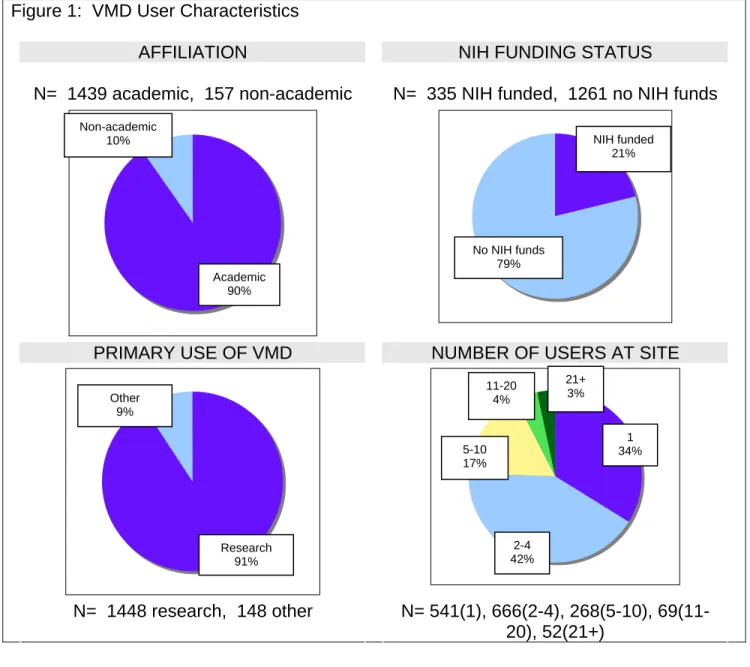
62% have used the VMD tutorial. Figure 1: VMD User Characteristics
AFFILIATION NIH FUNDING STATUS
N= 1439 academic, 157 non-academic N= 335 NIH funded, 1261 no NIH funds
PRIMARY USE OF VMD NUMBER OF USERS AT SITE
N= 1448 research, 148 other N= 541(1), 666(2-4), 268(5-10), 69(11-20), 52(21+) Non-academic 10% NIH funded 21% No NIH funds 79% Academic 90% 21+ 3% 11-20 4% Other 9% 1 34% 5-10 17% 2-4 42% Research 91%
Figure 1: VMD User Characteristics, continued
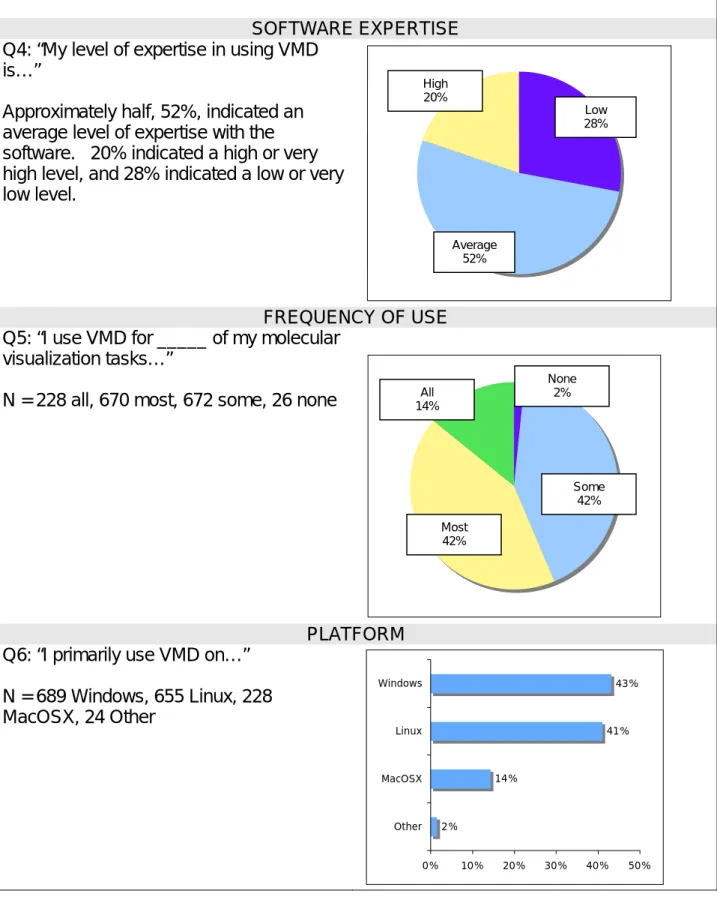
SOFTWARE EXPERTISE Q4: “My level of expertise in using VMD
is…”
Approximately half, 52%, indicated an average level of expertise with the software. 20% indicated a high or very high level, and 28% indicated a low or very low level.
FREQUENCY OF USE Q5: “I use VMD for _____ of my molecular
visualization tasks…”
N = 228 all, 670 most, 672 some, 26 none
PLATFORM Q6: “I primarily use VMD on…”
2% 14% 41% 43% 0% 10% 20% 30% 40% 50% Other MacOSX Linux Windows N = 689 Windows, 655 Linux, 228 MacOSX, 24 Other Some 42% None 2% Most 42% All 14% Average 52% Low 28% High 20%
Figure 1: VMD User Characteristics, continued
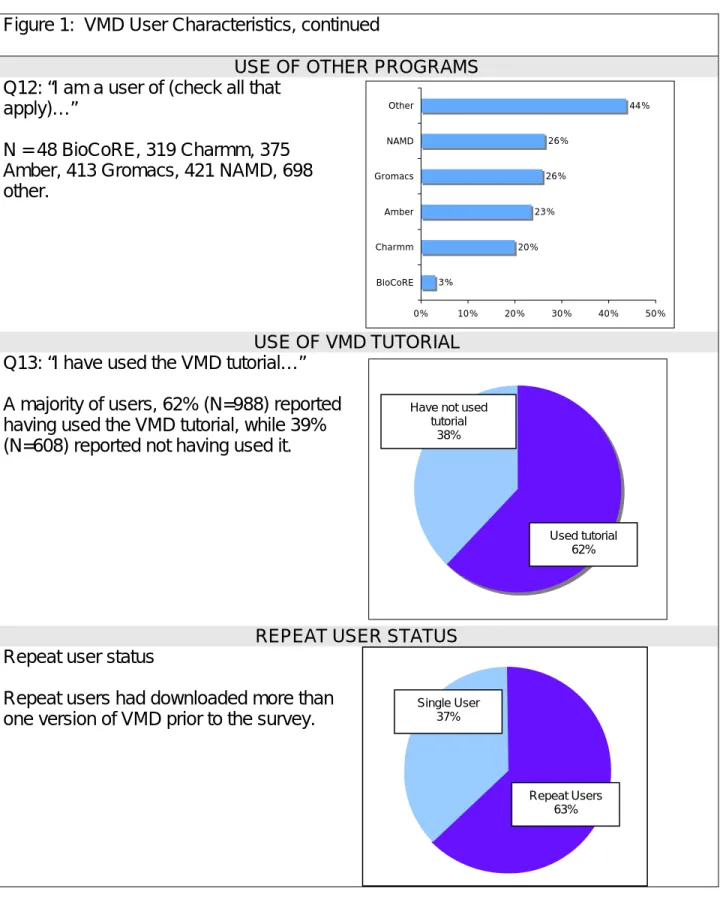
USE OF OTHER PROGRAMS Q12: “I am a user of (check all that
apply)…”
N = 48 BioCoRE, 319 Charmm, 375 Amber, 413 Gromacs, 421 NAMD, 698 other. 3% 20% 23% 26% 26% 44% 0% 10% 20% 30% 40% 50% BioCoRE Charmm Amber Gromacs NAMD Other USE OF VMD TUTORIAL Q13: “I have used the VMD tutorial…”
A majority of users, 62% (N=988) reported having used the VMD tutorial, while 39% (N=608) reported not having used it.
REPEAT USER STATUS Have not used
tutorial 38%
Used tutorial 62%
Repeat user status
Repeat users had downloaded more than one version of VMD prior to the survey.
Repeat Users 63% Single User
R A T I N G S O F S A T I S F A C T I O N
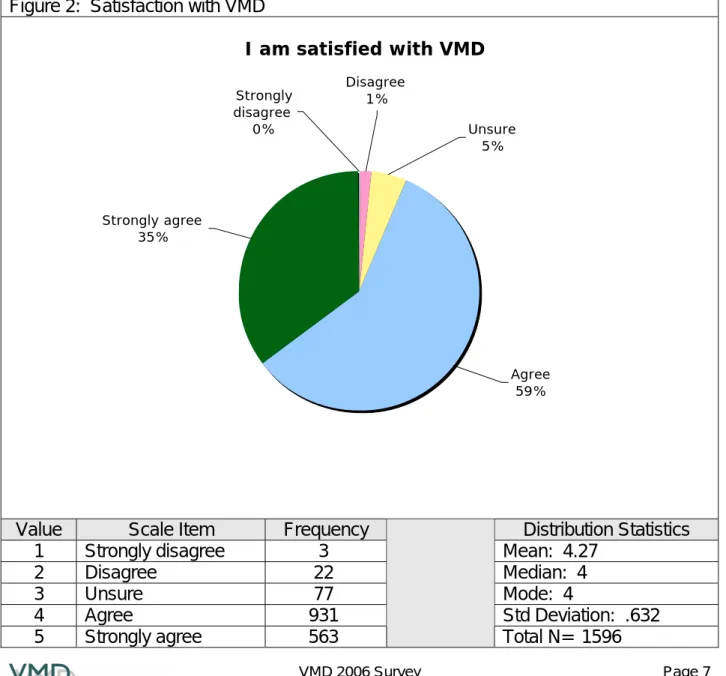
Most users are satisfied with VMD – 94% agreed or strongly agreed with the statement “I am satisfied with VMD” (Q15). See Figure 2.
Mean satisfaction was 4.27 on a 5-point scale (1=strongly disagree, 5=strongly agree). See Figure 2.
Figure 2: Satisfaction with VMD
I am satisfied with VMD
Value Scale Item Frequency Distribution Statistics
1 Strongly disagree 3 Mean: 4.27
2 Disagree 22 Median: 4
3 Unsure 77 Mode: 4
4 Agree 931 Std Deviation: .632
5 Strongly agree 563 Total N= 1596
Disagree 1% Strongly disagree 0% Unsure 5% Strongly agree 35% Agree 59%
R A T I N G S O F I M P A CT O N W OR K Q U A L I T Y
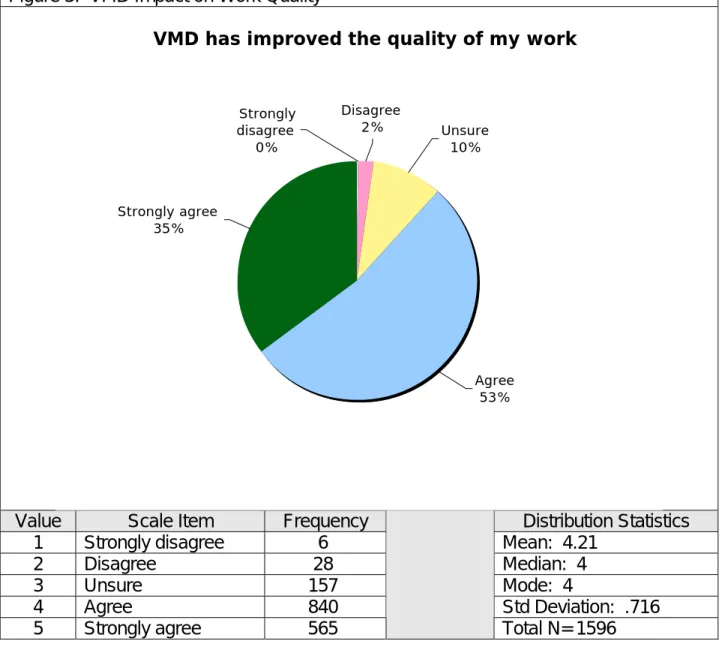
VMD was judged to have a positive impact on work quality – 88% of respondents agreed or strongly agreed with the statement “VMD has improved the quality of my work” (Q16). See Figure 3.
The mean response was 4.21 on a 5-point scale (1=strongly disagree, 5=strongly agree. See Figure 3.
Figure 3: VMD Impact on Work Quality
Value Scale Item Frequency Distribution Statistics
1 Strongly disagree 6 Mean: 4.21
2 Disagree 28 Median: 4
3 Unsure 157 Mode: 4
4 Agree 840 Std Deviation: .716
5 Strongly agree 565 Total N= 1596
VMD has improved the quality of my work
Disagree 2% Strongly disagree 0% Unsure 10% Strongly agree 35% Agree 53%
R A TIN GS O F IM P A CT OF V MD U NA V AILABILITY
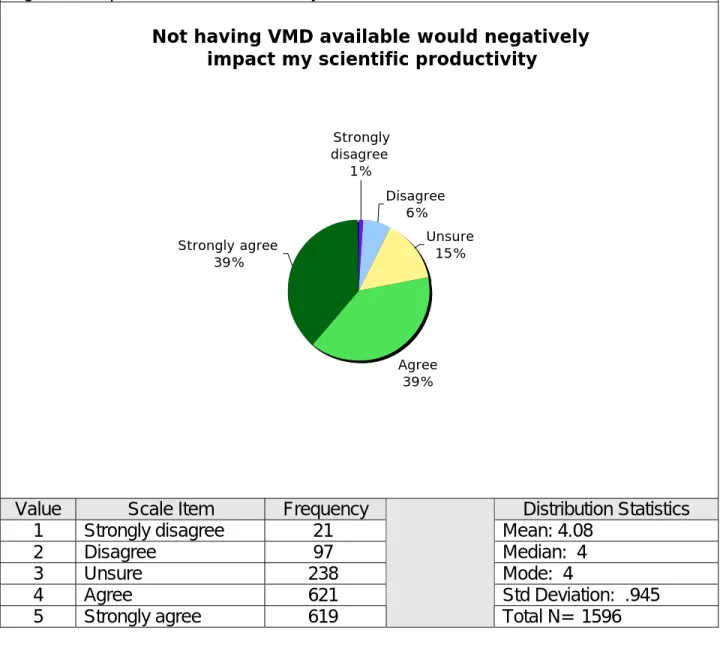
A majority of users agreed that not having VMD available would have a negative impact on their productivity – 78% agreed or strongly agreed with the statement “Not having VMD available (e.g., in case of discontinued funding of VMD development) would negatively impact my scientific productivity” (Q14). See Figure 4.
The mean response was 4.08 on a 5-point scale (1=strongly disagree, 5=strongly agree). See Figure 4.
Figure 4: Impact of VMD Unavailability
Not having VMD available would negatively impact my scientific productivity
Value Scale Item Frequency Distribution Statistics
1 Strongly disagree 21 Mean: 4.08
2 Disagree 97 Median: 4
3 Unsure 238 Mode: 4
4 Agree 621 Std Deviation: .945
5 Strongly agree 619 Total N= 1596
Disagree 6% Unsure 15% Agree 39% Strongly disagree 1% Strongly agree 39%
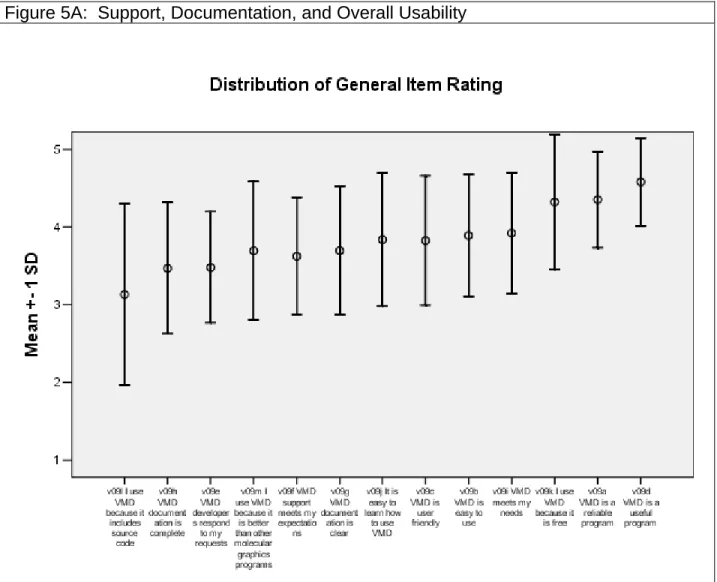
R A T I N G S O F S U P PO R T , D OC U M E N T A T I O N , A ND O V E R A L L U S A BI L I T Y Responses to usability, support and documentation items (Q9) indicated why
respondents use VMD, and their agreement with statements about specific aspects of the program.
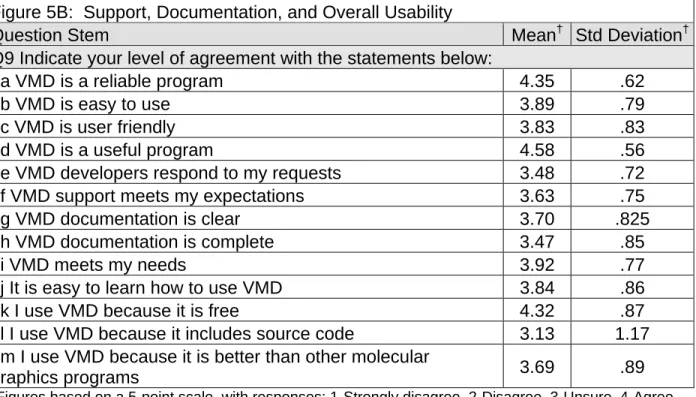
The three highest rated qualities are: VMD is a useful program (M=4.58), VMD is a reliable program (M=4.35), and VMD is free (M=4.32). See Figures 5A and 5B.
Figure 5A: Support, Documentation, and Overall Usability
Figure 5B: Support, Documentation, and Overall Usability
Question Stem Mean† Std Deviation†
Q9 Indicate your level of agreement with the statements below:
9a VMD is a reliable program 4.35 .62
9b VMD is easy to use 3.89 .79
9c VMD is user friendly 3.83 .83
9d VMD is a useful program 4.58 .56
9e VMD developers respond to my requests 3.48 .72
9f VMD support meets my expectations 3.63 .75
9g VMD documentation is clear 3.70 .825
9h VMD documentation is complete 3.47 .85
9i VMD meets my needs 3.92 .77
9j It is easy to learn how to use VMD 3.84 .86
9k I use VMD because it is free 4.32 .87
9l I use VMD because it includes source code 3.13 1.17
9m I use VMD because it is better than other molecular
graphics programs 3.69 .89
†
Figures based on a 5-point scale, with responses: 1-Strongly disagree, 2-Disagree, 3-Unsure, 4-Agree, 5-Strongly agree.
R A T I N G S O F P L A NN E D I T E MS
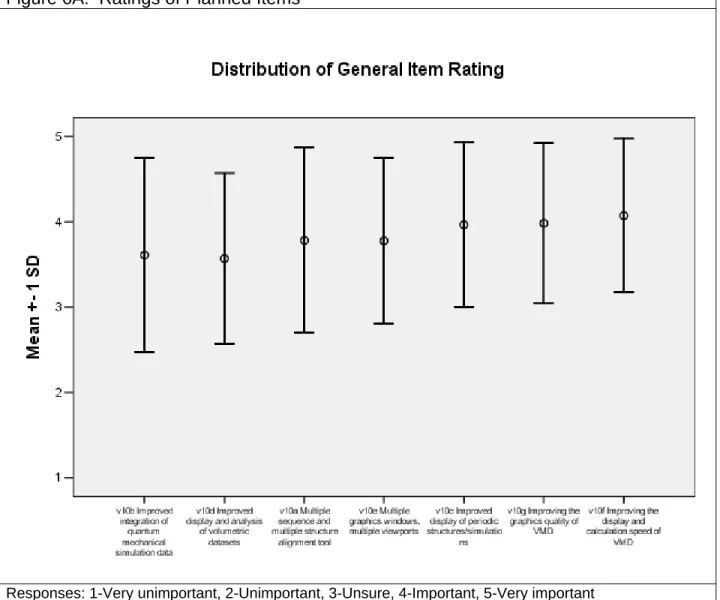
Users were asked to rate the importance of features planned for VMD as a means of identifying priority items for future development. In Q10, a list of 7 potential VMD features was provided to respondents, who were asked to “Rate the importance of these planned features to your work” using a point scale (1-very unimportant, 5-very important). In Q11, participants were asked to “Select the PLANNED feature that should have the highest priority for development.”
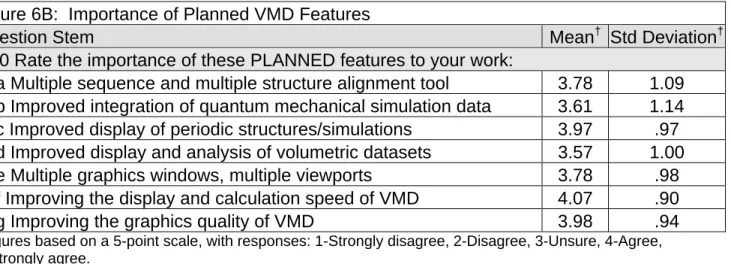
The three highest rated planned items are: improving the display and calculation speed (M=4.07), improving the graphics quality (M=3.98), and improving the display of periodic structures/simulations (M=3.97). See Figures 6A and 6B. When asked to choose the highest priority item, most (24%) chose the multiple sequence and multiple structure alignment tool. See Figure 6C.
Figure 6A: Ratings of Planned Items
Figure 6B: Importance of Planned VMD Features
Question Stem Mean† Std Deviation†
Q10 Rate the importance of these PLANNED features to your work:
10a Multiple sequence and multiple structure alignment tool 3.78 1.09 10b Improved integration of quantum mechanical simulation data 3.61 1.14
10c Improved display of periodic structures/simulations 3.97 .97
10d Improved display and analysis of volumetric datasets 3.57 1.00
10e Multiple graphics windows, multiple viewports 3.78 .98
10f Improving the display and calculation speed of VMD 4.07 .90
10g Improving the graphics quality of VMD 3.98 .94
†
Figures based on a 5-point scale, with responses: 1-Strongly disagree, 2-Disagree, 3-Unsure, 4-Agree, 5-Strongly agree.
Figure 6C: Planned VMD Feature with Highest Priority for Development
Question Stem Count Percent
Q11Select the PLANNED feature that should have the highest priority for development: 10a Multiple sequence and multiple structure alignment tool 383 24.0% 10b Improved integration of quantum mechanical simulation data 301 18.9%
10c Improved display of periodic structures/simulations 223 14.0%
10d Improved display and analysis of volumetric datasets 113 7.1%
10e Multiple graphics windows, multiple viewports 113 7.1%
10f Improving the display and calculation speed of VMD 253 15.9%
R A TIN GS B Y NIH FUN DI NG ST A TUS
Users were asked to answer ‘yes’ or ‘no’ to the question “The work I do with VMD is funded (at least partially) by NIH” (Q3).
Most users, regardless of NIH funding, agreed or strongly agreed with the statement “I am satisfied with VMD” (Q15). See Figure 7A.
A majority of both NIH funded (92%) and those with no NIH funds (87%) agreed or strongly agreed with the statement “VMD has improved the quality of my work” (Q16). See Figure 7B.
Figure 7A: Satisfaction by NIH Funding Status
I am satisfied with VMD
93% 94%
0% 100%
NIH funded No NIH funds
Percent agreeing
Distribution Statistics
Mean/Std Deviation NIH funded M=4.30, SD=.61 No NIH funds M=4.26, SD=.64
Scale Responses† SD D U A SA
NIH funded (N/%) 0/0% 2/1% 21/6% 185/55% 127/38%
No NIH funds (N/%) 3/0% 20/2% 56/4% 746/59% 436/35%
†
Responses: 1-Strongly disagree, 2-Disagree, 3-Unsure, 4-Agree, 5-Strongly agree. Total N: NIH funded, 335; no NIH funds, 1261.
Figure 7B: Impact on Work Quality by NIH Funding Status
VMD has improved the quality of my work
92%
87%
0% 100%
NIH funded No NIH funds
Percent agreeing
Distribution Statistics
Mean/Std Deviation NIH funded M= 4.34, SD=.64 No NIH funds M=4.17, SD=.73
Scale Responses† SD D U A SA
NIH funded (N/%) 0/0% 2/1% 25/7% 164/49% 144/43%
No NIH funds (N/%) 6/0% 26/2% 132/11% 676/54% 421/33%
†
Responses: 1-Strongly disagree, 2-Disagree, 3-Unsure, 4-Agree, 5-Strongly agree. Total N: NIH funded, 335; no NIH funds, 1261.
R A T I N G S B Y R E P EA T U S E R S T A T U S
Repeat users are those survey respondents who downloaded more than one version of VMD, while single users had at the time of the survey downloaded only one
version of VMD.
Most users, regardless of having used multiple or single versions of VMD, agreed or strongly agreed with the statement “I am satisfied with VMD” (Q15). See Figure 8A.
A majority of both repeat (91%) and single users of VMD (83%) agreed or strongly agreed with the statement “VMD has improved the quality of my work” (Q16). See Figure 8B.
Figure 8A: Satisfaction by Repeat User Status
I am satisfied with VMD
95%
91%
0% 100%
Repeat User
Single User
P
e
rc
e
n
t a
g
re
e
in
g
Distribution StatisticsMean/Std Deviation Repeat user M=4.32, SD=.62 Single use M=4.19, SD=.65
Scale Responses† SD D U A SA
Repeat user (N/%) 2/0% 12/1% 33/3% 571/57% 384/38%
Single use (N/%) 1/0% 10/2% 44/7% 360/61% 179/30%
†
Responses: 1-Strongly disagree, 2-Disagree, 3-Unsure, 4-Agree, 5-Strongly agree. Total N: Repeat users, 1002; single users, 594.
Figure 8B: Impact on Work Quality by Repeat User Status
VMD has improved the quality of my work
91%
83%
0% 100%
Repeat User Single User
P e rc en t ag reei n g Distribution Statistics Mean/Std Deviation Repeat user M= 4.29,
SD=.70 Single use M=4.07, SD=.73 Scale Responses† SD D U A SA Repeat user (N/%) 2/0% 17/2% 76/8% 499/50% 408/41% Single user (N/%) 4/1% 11/2% 81/14% 341/57% 157/26% †
Responses: 1-Strongly disagree, 2-Disagree, 3-Unsure, 4-Agree, 5-Strongly agree. Total N: Repeat users, 1002; single users, 594.
APPENDIX: SURVEY METHODOLOGY
Following are details about the administration of the survey, including survey method, target population, survey schedule and response rates, sample validity, and questions used on the survey.
Survey Method
The 2006 VMD User Survey was conducted with the assistance of a commercial survey service (QuestionPro, www.questionpro.com). Population members received an e-mail solicitation asking them to complete an on-line survey, with the link to the survey
containing information about the user. Participants were required to complete all items on the survey form and submit their responses; upon submission, participants were thanked for their participation.
Target Population
The target population was defined as those downloading VMD versions 1.8.3 or higher. Version 1.8.3 was released in February, 2005; the current version of VMD is 1.8.4. Survey Schedule and Response Rates
The target population of 26,079 registered VMD users was contacted over the July 31 – August 3 period to complete the survey. The survey software required lists smaller than the total population, hence a small test sample was sent out initially on August 31, followed by two larger lists on August 2 and August 3. By August 7, 2006, 1608
responses had been collected, representing a sufficient sample size for the population, and a response rate of 6.2 percent.
Data Editing
12 Duplicate responses were deleted from the dataset. Duplicates were those instances in which there was more than one response for a person, based on an assigned ID number incorporated in the e-mail solicitation. There were no incomplete records, as the survey software required that all questions be filled. Deletions left 1596 (out of a total of 1608) valid records for analyses.
The final response rate, after accounting for deleted records, is 6.1%.
Sample Validity
The validity of a sample size for representing an entire population is always a concern in survey research. Sample size calculators can provide measures of confidence intervals
(+/- figures, i.e. ‘margin of error’) and confidence level measures (how certain you can be that an answer falls within a confidence interval). For a sample of 1596 and a
population of 26079, using a standard test percentage of 50%, sample size calculations indicate that it can be said with 95% confidence that a given result for a question falls within a +/- 2.38% confidence interval. (Figures were generated using Survey System sample size calculator: http://www.surveysystem.com/sscalc.htm).
Question Sets
To aid in interpreting survey results, it is useful to view the question stems viewed by survey participants. Below are the survey questions, grouped by purpose:
Demographic/User Information Questions:
Q. # Topic Question Stem Scale
1 E-mail address Auto-completed, but users could change Text box 2 Affiliation Academic, Government, Industry, Other
(specify)
Select one, Text box (other) 3 Funding My work in BioCoRE is funded (at least
partially) by NIH
Select Yes or No 4 VMD expertise My level of expertise in using VMD is 1-5 scale, very
low to very high
5 Frequency of
use
I use VMD for ____ of my (molecular dynamics or molecular) visualization tasks: none, some, most, all
Select one
6 Platform I primarily use VMD on: Windows, MacOS X, Linux, Other
Select one 7 Primary use I use VMD primarily for: Research,
Teaching, Business, Personal
Select one
8 Number of
users
The number of people using VMD at my site is: 1, 2-4, 5-10, 11-20, 21 or more
Evaluation Questions:
Q. # Question Stem Scale
14 Not having VMD available (e.g., in case of discontinued funding of VMD development) would negatively impact my scientific productivity
15 I am satisfied with VMD
16 VMD has improved the quality of my work
1-5 scale,
strongly agree to strongly disagree
17 What suggestions do you have for improving VMD and VMD support:
Text area
Ratings of Support, Documentation, and Overall Usability: All ratings of existing
items used the same 1-5 scale, ranging from strongly disagree to strongly agree. Q. # Question Stem
9 Rate your agreement with each the following statements: 9a VMD is a reliable program
9b VMD is easy to use 9c VMD is user friendly 9d VMD is a useful program
9e VMD developers respond to my requests 9f VMD support meets my expectations 9g VMD documentation is clear
9h VMD documentation is complete 9i VMD meets my needs
9j It is easy to learn how to use VMD 9k I use VMD because it is free
9l I use VMD because it includes source code
9m I use VMD because it is better than other molecular graphics programs
Importance of Planned Features: All planned items used the same 1-5 scale ranging
from very unimportant to very important. Q. # Question Stem
10 Rate the importance of VMD planned features to your work: 10a Multiple sequence and multiple structure alignment tool 10b Improved integration of quantum mechanical simulation data 10c Improved display of periodic structures/simulations
10d Improved display and analysis of volumetric datasets 10e Multiple graphics windows, multiple viewports
10f Improving the display and calculation speed of VMD 10g Improving the graphics quality of VMD