O R I G I N A L R E S E A R C H
Open Access
Development of a WAMS based test
platform for power system real time
transient stability detection and control
Jinquan Zhao
1*, Yujie Zhang
1, Pan Zhang
1, Xiaoming Jin
2and Chao Fu
2Abstract
The real-time transient stability detection and emergency control technology based on wide area response has become a hot research area in power system stability studies. Several different technologies have been proposed, but lots of problems remain to be solved before they can be applied in practice. A wide area measurement system (WAMS) based test platform is developed for transient stability detection and control. The design as well as main function modules of the platform are introduced. In addition, three generator power angle prediction methods and six response based transient instability detection technologies are given. Results of engineering application
demonstrate that the developed test platform can provide a real-time operation environment, which can effectively compare and analyze the validity and practicability of these transient stability detection technologies. Based on the measured perturbed trajectories from actual power systems or the Real-Time Digital Simulators (RTDS), the platform can realize the assessment and visual result presentation of various responses from different transient instability detection technologies. The test platform can be applied to different power systems and it is convenient to embed new transient instability detection modules. Meanwhile some deficiencies and shortcomings in engineering application are pointed out and corresponding suggestions are given. In conclusion, the hardware and software structure, function modulus and engineering applications are presented. The application in actual power systems shows that it has a good application perspective.
Keywords:Test platform, Transient instability detection and control, PMU, WAMS
Introduction
With the wide application of phasor measurement units (PMU) and wide area measurement system (WAMS) in power system, the WAMS based power system real-time transient instability detection and emergency control has become a hot research area.
The real-time measurements based transient instability detection has been limited to the post-fault power angle trajectories for quite a long term. In reference [1–4], the power angle difference between any two generators is used as a transient instability indicator. If it exceeds a predefined threshold value, the power system is consid-ered to enter transient instability status.
At present, there have been a lot of theoretical achievements in the field of the wide area response
based power system security and stability control tech-nology [5–10]. Various generator power angle prediction techniques [11–14] and different transient instability de-tection technologies [15–18] were proposed. Reference [15] proposed an emergency EEAC based transient instability detection technique by using the measured trajectory. Reference [16] proposed a transient instability detection criterion based on the geometric feature of phase plane trajectory. Reference [17] proposed a transi-ent instability detection technology by means of the transient unbalance energy variation rate of the most seriously perturbed generator. Reference [18] proposed a transient instability detection criterion based on per-turbed voltage trajectory. However, the response-based transient instability detection technologies have not been applied in actual power systems, lots of problems need to be solved such as the integrity of wide area measure-ment information, the tolerance of bad data, the * Correspondence:[email protected]
1College of Energy & Electrical Engineering, Hohai University, Nanjing, China Full list of author information is available at the end of the article
influence of data transmission delay, the accuracy and rapidity of detection as well as the emergency control schemes. Therefore it is necessary to analyze and com-pare the applicability and validity in actual power sys-tems with different operating situations.
Considering that there has been no such test platform which can be used to compare and analyze different transient instability detection and control technologies in the real-time operating environment, a WAMS based power system transient stability detection and control test platform is developed. Several existing transient instability detection and control techniques are imple-mented on this platform. The platform realizes the com-prehensive analysis and comparison of various detection techniques. and provides a test and simulation platform for these transient stability and control technologies based on WAMS before they are applied in actual power systems. The frame structure of the platform, main func-tion modules and its engineering applicafunc-tion are pre-sented in this paper. Meanwhile some deficiencies and shortcomings in engineering application are pointed out and corresponding suggestions are given.
In Design of the platform, the design of the test platform is introduced. Observation substations selection module describes the implementation of main function modules including generator angle prediction, transient instability detection based on wide area response and emergency control. Engineering applications are presented in Data acquisition module. Observed substation access and monitoring module gives the conclusions.
Design of the platform
Overall frame structure
The WAMS based power system transient stability de-tection and control test platform mainly implements various response based transient instability detection techniques. The measured data can be obtained from the real-time data environment, such as actual power systems or real-time digital simulation platform (like RTDS).
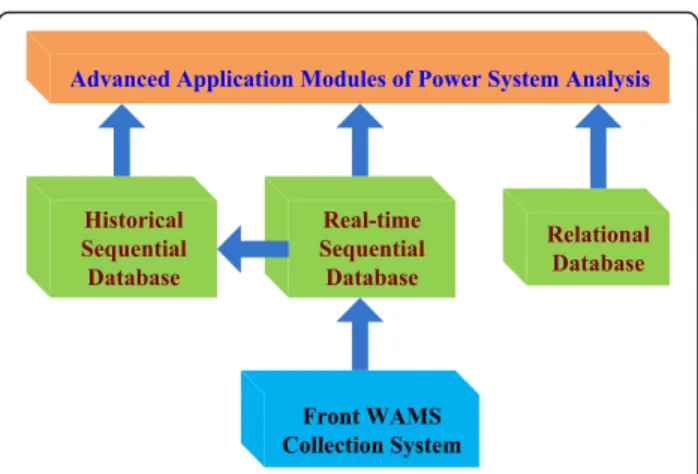
The master station of our platform consists of basic modules and application modules. Basic modules include the front data collection module of PMU, the real-time se-quential database, the historical sese-quential database and the relational database. The frame structure of WAMS modules is shown in Fig. 1. The temporal sequential database utilizes dedicated data storage model to provide better service of data storage and query.
The response based transient stability detection and control modules are integrated in the master station of our platform as part of the advanced application mod-ules. In addition, application modules also include basic data modules such as real-time message of PMU and access to substations.
The main characteristics of the platform are summa-rized as follows.
Implementing closed-loop test to evaluate different wide area response based power system transient instability detection and control technologies based on real-time data and offline contingency simulation.
Providing a concise and intuitive visual interface to present real-time substation monitoring, generator power angle prediction curves, various transient instability detection results and platform parameters setting.
Taking the most advantage of the service resources provided by WAMS including parameters and topological structure of the power system as well as real-time measured or historical storage data.
Good data compatibility. It provides general data interface, supporting real-time measured data from actual power systems or RTDS platform and off-line results from simulation or other software.
Good flexibility and extendibility. It provides open application programming interface (API) for power system operators or tester. It is convenient to update the existing modules or develop and add new ones to the platform.
Hardware and software structure
The test platform consists of hardware devices and soft-ware modules. The hardsoft-ware and softsoft-ware structure dia-gram is shown in Fig. 2. Hardware includes the master server, the visual workstation and communication inter-face as well as substation actuating devices. Software modules include the data acquisition module, the station monitoring module, the generator power angle predic-tion module, the wide area response based transient
instability detection module and the emergency control module.
Software modules are integrated in the master station server to get data from the temporal sequential database. The workstation provides human-computer interactive operation and presentation of the test results. Through the communication interface, the real-time data is trans-mitted to the real-time sequential database located in the master server. The actuating device carries out the control instructions from the master server.
Data interaction of the platform
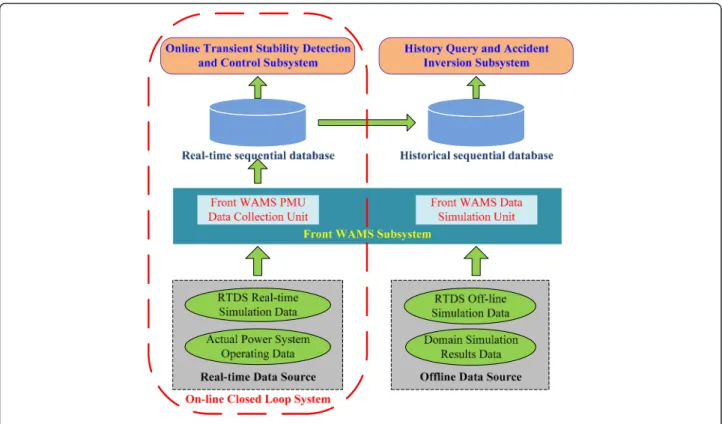
The advanced application modules of the platform consist of the online transient stability detection & control tem offline history query & contingency simulation subsys-tem. The data interaction diagram is shown in Fig. 3.
The general data interface module is developed to meet requirements of the online test and offline simula-tion. The interface supports real-time online data and offline data files exported from the RTDS platform or other time-domain simulation software. The real-time measured data and offline simulation data are stored in the real-time sequential database and then are trans-ferred to the historical database. The former is measured directly by the front WAMS data collection device (PMU) and the latter is converted by the front WAMS data simulation module.
Data and application programming interface
Modules of the test platform are designed according to the principle with function decoupling and modularization. It
provides an open and flexible development environment (namely ‘plug and play’) for power system designers and operators. In addition, A large amount of available data such as parameters and model of power systems (stored in relational database), graphics library for interface development and measured data acquisition interface can be utilized directly. Considering that the generator power angle prediction and response based transient instability detection modules share the same data and application programming interface, it is convenient to update the existing modules or develop new modules and add them to the test platform in order to meet the multiple test requirements.
Main function modules
1. Observation substations selection module The real-time measured data of power systems is tremendous. However, transient instability detection should be carried out with measurement data from the observed substations in actual engineering application, as less as possible. Thus, to determine which observed station is the most sensitive one to the disturbance characteristics is one of the most challenging problems concerned by the system operators. Therefore, the generator and bus substation selection module is designed, by which different generators and buses can be selected to formulate the observation scheme. Power system operators can analyze the applicability and validity of these transient instability detection technologies in different observation schemes.
2. Data acquisition module
The data acquisition module of the test platform is designed to provide real-time measured data and historical simulation data for the advanced application modules. In addition, parameter and model as well as the topological structure information of the power system are also available. The list of the data provided by the platform is shown in Table1.
3. Observed substation access and monitoring module To enable a wide application in different power systems, the substation access module is designed, by which new generators and bus substations can be accessed to the front WAMS collection devices. In
terms of different power systems, operators need to re-access the generators and bus substations and update the power grid parameters and model. The observed substation monitoring module is designed to present the real-time curve and data monitoring of these observed generators and bus substations. The monitoring data are shown in Table2.
Methods
Generator power angle prediction module
In order to analyze and study the influence of generator power angle prediction on transient instability detection, the power angle prediction module is designed with polynomial model based prediction, auto-regressive prediction method and trigonometric function based prediction [11–13].
Table 1List of the data provided by the platform
Data Attribution Source
Inertia constant generator relational database
Base voltage generator/bus relational database
Power angle generator temporal sequential database
Mechanical power generator temporal sequential database
Electric power generator temporal sequential database
Three-phase voltage amplitude bus temporal sequential database
Fig. 3Data interaction diagram of the platform
Table 2Monitoring data of generators and bus Stations
Station type Monitoring data
Observed generator power angle
mechanical power
electric power
Observed bus A-phase voltage amplitude
B-phase voltage amplitude
1. Polynomial model based prediction method
The polynomial model for rotor angle prediction can be expressed as follows:
_δð Þ ¼t a
0þa1tþa2t2þ⋯þantn ð1Þ
where_δð Þt is the predicted rotor angle at moment
t. AN= [a0,a1,a2,⋯,an]Tis the parameter vector of the polynomial model.nis the model order. AssumingΔtas the sampling period, observation vector isY(N) = [δ(0),δ(Δt),⋯δ(NΔt)]T. The parameter vector can be solved by using the least square method as follows.
AN ¼PNHTð ÞN ⋅Y Nð Þ ð2Þ
Where
H Nð Þ ¼
1 0 0 ⋯ 0
1 Δt ð ÞΔt 2 ⋯ ð ÞΔt n
⋯ ⋯ ⋯ ⋯ ⋯
1 NΔt ðNΔtÞ2 ⋯ ðNΔtÞn 2 6 6 4 3 7 7 5 ð3Þ
PN¼ HTð ÞN H Nð Þ
−1
ð4Þ
If vectorANis obtained, the value of rotor angle in the future can be calculated by Eq. (5).
_δðkΔtÞ ¼a
0þa1kΔtþ⋯þanðkΔtÞn
k¼Nþ1;Nþ2;⋯;Nþl
ð5Þ
wherelis the number of predicted data.
When the new rotor angle measurement is updated, the rolling prediction method can be used to form the new observation vectorY(N+ 1) and calculate the new parameter vectorAN+ 1by Eq. (2). Matrix
H(N) maintains unchanged since it is irrelevant with the measurements.
2. Trigonometric function model based prediction method
The trigonometric function model for the perturbed rotor angle trajectory prediction can be described as.
_δð Þ ¼t X∞
n¼0
ancosntþbnsinnt ð6Þ
where n is the model order,AN= [a0,a1,b1,⋯,an,bn]T is the parameter vector of the trigonometric function model.
The measurement matrix can be expressed as.
H Nð Þ ¼
1 1 0 1 0 ⋯
1 cosð ÞΔt sinð ÞΔt cos 2ðΔtÞ sin 2ð ΔtÞ ⋯ 1 cos 2ð ΔtÞ sin 2ð ΔtÞ cos 4ðΔtÞ sin 4ð ΔtÞ ⋯
⋯ ⋯ ⋯ ⋯ ⋯ ⋯
1 cosðNΔtÞ sinðNΔtÞ cos 2ð NΔtÞ sin 2ð NΔtÞ ⋯
2 6 6 6 6 4 3 7 7 7 7 5
ð7Þ
If parameter vectorANis estimated by using the least square method as Eq. (2), the predicted values of rotor angle are calculated by Eq. (8).
_δðkΔtÞ ¼X∞
n¼0
ancosn kð ΔtÞ þbnsinn kð ΔtÞ
k¼Nþ1;Nþ2;⋯;Nþl
ð8Þ
wherelis the number of predicted data.
As same as the polynomial model based prediction method, if a new measurement is obtained, the measurement vector is updated and then the latest predicted value can be figured out by rolling prediction.
3. Auto regression model based prediction method The auto regression model of the generator angle can be written as.
_δð Þ ¼t α
1δðt−1Þ þα2δðt−2Þ þ⋯þαnδðt−nÞ ð9Þ
where
AN= [a1,a2,⋯,an]Tis the parameter vector. φt= [δ(t−1),δ(t−2),⋯,δ(t−n)]Tis the measured rotor angle vector,nis the model order.
The observation vector can be written asY(N) = [δ(1),δ(2),⋯,δ(N)]T.
Parameter vectorANcould be calculated by Eq. (2). The observation matrix is.
H Nð Þ ¼
δð Þ0 δð Þ−1 ⋯ δð1−nÞ
δð Þ1 δð Þ0 ⋯ δð2−nÞ
⋯ ⋯ ⋯ ⋯
δðN−1Þ δðN−2Þ ⋯ δðN−nÞ 2 6 6 4 3 7 7 5 ð10Þ
Finally, the predicted value of generator angle can be obtained by Eq. (9).
_δðNþ1Þ ¼a1δð Þ þN a1δðN−1Þ þ⋯þa
nδðNþ1−nÞ
_δðNþ2Þ ¼a1_δðNþ1Þ þa1δð Þ þN ⋯þa
nδðNþ2−nÞ ⋯
_δðNþlÞ ¼a1_δðNþl−1Þ þa1_δðNþl−2Þ þ⋯
þan_δðNþl−nÞ
ð11Þ wherelis the number of predicted data.
Once the latest dataδ(N+ 1) is obtained, the rolling least square method can be used to update relevant parameter as follows.
KNþ1¼ PNφNþ1
1þφNþ1TPNφ Nþ1
ð12Þ
ANþ1¼ANþKNþ1 δðNþ1Þ−φTNþ1AN
ð13Þ
Transient instability detection module
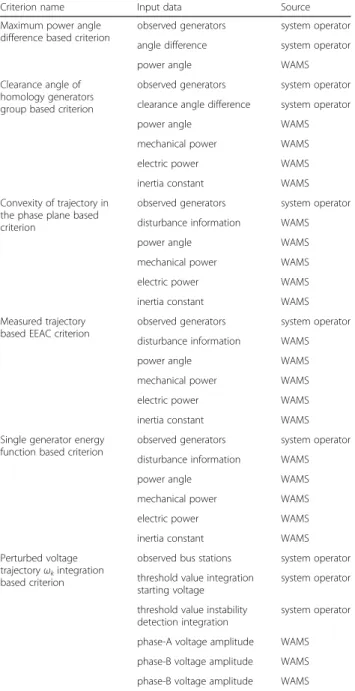
In this section, the implementation of seven transient in-stability detection technologies will be briefly described. Input data and threshold values of these transient instability detection technologies are shown in Table 3.
1. Maximum power angle difference based detection module
The power angle difference is usually taken as a criterion for transient instability detection in traditional engineering application. In this module, the generator power angle is predicted by one of
the angle prediction methods mentioned above according to the perturbed power angle of the observed generators. If the predicted power angle difference between any two generators exceeds a predefined threshold value, then the power system is considered as transient instable.
2. Clearance angle of homology generators group based detection module
Power system transient instability usually can be manifested as two generator cluster instability mode. In this module, the observed generators are divided into two generator groups based on power angle. The equivalent parameters of the two generator groups can be computed by.
δA¼
XnA
i∈A
Miδi
XnA
i∈A
Mi
;δB¼
XnB
j∈B
Mjδj
XnB
j∈B
Mj
ð15Þ
δA−δB
j j>δset ð16Þ
whereδAandδBare respectively the equivalent power angle of the leading generator groupAand the lagging generator groupB,δsetis the threshold value of transient instability detection,MiandMj are the inertia constant of generatoriandj. If Eq. (16) is established, power system can be considered as transient instable.
3. Measured trajectory based EEAC detection module Based on the EEAC methodology, an emergency EEAC method to predict, analyze and estimate the degree of transient stability was proposed in
Table 3List of the input of all Criterions
Criterion name Input data Source
Maximum power angle difference based criterion
observed generators system operator
angle difference system operator
power angle WAMS
Clearance angle of homology generators group based criterion
observed generators system operator
clearance angle difference system operator
power angle WAMS
mechanical power WAMS
electric power WAMS
inertia constant WAMS
Convexity of trajectory in the phase plane based criterion
observed generators system operator
disturbance information WAMS
power angle WAMS
mechanical power WAMS
electric power WAMS
inertia constant WAMS
Measured trajectory based EEAC criterion
observed generators system operator
disturbance information WAMS
power angle WAMS
mechanical power WAMS
electric power WAMS
inertia constant WAMS
Single generator energy function based criterion
observed generators system operator
disturbance information WAMS
power angle WAMS
mechanical power WAMS
electric power WAMS
inertia constant WAMS
Perturbed voltage trajectoryωkintegration
based criterion
observed bus stations system operator
threshold value integration starting voltage
system operator
threshold value instability detection integration
system operator
phase-A voltage amplitude WAMS
phase-B voltage amplitude WAMS
reference [15]. In this module, the observed generators are divided into two generator groups. Furthermore, the two generator groups are equivalent to a single machine infinite bus (SMIB) system. The transient stability is detected by searching the dynamic saddle point (DSP) and the farthest point (FEP) of the power angle-unbalanced power curve of SMIB. If the current operating status reaches the DSP, the system can be considered as transient instable. Otherwise the system can be considered as transient instable if FEP is reached. 4. Convexity of trajectory in the phase plane based
detection module
A transient instability detection method based on the trajectory geometry characteristics in phase plane was proposed in reference [16]. Based on the OMIB system, three indexes are calculated by Eqs. (17,18,19,20and21) including the convexity index in the phase of angle-angle acceleration (K1), the convexity index in the phase of unbalanced power-angle (K2) and the changing rate of the unbalanced electric power (K3). When these three indexes are positive at the same time, the system is considered as transient instable.
kið Þ ¼t ωδið Þt −ωiðt−1Þ
ið Þt −δiðt−1Þ ð
17Þ
K1¼Δkið Þ ¼t kið Þt −kiðt−1Þ ð18Þ
dΔPð Þδ dδ ¼
ΔP tð Þ−ΔP tð−1Þ
δð Þt −δðt−1Þ ð19Þ
K2¼d 2Δ
Pð Þδ dδ2 ¼
ΔP′ð Þt −ΔP′ðt−1Þ
δð Þt −δðt−1Þ ð20Þ
K3¼dΔP tð Þ dt ¼
ΔP tð þ1Þ−ΔP tð Þ
Δt ð21Þ
whereΔδi(t),Δωi(t) andΔP(t) are measured values of generator power, angle angular velocity and unbalanced electric power at momentt, respectively. 5. Single generator energy function based detection
module
A transient energy changing rate based transient instability detection method was proposed in reference [17]. It identifies the most severely perturbed generator based on relative kinetic energy of generators and electric power reflecting the change of power system. According to energy changing rate and power angle acceleration of the most severely perturbed generator, transient stability of power system can be detected. The variation rate of transient energy can be computed by Eq. (22).
dVi
dt ¼Hiωi dωi
dt − Pmi−Pei− Hi
HTPCOI
ωi ð22Þ
whereViis the energy function of generatori,PCOI is the unbalanced power of the system center of inertia (COI),Hiis the inertia of generatori,ωiis
the angular velocity of generatori,HTis the sum inertia of all generators,PmiandPeiare mechanical power and electromagnetic power of generatori, respectively.
6. Perturbed voltage trajectory integration criterion based detection module
A technique for predicting transient stability based on perturbed voltage trajectories was presented in reference [18]. The main steps are explained as follows and the detailed algorithm flow chart is shown in Fig.4.
Step1 Obtaining the voltage measurements
(trajectories) by PMU/WAMS and detecting the disturbance (fault occurs and fault clears). Step2 Determining the voltage trajectory used for
integration and calculating the integration based on the perturbed voltage trajectory by Eq. (23).
A1¼
Z tend
t0
VU−V tð Þ
½ V tð−TÞ−V tð Þ
T
dt
V tð Þ<VU
8 <
: ð23Þ
Step3 When the integration value exceeds the given threshold value at a certain time, the power system is unstable. If the voltage trajectory returns above the voltage upper limit and maintains a phase of time, the system is detected as transient stable.
Closed-loop emergency control module
In this module, the closed-loop emergency control mod-ule is designed. The sort list (descending order) of the observed generators according to power angle is given, by which operators can select generators to formulate the emergency control schemes including the control site and quantity. Different emergency control schemes in different operation conditions and failure situations can be tested and verified through the platform.
Results
The WAMS based power system transient stability de-tection and control test platform is developed by QT. It has been applied inChina Southern Power Grid Research
Table 4Assessment information of all methods
Criterion name Instability detection moment (s) Parameters Values
Maximum power angle difference based criterion
1.54 threshold value of power angle difference () 180
power angle difference detecting instability () 180.58
leading generator Yemazhai#1
lagging generator Nayong#1
maximum power angle difference (°) 357.91
maximum power angle difference moment (s) 2.72
Clearance of generator cluster based criterion
2.02 threshold value of clearance angle difference (°) 150
clearance of generator cluster detecting instability (°) 156.7528
Measured trajectory based EEAC 1.72 unbalanced power (MW) 15.8657
power angle speed (rad/s) 3.0980
Trajectory convexity in the phase plane based criterion
2.28 convexity index in the angle-angle acceleration phase 0.0005
convexity index in the unbalanced power-angle phase 0.3162
changing rate of electric power 24.3630
Single generator energy function based criterion
1.96 power angle acceleration (rad/s2) −0.0041
energy changing rate (MW/s) 282.7081
Perturbed voltage trajectory integration based criterion
0.74 key bus station Shuanglong
voltage upper limit (pu) 0.85
threshold value of voltage integration 0.03
voltage integration value 0.0304
Table 5Platform Test Results of The Fault Cases of China Southern Power Grid
Criterion name Transient stability detection moment (s)
Case 1 Case 2 Case 3 Case 4
Maximum power angle difference based criterion 1.86 1.22 1.96 0.68
Clearance of generator cluster based criterion 2.6 1.58 1.04 0.66
Measured trajectory based EEAC 1.40 1.16 1.40 0.88
Trajectory convexity in the phase plane based criterion 1.18 1.06 1.00 0.84
Single generator energy function based criterion 0 2.76 3.58 1.58
Perturbed voltage trajectory integration based criterion 0.96 1.10 0.80 0.56
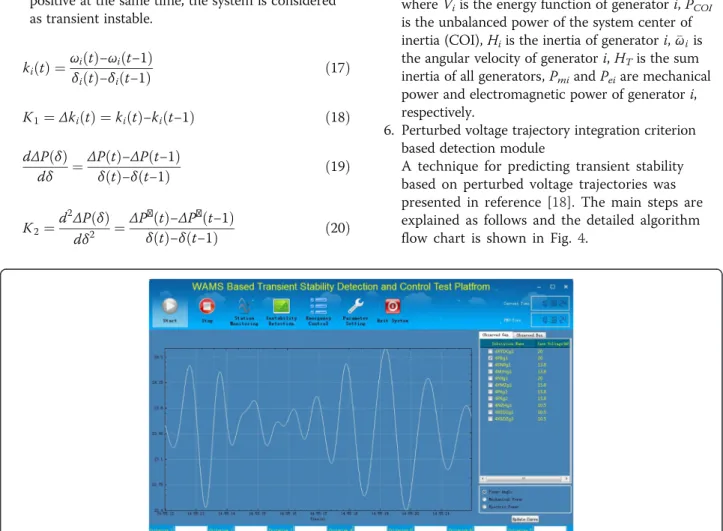
Instituteand played an important role in some engineering applications. In this section, parts of the analysis and com-parison results are presented. The main interface of the platform is shown in Fig. 5.
Determination of the system protection scheme in Liupanshui power grid
The test platform developed in this paper has played an important role in the formulation of the system protection schemes ofLiupanshuipower grid (in Guizhou province).
Based on the operation data in the year 2014 ofChina Southern Power Grid provided by RTDS platform (the measured cycle is 0.02 s), 14 typical fault (102 cases in total) inLiupanshui power gridare selected to analyze the validity and applicability of the response based transient instability detection technologies mentioned above. Studies cover various conditions including different observation scheme of generators and substations (22 observable generators and 28 observable substations), different threshold values, different hybrid power gener-ation with fire-water-wind, the asymmetric and non-metallic three-phase short circuit faults. One of the test results is given in Table 4.
By means of testing and analyzing all cases through our test platform, the power system operators can make a comprehensive comparison of the accuracy, rapidity
and the project implementation of all these response based transient instability detection technologies. It is determined that the ‘Perturbed Voltage Trajectory Integration Based Criterion’ is adopted to the project demonstration of the Liupanshui power grid and four 220 kV substations are taken as the observed substations of the special protection system including Shuanglong, Huangjiashan,TaishaandLiuzhi.
Case analysis of the Guangdong-Guangxi Tie-lines In order to illustrate the validity and practicality of the test platform, 50 fault cases of the tie-lines between Guangdong and Guangxi are analyzed. Part of the test results are shown in Table 5.
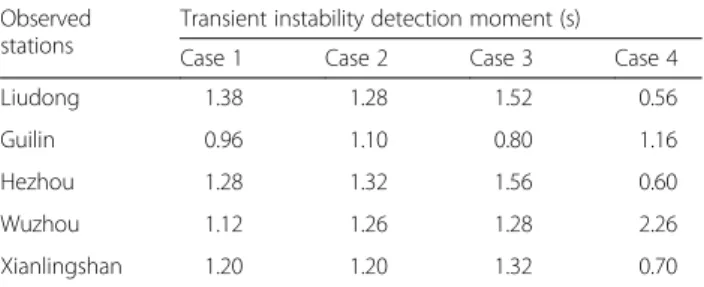
Research shows that generators of Guangdong and Guangxi will lose synchronization when there happens to be DC-blocking faults or short-circuit faults. The oscillation center is always located in the tie-line of Guangdong and Guangxi. Detection results of the ob-served 500 kV bus stations are shown in Table 6.
Discussion
Currently the PMU data are generally transmitted by the dispatching data communication network based on TCP/IP. The average delay of data transmission is close to 100 milliseconds and is uncertain. Mean-while, the data buffer period of the WAMS master station system is generally more than 1 s and even close to 2 s. In addition, the time consuming of re-sponse based transient instability detection calculation is evitable. The detailed delay distribution is described as shown in Fig. 6. Thus, the existing PMU/WAMS is mainly used for the real-time online monitoring of the power system dynamic process. The reliability and rapidity cannot meet the requirement of the fast and real-time wide area control.
At present, power system stability control system is still based on the embedded stability control devices,
Table 6Detection information of the observed substations in the tie-line of Guangdong and Guangxi
Observed stations
Transient instability detection moment (s)
Case 1 Case 2 Case 3 Case 4
Liudong 1.38 1.28 1.52 0.56
Guilin 0.96 1.10 0.80 1.16
Hezhou 1.28 1.32 1.56 0.60
Wuzhou 1.12 1.26 1.28 2.26
Xianlingshan 1.20 1.20 1.32 0.70
which has several fixed observation control substations. With the development of PMU/WAMS, transient in-stability and control system based on WAMS can be carried out based on various WAMS substations. The task of calculation in master station can be decomposed into several sub-tasks which can be allocated to various distributed WAMS substations.
Conclusions
Power system security and stability control technology based on wide area response is currently a research hot-spot. According to existing research achievements, a WAMS based test platform is developed for power system transient instability detection and control. The platform implements various response based transient instability detection and control technologies in real-time data environment and provides visual presentation of results. Furthermore, the platform has good flexibility and extendibility. Data support, application integration and test environment are provided. The general data and application programming interface (API) is available by which testers or operators can add new transient instability detection modules to the platform.
Application in actual engineering demonstrates that this platform can meet the requirements of testing and analyzing in different operation conditions and failure situations. It is an effective test platform to analyze and compare the response based transient instability detec-tion and control technologies. It can provide a reference for actual engineering application, which has a practical significance in terms of the application of the response based transient instability detection and control technolo-gies in actual power systems.
Acknowledgements
Project Supported by National Natural Science Foundation of China (51577049); Open Foundation of State Key Lab. of Alternate Electrical Power System with Renewable Energy Sources (Grant No. LAPS14005)”.
About the authors
Jinquan Zhao (M’2006) was born in Yangquan, Shanxi province, China, on June 26 1972. He received the B.S. and Ph.D. degrees, all in electrical engineering, from Shanghai Jiao Tong University, Shanghai, China, in 1993 and 2000, respectively. From December 2000 to September 2003, he was a doctoral associate in Cornell University, Ithaca, NY. He was a post-doctoral associate in Tsinghua University, Beijing, China. Currently he is a professor in College of Energy & Electrical Engineering, Hohai University, Nanjing, China. His researches include voltage stability analysis and control, OPF and its applications.
Yujie Zhang received the B.S. in electrical engineering from Nanjing University of Technology, Nanjing, China, in 2013. Currently he is a M.S. student in College of Energy & Electrical Engineering, Hohai University, Nanjing, China. His research interest is power system stability and control. Pan Zhang received the B.S. in electrical engineering from Hohai University, Nanjing, China, in 2013. Currently he is a M.S. student in College of Energy & Electrical Engineering, Hohai University, Nanjing, China. His research interest is power system transient stability and control.
Xiaoming Jin received the B.S. in electrical engineering from Xi’an Jiaotong University, Xi’an, China, in 1983. Currently he is a senior technical expert
in Southern Power Grid, Guangzhou, China. His researches include power system planning and Direct-Current (DC) transmission technology. Chao Fu received the B.S. and M.S. in electrical engineering from Xi’an Jiaotong University, Xi’an, China, in 2004 and 2007, respectively. Currently he is an engineer at China Southern Power Grid Science Research Institute and his researches include power system planning as well as power system stability and control.
Authors’contributions
ZJ carried out the wide area response based power system transient stability detection and control studies. ZY carried out the design and implementation of the test platform and drafted the manuscript. ZP participated in the development of test platform. JX and FC provided simulation data and suggestions for improvement of test platform. All authors read and approved the final manuscript.
Competing interests
The authors declare that they have no competing interests.
Author details
1College of Energy & Electrical Engineering, Hohai University, Nanjing, China. 2
Electric Power Research Institute, CSG, Guangzhou, China.
Received: 10 May 2016 Accepted: 10 May 2016
References
1. Takahashi, M., Matsuzawa, K., Sato, M., et al. (1988). Fast generation shedding equipment based on the observation of swings of generators.
IEEE Transactions on Power Systems, 3(2), 439–446.
2. Liu, C. W., & Thorp, J. (1995). Application of synchronized phasor measurements to real-time transient stability prediction.IEE Proc. Gener. Transm. Distrib., 142(4), 355–360.
3. Stanton, S. E., Slivinsky, C., Martin, K., et al. (1995). Application of phasor measurements and partial energy analysis in stabilizing large disturbances”.
IEEE trans. On power systems, 10(1), 297–306.
4. Liu, C. W., & Thorp, J. S. (2000). New methods for computing power system dynamic response for real-time transient stability prediction.IEEE Trans. On Circuits and Systems: Fundamental Theory and application, 47(3), 324–337. 5. Daoud, A., Karady, G., Amin, A. (2001).“A new fast-learning algorithm for predicting power system stability,”Proceedings of 2001 IEEE PES winter meeting, Jan. 28-Feb. 1, Singapore: 594–598.
6. Cai, G., Chan, K. W., Mu, G., et al. (2004). Transient instability detection using line transient potential energy.Electric Power Components & Systems., 32(6), 627–643.
7. De La Ree, J., Centeno, V., Thorp, J., & Phadke, A. G. (2010). Synchronized phasor measurement applications in power systems.IEEE Trans. on Smart Grid, 1(1), 20–27.
8. Rajapakse, A. D., Gomez, F. R., Nanayakkara, K., et al. (2010). Power angle instability prediction using post-disturbance voltage trajectory.IEEE Trans. on Power Systems, 25(2), 947–956.
9. Terzija, V., Valverde, G., Cai, D., et al. (2011). Wide-area monitoring, protection, and control of future electric power networks.Proceedings of the IEEE., 99(1), 80–93.
10. Taylor, C. W., Erickson, D. C., Martin, K. E., et al. (2005). WACS—Wide-Area Stability and Voltage Control System: R&D and Online Demonstration.
Proceedings of IEEE., 93(5), 892–906.
11. Mao, A., Guo, Z., & Zhang, X. (2006). A fast transient stability predicting method based on the WAMS process measurement data.Proceedings of CSEE., 26(17), 38–43 (in Chinese).
12. Song, F., Bi, T., & Yang, Q. (2006). Perturbed trajectory prediction method based on wide area measurement systems.Automation of Electric Power Systems., 30(23), 27–31 (in Chinese).
13. Li, G. (1994). Study on prediction control for transient stability of power systems.Automation of Electric Power Systems., 18(3), 25–31 (in Chinese). 14. Wu, X., Zhao, J., Xu, A., et al. (2011).Review on transient stability prediction
methods based on real time wide-area phasor measurements(in Proc. IEEE- DRPT 4th Int. Conf., China, pp. 320–326).
16. Xie, H., Zhang, B. (2008).“Power system transient instability detection algorithm based on real time measurement,”inIEEE Asia Pacific Conference on Circuits and Systems, Macao, China, November, pp. 631–634.
17. Song, F., Bi, T., and Yang, Q. (2006).“A Novel Transient stability Analysis Method for Multi-machine System,”inThe 7th IET International Conference on Advances in Power System Control, Hongkong, China, October, pp. 450–456.
18. Zhao, J., Li, J., Wu, X., et al. (2011).A novel real-time transient stability prediction method based on post-disturbance voltage trajectories
(The International Conference on Advanced Power System Automation and Protection, Beijing, China, pp. 14–16).
Submit your manuscript to a
journal and benefi t from:
7Convenient online submission
7Rigorous peer review
7Immediate publication on acceptance
7Open access: articles freely available online
7High visibility within the fi eld
7Retaining the copyright to your article