AUSTRALIAN JOURNAL OF BASIC AND
Open Access Journal
Published BY AENSI Publication
© 2016 AENSI Publisher All rights reserved
This work is licensed under the Creative Commons Attribution International License (CC BY).
http://creativecommons.org/licenses/by/4.0/
To Cite This Article: Aniza binti Ibrahim, Muhammad Mukhlisin, Othman Jaafar and Mohd Raihan Taha Infiltration into Unsaturated Soil using Electrical Capacitance Volume Tomography (ECVT)
2016
Study the Effect of Rainfall Infiltration into Unsaturated Soil using
Electrical Capacitance Volume Tomography (ECVT)
1Aniza binti Ibrahim, 2Muhammad Mukhlisin
1Faculty of Engineering, Universiti Pertahanan Nasional Malaysia,
2Department of Civil Engineering, Polytechnic Negeri Semarang, Indonesia.
3
Department of Civil and Structural Engineering, Universiti Kebangsaan Malaysia
Address For Correspondence:
Aniza Ibrahim, Faculty of Engineering, Universiti Pertahanan Nasional Malaysia Tel: 6019-6417386; E-mail: [email protected]
A R T I C L E I N F O Article history:
Received 3 March 2016 Accepted 2 May 2016 published 26 May 2016
Keywords:
Infiltration, Soil column, ECVT,
Real-time imaging, Volumetric water
content.
In tropical countries which has high seasonal rainfall , infiltration of rainfall into soil especially at slope will cause shallow slip failures due to the wetted zone. (
drying process that takes place where some of the rainwater reaches the slope surface will infiltrate into the soil and some of the amount will be the surface ru
pressure. After a rainfall event, as water infiltrates into the slope, volumetric water content starts to increase as pore water pressure increases to the positive value. This phenomenon wi
decrease friction and cohesive strength between soil particles ( Consequently the factor of safety against slope stability is decreased.
In conventional study of rainfall i
to measure parameters of volumetric water content and pore water pressure respecti from equipment can be taken direct
software are used to simulate and proved be produced from numerical simulation result
AUSTRALIAN JOURNAL OF BASIC AND
APPLIED SCIENCES
ISSN:1991-8178 EISSN: 2309-8414 Journal home page: www.ajbasweb.com
© 2016 AENSI Publisher All rights reserved
This work is licensed under the Creative Commons Attribution International License (CC BY).
http://creativecommons.org/licenses/by/4.0/
Aniza binti Ibrahim, Muhammad Mukhlisin, Othman Jaafar and Mohd Raihan Taha.,
Infiltration into Unsaturated Soil using Electrical Capacitance Volume Tomography (ECVT). Aust. J. Basic & Appl. Sci.,
Study the Effect of Rainfall Infiltration into Unsaturated Soil using
Electrical Capacitance Volume Tomography (ECVT)
Muhammad Mukhlisin, 3Othman Jaafar and 3Mohd Raihan Taha
Faculty of Engineering, Universiti Pertahanan Nasional Malaysia,
partment of Civil Engineering, Polytechnic Negeri Semarang, Indonesia.
Department of Civil and Structural Engineering, Universiti Kebangsaan Malaysia
Aniza Ibrahim, Faculty of Engineering, Universiti Pertahanan Nasional Malaysia [email protected]
A B S T R A C T
Background: Infiltration of rainfall is widely known as a factor that change pore water pressure and volumetric water content of soil especially for unsaturated soil
region. Previous study of infiltration were using soil columns parameters such as moisture content and pore water pressure that were determined by equipment attached to it, and images of infiltration can only be simulated by geotechnical engin software.Objective: The objective of this paper is to compare
infiltration into soil using Electrical Capacitance Volume Tomography (ECVT) of two soils; gravelly sand and kaolin. Other than real-time images, volumetric water con were obtained through permittivity value from the experiment.
experiment, the results were clearly indicated that real time imaging for rainfall infiltration into the soil can be produced for both types of soil
value were successfully converted to volumetric water content using equation and shows a good relations with the real-time images.Conclusion:
innovative method introduced to study infiltration of rainfall into soil. This method willenhance the understanding of soil behavior especially for rainfall infiltration that relates to soil stability.
INTRODUCTION
In tropical countries which has high seasonal rainfall , infiltration of rainfall into soil especially at slope will failures due to the wetted zone. (Bujang, B.K et.al 2006). Rainfall event leads to wetting and drying process that takes place where some of the rainwater reaches the slope surface will infiltrate into the soil and some of the amount will be the surface runoff. Unsaturated soil is known has a very low negative pore water pressure. After a rainfall event, as water infiltrates into the slope, volumetric water content starts to increase as pore water pressure increases to the positive value. This phenomenon will transform the structure of soils; decrease friction and cohesive strength between soil particles (Gasmo, J.M et.al 2000),
Consequently the factor of safety against slope stability is decreased.
In conventional study of rainfall infiltration, Time-Domain-Reflectometry (TDR) and tensiometer are used to measure parameters of volumetric water content and pore water pressure respectively. Both of the parameters equipment can be taken directly from the studied site or by laboratory works. Numerical simulation using software are used to simulate and proved the results produced by laboratory works. 2-Dimensional
be produced from numerical simulation result that give non real-time images result
., Study the Effect of Rainfall Aust. J. Basic & Appl. Sci., 10(11): 66-72,
Study the Effect of Rainfall Infiltration into Unsaturated Soil using
Infiltration of rainfall is widely known as a factor that change pore water pressure and volumetric water content of soil especially for unsaturated soil in tropical region. Previous study of infiltration were using soil columns parameters such as moisture content and pore water pressure that were determined by equipment attached to it, and images of infiltration can only be simulated by geotechnical engineering The objective of this paper is to compare real time imaging of infiltration into soil using Electrical Capacitance Volume Tomography (ECVT) of two time images, volumetric water content were obtained through permittivity value from the experiment.Results:From the real time imaging for rainfall infiltration into the soil can be produced for both types of soil.Result of permittivity alue were successfully converted to volumetric water content using equation and Conclusion: ECVT is a new method introduced to study infiltration of rainfall into soil. This method understanding of soil behavior especially for rainfall infiltration that
In tropical countries which has high seasonal rainfall , infiltration of rainfall into soil especially at slope will . Rainfall event leads to wetting and drying process that takes place where some of the rainwater reaches the slope surface will infiltrate into the soil a very low negative pore water pressure. After a rainfall event, as water infiltrates into the slope, volumetric water content starts to increase as ll transform the structure of soils; , Gofar, N et.al 2006).
parameters are depends on the result obtained from previous laboratory works only. Therefore the result obtained is not a real time at the time of rainfall event occurred.
Instead of using conventional method of evaluating the mechanism of rainfall-induced slope instability, this research used an innovative technology in geotechnical engineering. The electrical capacitance volume -tomography (ECVT) is a method obtaining pattern of water infiltration through soil using real time 3 dimension (3D) imaging. Previous techniques of ECVT were used widely since 1970’s such as magnetic resonance imaging (MRI), X-ray micro tomography, optical tomography, resistive tomography, acoustic tomography, positron-emission tomography (PET), capacitance tomography, and others (Willians, R.A et.al. 1995). This technique was started to be used in the industrial (Marashdeh, Q et.al.2007)and flow phase for chemical material process. ECVT is the 3 dimensional real-time imaging system considered as “the most promising technique for dynamic flow imaging, which has a relatively high temporal resolution, up to few milliseconds, with reliable spatial resolution “(Marashdeh, Q et.al.2007).
Generally, tomography is an imaging process which the cross section of an object can be demonstrateddeprived of any apparatus probed or inserted into the object.Basically, ECVT technique consists of sensors, data acquisition system (DAS), displaying of image and permittivity data, and imaging reconstruction.
In this research, sensor for EVCT system consists of electrodes which yield magnetic field and measured capacitance value while the object is being experimented. The variation of capacitance value is depends on the tested object, electrode shape and quantity of electrode. The electrodes' shape, configuration and thickness depend on the object to be tested. These electrodes are connected to the DAS to transfer and store the measured capacitance. The DAS is also depends on the designed storage capacity.
When starting the experiment, all capacitance data obtained is saved to DAS. At the same time, 3D image for is displayed in real time through the personal computer. Other than that, the value of permittivity is also captured and displayed. Then, the value of capacitance measured is transferred to the relative permittivity value, based on the object. Relative permittivity value describes material or objects that being tested, and its chemical composition component. For example, relative permittivity value for air, water, residual soil, and saturated soil is 1, 80, 2-4, and 23-28 respectively Mukhlisin et.al (2012). The final process in ECVT technique is image. After the value of relative permittivity is obtained,MATLAB software is used to generate image reconstruction. Both 2D and 3D images will be produced through this technique.
Few researches were using ECVT system in geotechnical engineering. Previous researches were done by Mukhlisin et.al (2010),Mukhlisin et.al (2012), and Baidillah (2011). Study by Mukhlisin et.al (2010) and Baidillah (2011) were to analyse infiltration of rainwater to the soil. Using the ECVT vessel, the water infiltration can be detected through the system. A study by Mukhlisin et.al (2012), the variation of volumetric water content applied and mix to the soil sample, and detected by ECVT system and to measure if volumetric water content can be detected through the experiment. Even though the previous researcher studied infiltration using ECVT, all of the studies mentioned were not representing the effect of actual rainfall situation with designated duration and intensity.
MATERIALS AND METHODS
Properties of soils:
Two types of soils were used in this research; gravelly sand and kaolin which both materials were commercially obtained.Basic soil properties were determined in the laboratory for both soils such as moisture content, porosity, and bulk density. Hydraulic properties of the soils such as hydraulic conductivity, ks, was
measured through constant head permeability test. Soil Water Characteristic Curve (SWCC) of the soil was measured by plate pressure extractor apparatus, and then the results obtained were fitted using Van Genuchten Method (1980).
Soil Column Apparatus:
Infiltration of rainfall experiments were conducted using soil column apparatus. The system of soil column including water supply system, soil column with attached sensors, and effluent system.
Soil column apparatus was using conventional soil column apparatus, ECVT vessel which attached with sensors, and data acquisition system to retrieve the data obtained. Size of the vessel is 11.5 cm x 27 cm, and there are 32 pixels for all x, y, and z axes. Therefore, the length of vessel is divided by the total pixel resulted of 0.844 and 0.11 cm3 per voxel. The parameters were set to be logged for every 1 minute throughout the experiment.
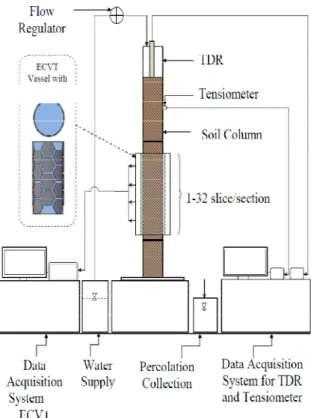
On the other hand, the intrusion throughout the ECVT vessel is prohibited due to the sensors' sensitivity. Therefore, for installing TDR and tensiometer purposes, top of the ECVT vessel was extended with acrylic tube. TDR used in this experiment was TRIME-IT Time domain Reflectometry with Intelligent MicroElements by IMKO Micro modultechnik Gmbh. Data from TDR was obtained through data acquisition system attached to the soil column for every ten minutes. The schematic diagram of the soil system component is illustrated in Fig.1.
Effluent system for the infiltration experiments was using Rainlog Datalogger by Rainwise to measure the effluent of rainwater through infiltration. The 8 inches diameter collector tipping bucket will collect 0.01 inch/tip and 0.5 min/tip minimum and maximum respectively. This battery operated logger fits inside the polypropylene rain gauge and will measure the total rainfall at every ten minute. For this experiment, rain gauge was set for 0.01 inch/tip.
Fig. 1: Schematic diagram of soil column apparatus using ECVT.
Experiment Schedule:
The infiltration tests were carried out with two simulated rainfall flow rate and durations. For gravelly sand, the first experiment was carried out with 1.93 mL/s flow rate (R1), for 3 days. Then, second experiment was done with 10 mL/s(R2)flow rate, for 1 day. 1hour is allocated for drying process for each test respectively.
For kaolin, the first experiment was carried out with 1.93 mL/min flow rate (R1), for 48 hours with 42 hours of drying time. Then, second experiment was done with 10 mL/min flow rate (R2), for 1 hour, with drying time of 24 hours.
Images Reconstruction:
After the infiltration experiment, 2D and 3D imaging reconstruction were carried out using MATLAB software. The permittivity value was also retrieved from the MATLAB and converted to moisture content.
Using the equation proposed by Mukhlisin, M. et.al(2012), the value of normalization permittivity and volumetric water content can be determined.
Normalized permittivity,
Volumetric water content,
= . (2)
Where , , , and are normalized, relative, residual, and saturated permittivity value respectively, and is the porosity. It is noted that the relative permittivity for air, water, residual soil, and saturated soil are 1, 80, 2-4, and 23-28 respectively.
RESULTS AND DISCUSSION
Soil Properties:
Result of soil basic properties is listed in Table 1. Since both of the soils were commercially obtained, the moisture content of the soils was considerably low due to the dryness of soils
Soil used for the experiment was gravelly sand, and basic properties of the soil such as moisture content, was determined in the laboratory. Other than that, saturated hydraulic conductivity, kswas measured through constant head permeability test. Plate pressure extractor apparatus was used to measure Soil Water Characteristic Curve (SWCC) of the soil, which the result was fitted using Van Genuchten Method (1980). The results of soil properties are as in the Table 1.
Table 1: Soil Properties soils.
Soil Properties Symbols Gravelly Sand Kaolin
Moisture content θ 0.0013 0.37
Saturated volumetric water content θ 0.0883 0.48
Residual volumetric water content θ 0.0313 2x10
Saturated hydraulic conductivity (m/s) ks 6.333e-4 2.1x 10
Real-time Images:
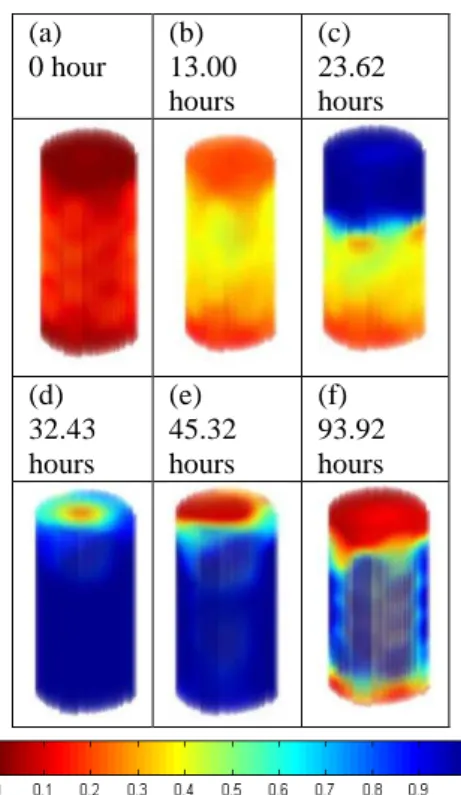
In this experiment, infiltration of water was clearly verified by the Figure 2(a) to Figure 2 (f). As a start, the vessel was filled with soil, showed by the red color code. (Figure 2a). Rainfall infiltration is started to trace at the top of the column as indicated by orange color at the top of column. Figure 2(c) demonstrated blue color on the top of the vessel which indicated that water started to infiltrate into the vessel after simulated rainfall was applied. Then the water infiltration is continued approaching bottom of the vessel, as proved in Figure 2 (d), and (e). In Figure 2(f), while the whole vessel is occupied by the water, but there is light blue color on the top of vessel, indicated that the drying process was started on that that sections. Subsequently, Figure 2 (e) and (f) suggested that the soil in the vessel continued to dried up after simulated rainfall has stopped. Finally, the color of the whole vessel is changed to red color indicated that most of the sections is in drying process.
By referring to Figure 3, the pattern of process for rainfall infiltration for kaolin is similar as gravelly sand. From both of Figure 2 and 3, it is clearly showed that at 23 hours, the permittivity for gravelly sand has blue color for the half of the vessel, meanwhile kaolin still has reddish color at 27 hours. The result shows that rainfall infiltration is moving faster than kaolin. Other than that, at 32.43 hours as indicated at Figure 2 (d) for gravelly sand, the whole vessel turn to dark blue color indicated that infiltration of rainfall already reach the bottom of the vessel. On the other hand, rainfall infiltration took 40.62 hours to reach at the bottom of vessel.
Volumetric water content:
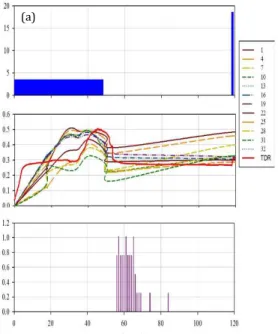
Figure 4(a) and 5 (a) show the and intensity and duration for rainfall, Figure 4(b) and 5(b) show volumetric water content, and Figure 4(c) and 5(c) show effluent of both kaolin and gravelly sand respectively.
Figure 4 and 5, show that rainfall for kaolin was appliedshorter times compared to gravelly sand. It was due to the fact that rainfall infiltration takes longer times to travel and reach bottom of the vessel as shown in Figure 3.It is indicated that ponding had occured at the top of soil column, and longer time for drying is needed.
Figure 4 (b) and 5(b) show the volumetric water content for both soils. The value of these volumetric water content are converted from permittivity value obtained though ECVT experiment, and conveted using equation 1 and 2 as mentioned above. The result of volumetric water content for both soils indicated that the value were gradully increased as experiments were started and rainfall were applied. For gravelly sand, volumetric water content is decreasing before the drying process, and increased as second experiment (R2) is applied. On the other hand, for kaolin, value of volumetric water content was increased, and started to decrease as the drying process took place. Then the value was started to accelerate as second experiment (R2) started until end of the experiment.
68 hours of experiment.
(a) 0 hour
(b) 13.00 hours
(c) 23.62 hours
(d) 32.43 hours
(e) 45.32 hours
(f) 93.92 hours
Fig. 2: Result of images reconstruction for gravelly sand.
(a) 0 hour
(b) 17.05 hours
(d) 27.42 hours
(f) 40.62 hours
(h) 55.80 hours
(j) 141.77 hours
Fig. 3: Result of images reconstruction For kaolin
For kaolin, effluent was traced at 56 hours of experiment with 0.76 mm/hour. The effluent were continue until 84 hours of experiment with maximum value of 1.02 mm/hour at 57, 61 and 65 hours of experiment. Due to the longer times taken for water to reach bottom of the vessel, there was no effluent traced after the 84th hour of experiment.
Fig. 4: Result for kaolin for (a) Flow rate, (b)Volumetric water content, and (c) Effluent.
Time (hour)
0 20 40 60 80 100
P er co la tio n C o lle ct o r (m m /1 0 m in ) 0.0 0.1 0.2 0.3 0.4 0.5 0.6 F lo w r at e (m L /s ) 0 2 4 6 8 10 12 V o lu m et ri c w at er c o nt en t (m 3/m 3) 0.00 0.05 0.10 0.15 0.20 0.25 1 4 5 9 10 11 15 16 17 21 22 23 27 28 32 TDR
Fig. 5: Result for gravelly sand for ((a) Flow rate, (b) Volumetric water content, and (c) Effluent.
Conclusion:
In this paper, one dimensional rainfall infiltration test using soil column was conducted using real time imaging of ECVT sensors. This research also proved that real time images for both soils using ECVT system can be used in studying rainfall infiltration. The images provide good response from two cycles of rainfall applied into the soil, and drying after each test of rainfall. Based on the images, rainfall infiltration for gravelly sand is proved to be faster than kaolin. The method of ECVT is proved to be effective in the analysis of rainfall infiltration into the unsaturated soil. Other than that, because of the variation of ECVT vessel shape can also be designed and implemented, this method can be further improved such as in determining parameters in other soil analysis especially for slope stability.
REFERENCES
Baidillah, M.R., 2011. Analisis Penyusupan Air- Tanah dan Ketidakstabilan Cerun. Master Thesis. Universiti Kebangsaan Malaysia.
Bujang, B.K., F.H. Ali and T.H. Low, 2006. Water Infiltration Characteristics of Unsaturated Soil Slope and its Effect on Suction and Stability.Geotechnical and Geological Engineering, 24: 1293-1306.
Gasmo, J.M., H. Rahardjo, and E.C. Leong, 2000. Infiltration Effects on Stability of a Residual Soil Slope.
Computers and Geotechnics, 26: 145-165.
Gofar, N., L.M. Lee, and M. Asof, 2006. Transient Seepage and Slope Stability Analysis for Rainfall- Induced Landslide : A case Study. Malaysian Journal of Civil Engineering, 18: 1-13.
Marashdeh, Q., W. Warsito, L.S. Fan and F.L. Teixeira, 2007. A Multimodal Tomography System Based on ECT Sensors.IEE Sensors Journal, 7(3): 426-433.
Mukhlisin, M., M.R. Baidillah, A. EL-Shafie and M.R. Taha, 2010. Real Time Monitoring of Soil Water
Infiltration Using Electrical Capacitance Volume-tomography (ECVT). Riyadh, Saudi Arabia.
Mukhlisin, M., M.R. Baidillah, A. EL-Shafie, M.R. Taha and W. Warsito, 2012. Electrical Capacitance Volume Tomography of Soil Water Infiltration in a Vessel Experiments. Hydrol.Earth.Syst.Sci, Discus., 9: 1367-1387.
Mukhlisin, M., A. Saputra, A. EL-Shafie and M.R. Taha, 2012. Measurement of Dynamic Soil Water Content Based on Electrochemical Capacitance Tomography. Int. J. Electrochem. Sci.,7.
Van Genuchten M.TH., 1980. A Closed-form Equation for Predicting the Hydraulic Conductivity of Unsaturated Soils. Soil Sci. Soc. Am. Journal, 44(5), 892-898.