O R I G I N A L R E S E A R C H
Open Access
Optimal temporal-spatial PEV charging
scheduling in active power distribution
networks
Siyang Sun, Qiang Yang
*and Wenjun Yan
Abstract
Background:The increasing penetration of a massive number of plug-in electric vehicles (PEVs) and distributed generators (DGs) into current power distribution networks imposes obvious challenges on power distribution network operation.
Methods:This paper presents an optimal temporal-spatial scheduling strategy of PEV charging demand in the presence of DGs. The solution is designed to ensure the reliable and secure operation of the active power distribution networks, the randomness introduced by PEVs and DGs can be managed through the appropriate scheduling of the PEV charging demand, as the PEVs can be considered as mobile energy storage units.
Results:As a result, the charging demands of PEVs are optimally scheduled temporally and spatially, which can improve the DG utilization efficiency as well as reduce the charging cost under real-time pricing (RTP).
Conclusions:The proposed scheduling strategy is evaluated through a series of simulations and the numerical results demonstrate the effectiveness and the benefits of the proposed solution.
Keywords:Plug-in electric vehicles (PEVs), Energy storage, Distribution generators (DGs), Charging demand, Charging scheduling strategy, Active power distribution networks, Real-time pricing (RTP)
1 Background
The growing concerns of fossil fuel consumption and greenhouse gas emission have motivated the quick de-velopment of plug-in electric vehicles (PEVs) and distrib-uted generators (DGs). It is widely agreed that PEVs and DGs will become prevalent in recent decades, and high penetration level of PEVs and DGs is envisioned in future power distribution networks. For instance, it is anticipated that PEV will be a fairly large segment of US national fleet (at least 10% by 2020 and 50% by 2050 of new car sales projection) [1]. Moreover, the proportion of distributed renewable energy sources (e.g. photovol-taic and wind turbine) is reported to be 17.9% in total energy consumption of China in 2015, and the average annual growth rate reaches 9.42% [2].
On the one hand, the utilization of DGs can reduce the fossil fuel consumption and greenhouse gas
emission, and the large-scale deployment of PEVs can also promote the utilization of the renewable energy sources through the coordinated dispatching strategies of PEVs and renewable DGs. The benefits of the coordi-nated energy dispatch considering the availability of DGs and PEVs have been confirmed in some existing litera-ture [3]. However, on the other hand, the uncoordinated integration of a massive number of PEVs and DGs into current active power distribution networks would bring direct challenges for network planning, control and management. The temporal and spatial characteristics of DG outputs and PEV charging demand impose a signifi-cant impact on load profiles of distribution networks, and hence results in unexpected voltage fluctuation and increased peak-valley gap [4]. In the presence of the in-creasing penetration of PEVs and DGs, a coordinated scheduling strategy for PEV charging demand and DG outputs management needs to be adopted in current ac-tive power distribution networks to ensure the reliable and economical network operation.
* Correspondence:[email protected]
College of Electrical Engineering, Zhejiang University, 38 Zheda Rd., Hangzhou 310027, China
In literature, a collection of research effort has been made to address the challenges of the optimal schedul-ing strategies of PEV chargschedul-ing (e.g. [5–13]), but only a few works considered the interaction with DGs (e.g. [3, 14–17]). The authors in [3] exploited three coordinated wind-PEV energy dispatching approaches (i.e., valley searching, interruptible and variable-rate energy dis-patching), aiming to optimize the utilization efficiency of wind power generation as well as meet the dynamic power demands. In [14], the self-scheduling problem of an aggregator of PEVs purchasing energy in the day-ahead market and offering balancing services for a wind power producer was discussed using a probabilistic vir-tual battery model and a scenario-based robust ap-proach. Moreover, a two-level architecture based on model predictive control was presented to deal with dis-tributed energy resources, renewables and storage de-vices in microgrids with less computational complexity in [15]. The authors in [16] proposed a PEV charging policy that considers every 5 min real-time market en-ergy price signal to increase the penetration of distrib-uted PV solar arrays. Last but not least, a charging process undergone for PEVs in parking lot areas using PV-based charging facilities was presented to evaluate the voltage profiles, peak demand and charging cost of this scenario in [17].
However, the aforementioned solutions have some ob-vious limitations. Firstly, it has been reported that current PEVs can be charged either in normal charging mode at home, or in fast charging mode at fast charging stations [18], and the two charging modes have totally different characteristics, which has not been considered in the related works. A comprehensive scheduling strat-egy needs to be proposed including two charging modes. Furthermore, most of the literature only aimed to solve either the reliable operation of the distribution networks or the economical charging of PEV owners. However, both aspects should be focused on to achieve a win-win result. In addition, to the authors’ best knowledge, most of the related works are based on the day-ahead prediction of DG outputs, there still lacks of PEV charging scheduling strategies to ensure the real-time performance.
To this end, this paper addressed the challenges of PEV charging scheduling strategy and presented a novel temporal-spatial optimal scheduling strategy of PEV charging demand considering the existence of DGs. The main technical contributions made in this work are as follows: (1) PEV charging demand is scheduled separ-ately based on the characteristics of two charging modes with DG outputs and real-time pricing (RTP), spatially scheduling for fast charging demand and temporally scheduling for normal charging demand; (2) the object-ive function of the proposed temporal-spatial scheduling strategy considers both the reliable and economical
network operation, trying to improve the utilization effi-ciency of DGs as well as reduce the cost of PEV charging considering RTP.
The remainder of this paper is organized as follows: Section 2 introduces the characteristics of two PEV char-ging modes, and presents the framework of the temporal-spatial scheduling strategy; Section 3 presents the mathematical formulation of the temporal-spatial scheduling strategy; Section 4 evaluates the benefits of the temporal-spatial scheduling strategy through a set of simulations with field data; finally, a set of conclusive remarks are given in Section 5.
2 The framework of the temporal-spatial schedul-ing strategy
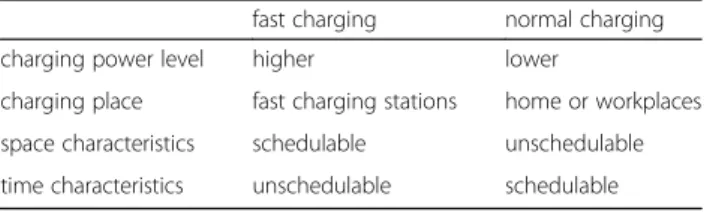
Currently, two PEV charging modes are widely adopted: normal charging mode at home or parking lots with lower charging power level, and fast charging mode at fast charging stations with higher charging power level, the typical charging duration is 20–30 min [18]. Besides the charging power level, the characteristics of such two charging modes are also intrinsically different. When a PEV is driving to the destination but theSoCis too low to complete the rest trip, it should find a fast charging station to get charged with the fast charging mode as soon as possible. However, the normal charging often happens when a PEV arrives at home or workplaces and it doesn’t hurry to get fully charged [19, 20].
Therefore, it is obvious that the PEV fast charging de-mand is unpostponable and uninterruptible, but the PEVs with fast charging demand can be scheduled to get charged in an optimal fast charging station. The fast charging demand of PEVs can be considered spatially schedulable but temporally unschedulable. On the con-trary, the normal charging demand is interruptible, which can be shifted over time, but the charging place is totally fixed. The normal charging time can be scheduled to consume the DGs optimally with minimal cost, which means the normal charging demand can be considered temporally schedulable but spatially unschedulable.
The differences of these two PEV charging modes are illustrated in detailed in Table 1.
Because of the totally different characteristics of two PEV charging modes, the PEV charging scheduling strat-egy should consider two types of the PEV charging de-mand separately. The framework of the proposed
Table 1The characteristics of two PEV charging modes
fast charging normal charging
charging power level higher lower
charging place fast charging stations home or workplaces
space characteristics schedulable unschedulable
temporal-spatial scheduling strategy of PEV charging is shown in Fig. 1. As mentioned before, the normal ging demand is scheduled temporally and the fast char-ging demand is scheduled spatially, in order to achieve the optimal interaction with DGs and grids.
The proposed temporal-spatial scheduling solution aims to meet the PEV charging demand with minimal cost as well as optimize the DG utilization efficiency both temporally and spatially. PEVs can be assumed as mobile energy storage units which are considered with more flexible and less economical cost compared with the traditional battery energy storage.
3 The formulation of the temporal-spatial sched-uling strategy
Based on the characteristics of two PEV charging modes illustrated in Section 2, the temporal-spatial scheduling strategy separately schedules PEV normal charging de-mand and fast charging dede-mand temporally and spatially.
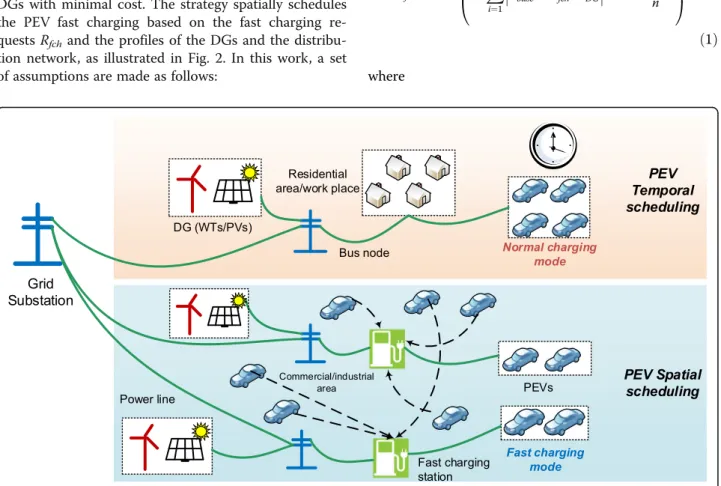
3.1 Spatial scheduling strategy of fast charging
The spatial scheduling strategy aims to spatially schedule the PEVs with fast charging demand to get charged at optimal fast charging stations to consume the outputs of DGs with minimal cost. The strategy spatially schedules the PEV fast charging based on the fast charging re-questsRfch and the profiles of the DGs and the
distribu-tion network, as illustrated in Fig. 2. In this work, a set of assumptions are made as follows:
(1)There assumes to be a geographical area with several PEV fast charging stations in the distribution network, and each charging station is assumed to be connected by a DG;
(2)The whole day is divided into 48 time slots (i.e. 30 min per slot) [19,20], and the output of DGs, the demand of baseload, and RTP are assumed to be detectable at the start of each time slot and remain unchanged during each time slot;
(3)The PEVs are assumed to keep driving if theSoCis more than 0.3. When theSoCis lower than 0.3 when the current time slot ends, the PEV needs to get charged in fast charging mode in the next time slot; (4)There assumes to be an aggregation center with the
access to theSoCand the location information of each PEV with the message format ofRfch(SoC,
location), to schedule the PEV fast charging behaviors at the start of each time slots.
The objective function Ffch aims to improve the
utilization efficiency of DGs, at the meanwhile reduce the cost of charging, as shown in (1):
minFfch¼ min ω1
Xm
i¼1
Pi
baseþPifch−PiDG
þω2
P j−1
n costj
n 0
B B @
1 C C A
ð1Þ
where
DG (WTs/PVs)
Residential area/work place
Normal charging mode Bus node
Grid Substation
Fast charging station Power line
PEVs
Fast charging mode Commercial/industrial
area
PEV Spatial scheduling
PEV Temporal scheduling
cost¼ð1−SoC0Þ⋅Cbat⋅RTPþdis⋅Ec⋅RTP ð2Þ
ω1andω2e assigned a value according to the different situation.
The first term in the objective functionFfchrepresents
the sum of the active power in each station, to make sure that the electric energy generated by DGs can be consumed spatially by PEVs as much as possible; the second term represents the average charging cost of each PEV. The total charging cost also consists of two parts, as shown in (2). The first part is the charging cost to fully charge the battery, and the second part repre-sents the scheduling cost (i.e. the distance to the object-ive station). The variables in this objectobject-ive function are
the different charging places for each PEV with fast charging demand.
The objective function is subject to:
ΔUk <0:1⋅U0;∀k¼1;2;⋯;l ð3Þ
dis<SoC0⋅Cbat
Ec ð
4Þ
where (3) means the voltage fluctuation on bus node k
cannot exceed the upper and lower bounds of the node voltage; and (4) means that the PEVs cannot be scheduled to a charging station farther than the remaining mileage.
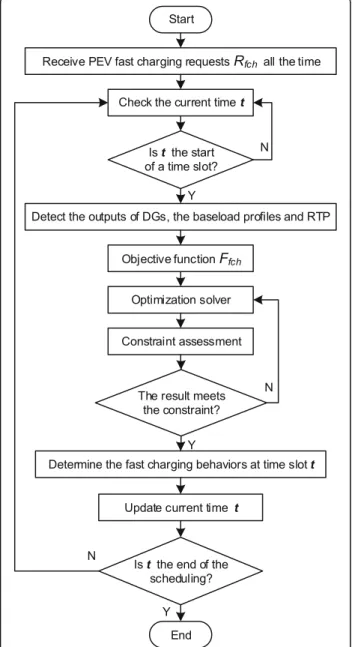
The proposed spatial scheduling strategy of PEV fast charging demand is carried out at the start of each time slot. Once the fast charging behaviors of all PEVs are de-termined by the scheduling strategy, the PEVs with fast charging demand will get charged in the assigned char-ging stations. Likely, in the next time slot, the DG out-put generation, the baseline demand, and RTP can be accurately detected again. Thus, the spatial scheduling strategy will repeat in every time slot with real-time in-formation, which can ensure the real-time performance of the scheduling strategy.
Through the proposed spatial scheduling strategy of PEV fast charging demand, the electric power generated by DGs can be scheduled spatially to be consumed by PEV fast charging demand as much as possible with minimal cost. Moreover, the active power on every bus node in the distribution network will be more balanced.
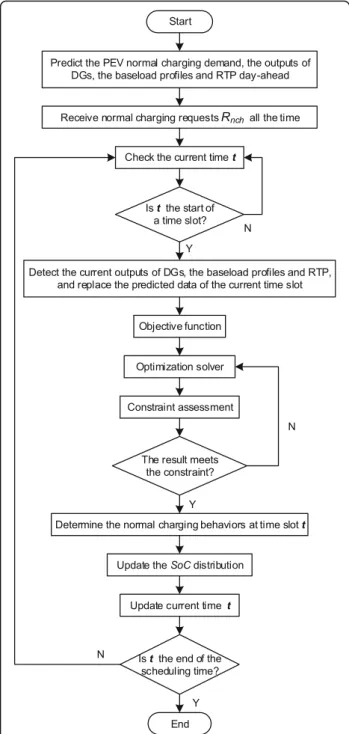
3.2 Temporal scheduling strategy of normal charging Unlike the PEV spatial scheduling, the temporal schedul-ing strategy aims to temporally schedule the PEVs with normal charging demand to get charged in optimal times to consume the distributed generation with min-imal cost. The strategy schedules the PEV normal char-ging demand based on the normal charchar-ging requests Rnch, the outputs of DGs, and the baseload profiles of
the charging bus node, as illustrated in Fig. 3. Here, the following assumptions are made:
(1)The whole day is divided into 48 time slots (i.e. 30 min per slot), and the output of DGs, the demand of baseload, and RTP are assumed to be predictable day-ahead and remain unchanged during each time slot;
(2)There is assumed to be an aggregation center able to communicate with each PEV, schedule the normal charging behaviors and estimate PEV normal charging demand in the future;
(3)When a PEV arrives at home, if theSoCis less than 0.8, it is assumed to have a normal charging request to get fully charged at night;
(4)PEV sends a message to the aggregation center when it arrives at home, including the information of arrival time, currentSoC, battery capacity, and leaving time, with the format ofRnch(ta,SoC0,Cbat,tend).
The objective function Fnch also aims to improve the
utilization efficiency of DGs, at the meanwhile reduce the cost of charging, as shown in (5):
minFnch¼ min ω1
X48
t¼1
PtbaseþPtnch−PtDG
þω2Xn
j¼1
costtj
!!
ð5Þ
where
Xn
j¼1
costj¼Pnch⋅RTP⋅T ð6Þ
ω1andω2are coefficient factors, which can be assigned a value according to the different situation.
The first term in the objective functionFnchrepresents
the active power on a certain bus in 48 time slots to make sure that the electric energy generated by DGs can be consumed temporally by PEVs as much as possible; the second term represents the total charging cost in each time slot, as shown in (6). As the time slot is 30 min long,T equals 0.5. The variables in this objective function are the different charging time slots for the PEVs with normal charging demand.
The objective function is subject to:
ΔUktj<0:1⋅U0;∀t¼1;2;⋯;48;∀k¼1;2;⋯;l
ð7Þ
SoCtend ¼1 ð8Þ
where ΔUkt in (7) represents the voltage fluctuation on bus nodekat time slott, which means the voltage fluc-tuation of each bus node in each time slot cannot exceed the upper and lower bounds of the node voltage; and (8) means that the battery should be fully charged at the leaving time tend. It should be noticed about the con-straint (7) that although the proposed temporal schedul-ing strategy of normal chargschedul-ing focuses on the fixed charging node, the influence on the distribution network still needs to be considered.
As the temporal profiles of distribution networks in the future are needed in the proposed temporal schedul-ing strategy, the outputs of DGs, the demand of base-load, and RTP should be predicted day-ahead, and the predicting algorithm is available in [21]. Moreover, the temporal PEV normal charging demand in the future is also needed to be estimated, which can be obtained from the modeling approach in [19, 20] Once the normal charging behaviors in the current time slot of all PEVs Fig. 3The flowchart of temporal scheduling strategy of normal
charging
Table 2PEV battery capacity parameters
battery type M1 N1
Cbat(kWh) μMCbat1 ¼28:5σ M1 cbat¼14:7
cM1
max¼72:0cMmin1 ¼10:0
μN1 Cbat¼23:0σ
N1 cbat¼9:5
cN1
max¼40:0cNmin1 ¼9:6
Ec(kWh/km) EM1
c ¼0:159 E
N1 c ¼0:185
are determined by the strategy, theSoC distribution (i.e. the expected charging duration) of PEVs with normal charging demand in the next time slot can be updated, and the real-time output of DGs, the baseload profiles and the RTP can also be detected to replace the predicted data. Thus, the temporal scheduling strategy will repeat in each time slot, which can ensure the real-time perform-ance and the accuracy of the scheduling strategy.
Through the proposed temporal scheduling strategy of PEV normal charging, the electric power generated by DGs can get consumed by PEV normal charging de-mand as much as possible with minimal cost in every time slot. Moreover, the active power on the charging bus node in every time slot will also be more balanced.
In a word, based on the proposed temporal-spatial scheduling strategy, the PEV charging demand can be separately scheduled to consume the electric power gen-erated by DGs with minimal cost temporally and spatially, and the operation of the distribution networks can become more reliable and economical.
4 Case studies and simulation results
This section carries out a set of case studies to imple-ment and justify the effectiveness of the proposed solution.
4.1 Statistics and assumptions
In this work, normal charging mode and fast charging mode are both adopted with the typical charging power Pn−ch and Pf−ch of 3.3 kW (220 V/15A) and 50 kW
(400 V/125A), respectively [22]. In addition, the battery capacity of typical PEVs can be obtained from [23], which follows the normal distributionN(μ,σ2), as shown in Table 2.
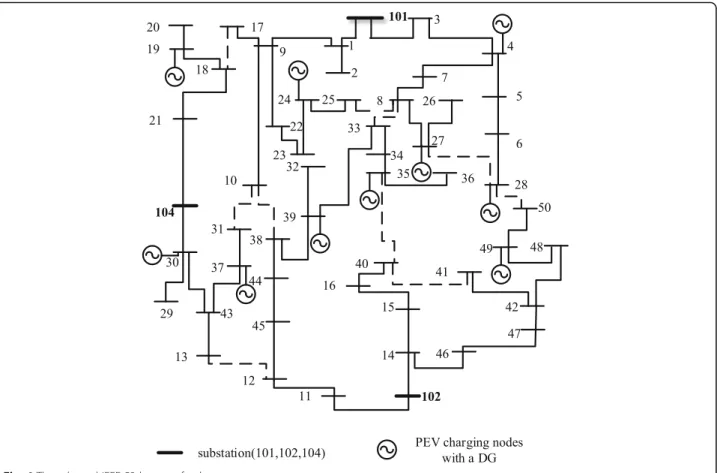
The IEEE 53-bus test feeder is adopted in this work to further demonstrate the effectiveness of the proposed temporal-spatial scheduling strategy of PEV charging [24]. The typical daily baseload curve in Beijing are obtained from [25] and scaled down proportionally. As Fig. 4The adopted IEEE 53-bus test feeder
is shown in Fig. 4, there assumes to be 10 PEV charging nodes in the distribution network, and each node is con-nected by a DG, which is assumed to be a combination of photovoltaic (PV) and wind turbine, with the typical daily curve of output shown in Fig. 5, which can be pre-dicted day-ahead [26, 27]. In addition, the typical daily curve of RTP is shown in Fig. 6, which is also assumed to be day-ahead predictable [28].
Furthermore, the PEV home arrival time can be ob-tained from National Household Travel Survey (NHTS) [29], and the normal charging demand is estimated based on the modeling approach in [19, 20]. It is assumed that there are in totalnfch= 104PEVs in this geographical area
in fast charging scenario and there arennch=500 PEVs on
each bus node to get normal charged in normal charging scenario. The initialSoC of two scheduling scenarios are both assumed to follow the normal distribution N(μ,σ2) with the mean valueμand the standard deviationσof 0.5 and 0.1. In addition, the distance from the PEV current lo-cation to each charging station is assumed to follow the normal distributionN(15, 42).
4.2 Spatial scheduling strategy of fast charging
The proposed spatial scheduling strategy is applied in a geographical area, such as the adopted IEEE 53-bus test feeder. It should be noticed that the spatial scheduling strat-egy in each time slot is independent from each other. The scenario at 17:00 is carried out for an example as follows.
Case 1: uncoordinated charging strategy.
In the uncoordinated charging strategy, the charging behaviors are totally uncontrolled. Thus all PEVs with fast charging requests will get charged in the nearest charging station, as shown in (9),
disj¼ mindis ð9Þ
where dis is the vector of the distances dis from the PEV current location to each charging station.
In this case, the function (1) can be easily calculated. Case 2: the proposed spatial scheduling strategy. PEVs with fast charging demand are scheduled to the optimal charging stations according to the proposed spatial scheduling strategy, as illustrated in Section 3.1. The objective function (1) can be solved using YALMIP optimization toolbox in MATLAB. Moreover, the optimization result is also verified by MATPOWER6.0 in MATLAB, in order to ensure the result satisfies the voltage fluctuation constraint (3). If the result exceeds the voltage constraint, the optimization process will re-peat again to find the next optimal result that satisfies the voltage fluctuation constraint.
The numerical results for two different cases are pre-sented in Table 3. It can be observed that the proposed spatial scheduling strategy can significantly improve the utilization efficiency of DGs with a little cost increase. The charging cost increases because the PEV will be scheduled to a farther charging station to consume the output of DGs. However, the increase of cost is too small, which can be ignored according to the results in Table 3.
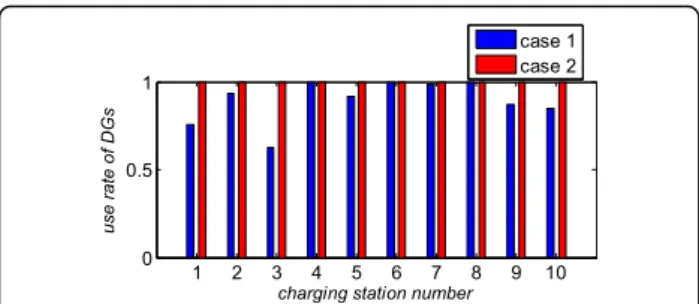
In order to further demonstrate the benefits of the proposed spatial scheduling strategy, the utilization effi-ciency of DGs in two cases are shown in Fig. 7, and the active power flow from/to the grid in each charging sta-tion is shown in Fig. 8. It can be seen that the utilizasta-tion efficiency of all DGs is improved and the active power on the bus nodes of each charging station becomes more spatially balanced.
In addition, Table 3 provides the standard deviation of the bus voltage in the test network. It is obvious that the voltage profiles also become better by the proposed spatial scheduling strategy compared with uncoordinated case, which will be more effective when the penetration of PEVs and DGs gets larger.
4.3 Temporal scheduling strategy of normal charging The proposed temporal scheduling strategy is applied in fixed bus nodes of the distribution network, as shown in Fig. 4. In this work, there are also two cases in temporal scheduling strategy for PEV normal charging mode.
Case 1: uncoordinated charging strategy. Fig. 6The adopted RTP scheme in simulations
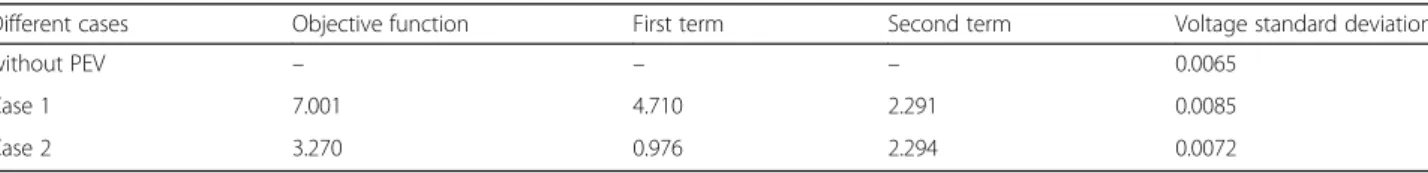
Table 3The numerical results of two evaluated cases
Different cases Objective function First term Second term Voltage standard deviation
without PEV – – – 0.0065
Case 1 7.001 4.710 2.291 0.0085
In the uncoordinated charging strategy, the charging behaviors are totally uncontrolled. All PEVs will start normal charging as soon as they arrive at home, as shown in (10). Moreover, the normal charging is also un-interrupted until the battery is fully charged.
tsc¼ta ð10Þ
Case 2: the proposed temporal scheduling strategy. As is mentioned in Section 3.2, the objective function (5) can be also solved using YALMIP optimization tool-box in MATLAB. As same as Section 4.2, the optimization result is also verified by MATPOWER6.0 in MATLAB, in order to ensure the result satisfies the voltage fluctuation constraint (7). If the result exceeds the voltage constraint, the optimization process will be repeated again to identify the eligible solution.
The results of two cases are shown in Table 4. It can be observed that the proposed temporal scheduling strategy can significantly improve the utilization effi-ciency of DGs and reduce the charging cost.
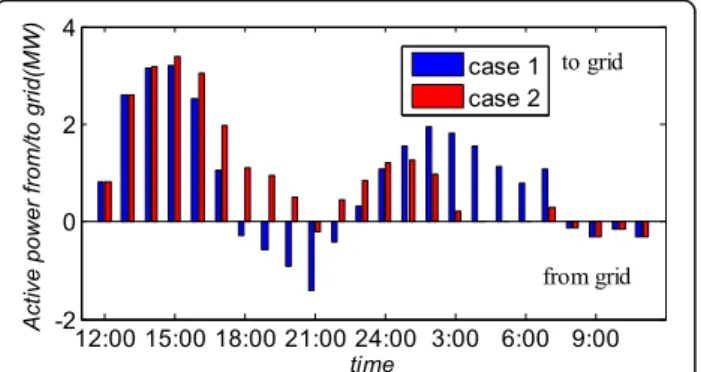
In order to further demonstrate the benefits of the proposed temporal scheduling strategy, the utilization efficiency of DGs in two cases are shown in Fig. 9. Through the proposed temporal scheduling strategy, the PEV normal charging can avoid the peak time of RTP (i.e. 18:00 pm-20:00 pm), and the utilization efficiency of DGs in most of time slots (i.e. 24:00 pm-6:00 am) is sig-nificantly improved. In addition, the active power flow from/to the grid during a day is shown in Fig. 10. The
fluctuation of the active power flow becomes more bal-anced during a day through the proposed temporal scheduling strategy. It should be noted that at 17:00 pm–20:00 pm, the PEV normal charging demand is scheduled to other time to avoid the peak hours of RTP.
5 Conclusions and future work
This paper presented a novel temporal-spatial optimal scheduling strategy of PEV charging demand with the existence of DGs. PEV is assumed to be excellent mobile energy storage to optimally consume the distributed generation temporally and spatially. The PEV charging behaviors are separately scheduled temporally and spatially based on the characteristics of two PEV char-ging modes, normal charchar-ging and fast charchar-ging. The ob-jective function aims to improve the utilization efficiency of DGs, at the meanwhile reduce the cost of charging under RTP. The proposed scheduling strategy is further carried out for a series of case studies with field data and reasonable assumptions. The results dem-onstrate the benefits of the proposed strategy consider-ing the large-scale integration of PEVs and DGs.
In the future, a number of directions are considered worth further research efforts. The temporal-spatial strategy can be extended to schedule the two PEV char-ging behaviors simultaneously; the traffic networks can also be adopted into the spatial scheduling strategy to obtain accurate distance information; and the scheduling of PEV normal charging demand can be further devel-oped as an intelligent house system with some certain household applications. The research outcome will be provided in future publications.
Fig. 7DG utilization efficiency (fast charging)
Fig. 8The active power from/to the grid in each station
Table 4The results of two cases
Different cases Objective function First term Second term
Case 1 46.09 29.09 17.00
Case 2 35.88 23.86 12.03
6 Nomenclature 6.1 PEV related variables CbatPEV battery capacity.
costPEV charging cost.
disDistance to a charging station of a PEV. EcEnergy consumption per kilometer of battery.
msMarket share of each type of PEVs. nNumber of PEVs.
PfchPEV fast charging demand.
Pf−chFast charging power.
PnchPEV normal charging demand.
Pn−chNormal charging power.
RfchMessage format of fast charging.
RnchMessage format of normal charging.
SoC0InitialSoCof charging. taHome arrival time.
tendLeaving time.
tscCharging start time.
6.2 DG and grid related variables iNumber of fast charging stations.
kNumber of bus nodes.
lMaximum number of bus nodes.
mMaximum number of fast charging stations. PbaseBaseload demand.
PDGOutput of DGs.
RTPReal-time pricing. U0Standard node voltage. ΔUVoltage fluctuation. ω1Coefficient factor. ω2Coefficient factor.
Acknowledgements
This work is supported by in part by The National Key Research and Development Program of China (Basic Research Class 2017YFB0903000) -Basic Theories and Methods of Analysis and Control of the Cyber Physical Systems for Power Grid, and the Natural Science Foundation of Zhejiang Province (LZ15E070001).
Authors’contributions
QY conceived and designed the study. QY and SS performed the experiments. QY and SS wrote the paper. QY, SS and WY reviewed and edited the manuscript. All authors read and approve the manuscript.
Competing interests
The authors declare that they have no competing interests.
Received: 3 June 2017 Accepted: 8 September 2017
References
1. Mukherjee, J. C., & Gupta, A. (Jan. 2017). Distributed charge scheduling of plug-in electric vehicles using inter-aggregator collaboration.IEEE Transactions on Smart Grid, 8(1), 331–341.
2. National Bureau of Statistics of the People’s Republic of China,“Statistical communique on national economic and social development in 2015”, Available [Online]: http://www.stats.gov.cn/tjsj/zxfb/201602/t20160229_ 1323991.html, Feb. 2016.
3. Wu, T., Yang, Q., Bao, Z., & Yan, W. (Sept. 2013). Coordinated energy dispatching in microgrid with wind power generation and plug-in electric vehicles.IEEE Trans Smart Grid, 4(3), 1453–1463.
4. Yao, W., Chung, C. Y., Wen, F., Qin, M., & Xue, Y. (Jan. 2016). Scenario-based comprehensive expansion planning for distribution systems considering integration of plug-in electric vehicles.IEEE Trans Power Syst, 31(1), 317–328. 5. Alahyari, A., Fotuhi-Firuzabad, M., & Rastegar, M. (July 2015). Incorporating
customer reliability cost in PEV charge scheduling schemes considering vehicle-to-home capability.IEEE Trans Veh Technol, 64(7), 2783–2791. 6. Tang, W., Bi, S., & Zhang, Y. J. (Nov. 2014). Online coordinated charging
decision algorithm for electric vehicles without future information.IEEE Transactions on Smart Grid, 5(6), 2810–2824.
7. Xu, Z., Su, W., Hu, Z., Song, Y., & Zhang, H. (Jan. 2016). A hierarchical framework for coordinated charging of plug-in electric vehicles in China.
IEEE Transactions on Smart Grid, 7(1), 428–438.
8. March 2017). A model predictive control approach for low-complexity electric vehicle charging scheduling: Optimality and scalability.IEEE Trans Power Syst,32(2), 1050–1063.W. Tang and Y. J. (Angela) Zhang, "A model predictive control approach for low-complexity electric vehicle charging scheduling: Optimality and scalability,"IEEE Trans Power Syst, vol.32, no. 2, pp. 1050–1063, March2017.
9. A. Chiş, J. Lundén and V. Koivunen, "Scheduling of plug-in electric vehicle battery charging with price prediction,"IEEE PES ISGT Europe2013, pp. 1–5, Lyngby, 2013.
10. I. Momber and T. Gómez, "The effect of mobility forecasts for stochastic charge scheduling of aggregated PEV,"IEEE PES ISGT Europe2013, pp. 1–5, Lyngby, 2013.
11. Arif, A. I., Ahamed, T. P. I., & Al-Ammar, E. A. (2013). Pursuit algorithm for scheduling PEV charging. In4th International Conference on Power Engineering, Energy and Electrical Drives(pp. 915–920). Istanbul. 12. C. Le Floch, F. Belletti, S. Saxena, A. M. Bayen and S. Moura, "Distributed
optimal charging of electric vehicles for demand response and load shaping," 201554th IEEE Conference on Decision and Control (CDC), pp. 6570–6576, Osaka, 2015.
13. A. Chiş, J. Lundén and V. Koivunen, "Optimization of plug-in electric vehicle charging with forecasted price," 2015IEEE International Conference on Acoustics, Speech and Signal Processing (ICASSP), pp. 2086-2089, South Brisbane, QLD, 2015.
14. González Vayá, M., & Andersson, G. (April 2016). Self-scheduling of plug-in electric vehicle aggregator to provide balancing services for wind power.
IEEE Transactions on Sustainable Energy, 7(2), 886–899.
15. Delfino, F., Minciardi, R., Pampararo, F., & Robba, M. (July 2014). A multilevel approach for the optimal control of distributed energy resources and storage.IEEE Transactions on Smart Grid, 5(4), 2155–2162.
16. Foster, J. M., Trevino, G., Kuss, M., & Caramanis, M. C. (Dec. 2013). Plug-in electric vehicle and voltage support for distributed solar: Theory and application.IEEE Syst J, 7(4), 881–888.
17. R. Arulbel Benela and K. Jamuna, "Design of charging unit for electric vehicles using solar power", 2013International Conference on Information Communication and Embedded Systems (ICICES), pp. 919–924, Chennai, 2013. 18. Ismail, M., Bayram, I. S., Abdallah, M., Serpedin, E., & Qaraqe, K. (2015).
Optimal planning of fast PEV charging facilities. March: IEEE Smart Grid and Renewable Energy.
19. S. Sun, Q. Yang, W. Yan, "A novel Markov-based temporal-SoC analysis for characterizing PEV charging demand,"IEEE Transactions on Industrial Informatics, no.99, pp.1–1, doi: https://doi.org/10.1109/TII.2017.2720694, 2017.
20. S. Sun, Q. Yang and W. Yan, "A novel statistical Markov-based approach for modeling charging demand of plug-in electric vehicles," 2016China International Conference on Electricity Distribution (CICED), pp. 1–6, Xi'an, 2016.
21. Ruan, B., Yang, Q., Fang, X., & Yan, W. (2014). Demand response under real-time pricing for domestic energy system with DGs. In2014 International Conference on Power System Technology(pp. 3103–3110). Chengdu. 22. Li, G., & Zhang, X. P. (March 2012). Modeling of plug-in hybrid electric
vehicle charging demand in probabilistic power flow calculations.IEEE Transactions on Smart Grid, 3(1), 492–499.
23. Transport Research & Innovation Portal,“Mobile Energy Resources in Grids of Electricity”, Available [Online]: http://www.transport-research.info/sites/ default/files/project/documents/20140203_154622_76425_Deliverable_2.1_ Modelling_Electric_Storage_devices_for_Electric_Vehicles.pdf.
24. Romero, R., Franco, J. F., & Leão, F. B. (Mar. 2016). A new mathematical model for the restoration problem in balanced radial distribution systems.
IEEE Trans Power Syst, 31(2), 1259–1268.
25. .L. Feng,“Electric vehicle charging station planning”, Ph.D. dissertation, Tianjin University, Tianjin, China, 2013.
26. The Wind Power, Available [Online]: http://www.thewindpower.net/. 27. The California Energy Almanac, Available [Online]: http://energyalmanac.ca.
gov/renewables/solar/PV.html.
28. AMEO, Available [Online]: http://www.ameo.com.au/Electricity/Data/Price-and-Demand.