DOI: 10.12962/j20882033.v31i1.6326
ORIGINAL RESEARCH
THE SUITABILITY EVALUATION OF PROCUREMENT
INFORMATION SYSTEMS TO THE NEEDS OF USERS AND
MANAGEMENT USING HUMAN, ORGANIZATION,
TECHNOLOGY-FIT (HOT-FIT) FRAMEWORK
Dwi Cahyono
1| Erma Suryani*
21Dept. of Technology Management, Institut
Teknologi Sepuluh Nopember, Surabaya, Indonesia
2Dept. of Information System, Institut
Teknologi Sepuluh Nopember, Surabaya, Indonesia
Correspondence
*Erma Suryani, Dept. of Information System, Institut Teknologi Sepuluh Nopember, Surabaya, Indonesia. Email: [email protected]
Present Address
Gedung Sistem Informasi, Kampus ITS Sukolilo, Surabaya 60111, Indonesia
Abstract
Management Information System (MIS) in government institutions is vital in sup-porting excellent services to the community. The established MIS often provides less optimum benefits since the MIS development did not go through a proper planning and was not supported by a clear IT Masterplan. Therefore, an evaluation of the MIS implementation is needed. There are three main aspects that needs to be evaluated, i.e. human, organization, and technology. The procurement unit of Malang City has an MIS for procurement submission called siBaja. It has been on production since 2016. This study aims to evaluate the suitability of siBaja based on Human, Organi-zationi, Technology-Fit (HOT-Fit) framework. A data was collected from end-users through a survey method. The data analysis was modeled using SEM-PLS. We found that the implementation of siBaja was not fully fit with respect to human-technology relationship. It was indicated by the absence of a significant effect between the user satisfaction and service quality variables with a significance value of 0.899 atα=
0.05. Thus, it was not fully fit for organization-technology relationship. It was indi-cated by the absence of a significant effect between service control, internal control variables with a significance value of 0.221 atα= 0.05.
KEYWORDS:
its use, especially those experienced by PPK users and Pokja users because it was a newly understood system. Therefore ULP tried to make socialization of information on how to use the application, so it was necessary to test the implementation of this SiBaja to determine whether the application was effective under the needs of the user and ULP management. The research uses a Human-Organization-Technology-Fit (HOT-Fit) framework developed by Maryati Mohd. Yusof because this framework can explain the evaluation of IS comprehensively with the approach of core components, including Human, Organization, and Technology, and the suitability of the three components as a successful implementation of MIS.
2
LITERATURE REVIEW
2.1
Management Information System (MIS)
According to[1], Information Systems (IS) are complementary networks between hardware, software, people, and
organiza-tions that jointly perform the funcorganiza-tions of collecting, filtering, processing, making, and distributing data to support operational, management, and decision making under organizational goals.
2.2
SiBaja
SiBaja is a web-based MIS owned by ULP of Malang City to manage the procurement submissions at the http://sibaja.malangkota.go.id. It aims to provide convenience for the Commitment Making Officer (PPK) in sending the pro-curement submission files to be processed through an online e-propro-curement mechanism. Figure 1 shows the architecture. Using SiBaja guarantees the clarity of the process in verifying the bid package documents for PPK so that weaknesses of the old procurement method by correspondence can be minimized.
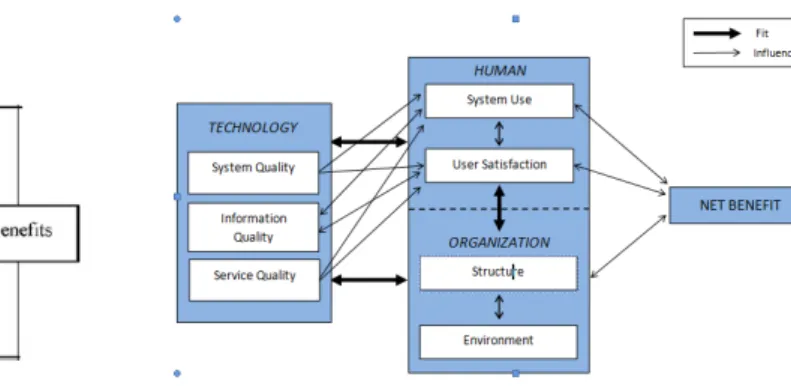
FIGURE 3 IS Success Model Framework. FIGURE 4 HOT-Fit Framework.
2.3
Information System Evaluation
IS evaluation is an effort to define how good IS operation is in an organization implementing it to improve its performance. Evaluation can be conducted if implemented in the organization that has been operating for a certain period under the design stages and types of programs created and implemented.
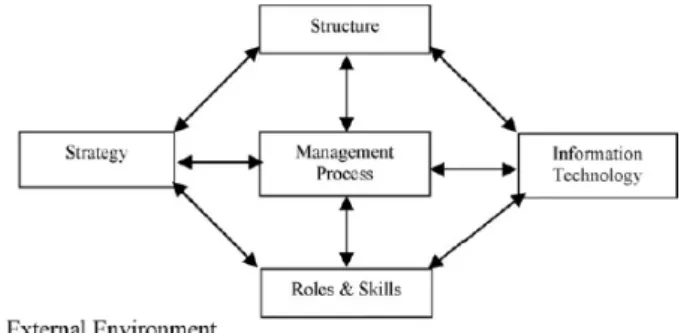
In 1990 a IS evaluation framework was developed and so called IT Organization Fit Model by Michael S. Scott Morton of the MIT Sloan School of Management covers each internal and external element’s fit, as in Figure 2 . Internal fit is achieved by a dynamic balance of organizational components, including business strategy, organizational structure, management processes, and role of skills. External fit is achieved by planning organizational strategy based on environmental trends and changes such as markets, industry, and technology. In this internal and external fit, IT acts as an enabler, so IT is expected to affect the management process, impacting organizational performance, and impacts on organizational strategies at a certain level. The IS Success Model by DeLone-McLean explains that the success of an IS implementation highly depends on six mea-surements of IS success, i.e. system quality, information quality, service quality, system use, user satisfaction, and net benefig (organizational impact). Figure 3 shows the model. According to DeLone and McLean, the success of IS can be measured by measuring Net Benefit got based on two dimensions, namely the quality dimensions (quality of IS, quality of information and quality of service) and the dimensions of use (intensity of use of IS) and user satisfaction. DeLone and McLean found that system quality and information quality had a direct effect on the satisfaction of IS users.
The HOT-Fit framework is one of the theoretical frameworks developed by[2]to assess the successful implementation of an IS.
The HOT-Fit framework is a combination of the IS Success Model of Delone and Mclean and the IT Organization Fit Model by Scott Morton. Figure 4 shows the framework. In the HOT-fit, the fit is shown by the ability of IS, humans, and IS settings to align with one another. Suitability can be measured and analyzed from various compatibility among Human, Organization, and Technology or includes the relationship between humans and organizations, people with technology, organizations, and technology using several evaluation measures existing in these three factors.
The HOT-Fit framework consists of the two elements, i.e. organizational factors and conformity between Human, organizational, and technological factors. The last three factors are related to the six dimensions of IS success, namely system quality (SQ), information quality (IQ), service quality (SerQ), system use (SU), user satisfaction (US), and net benefit (NB). These dimensions affect one another. The SysQ, IQ, and SerQ jointly affect SU and US. THe SU and IQ affect each other or have a reciprocal relationship with each other. The SU and US affect US. The SU and US directly affect and has a reciprocal relationship to NB. Finally, there are also two-way relationship between the dimensions of IQ and SU, and the bidirectional relationship between IQ and US.
Research[3]assumed that differences in organizational characteristics, business processes, organizational culture, and
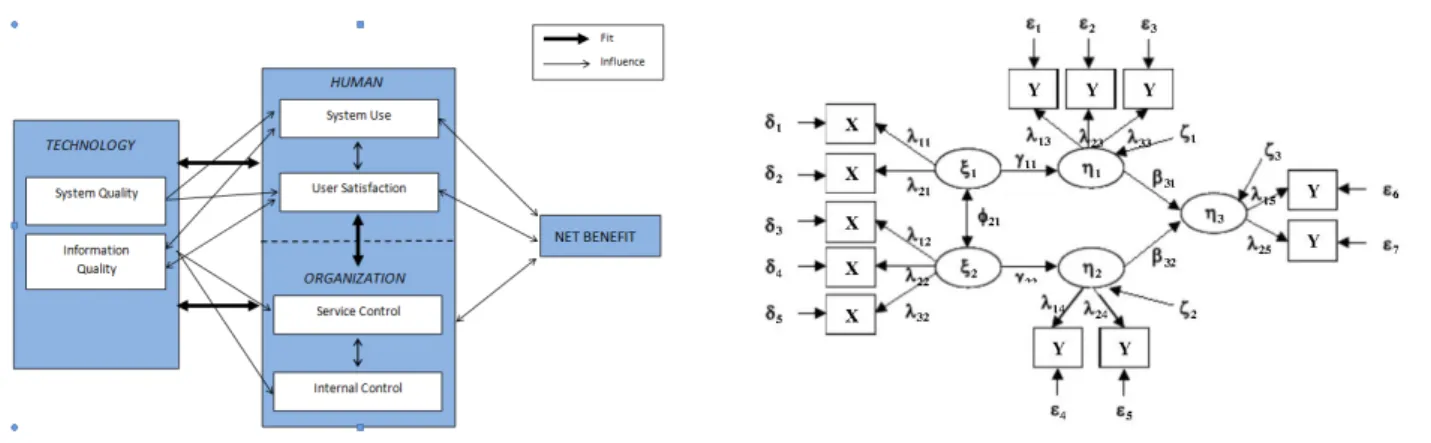
FIGURE 5 The conceptual model. FIGURE 6 The structural equation model.
to assess IS’s success and acceptance, especially in government institutions that usually have characteristics of mandatory IS implementation.
Research[4]mentioned that the dimension of Service Quality was not used as a stand-alone system measurement variable as used
in previous studies, namely[2]. Still, it was part of the Service Control provided by the organization because of the mandatory
nature of the IS mentioned earlier. The conceptual model for the development of the HOT-Fit framework in this study, as shown in Figure 5 , was implemented through the following steps. First, we bring together the variables on the service quality dimension (SerQ) into the service control dimension (Service Control-SC). Second, we add a dimension of internal control (IC) on Organizational factors (Organization).
2.4
Structural Equation Modeling (SEM)
Data analysis technique using SEM to explain the relationship between variables in the study. The data analysis technique of SEM is used to do not design theory but aimed to examine and justify a model. Therefore the main requirement to use SEM is to build a hypothesis model comprising structural models and measurement models in the form of path charts based on theoretical justification shown as Figure 6 .
2.5
Partial Least Square (PLS) Analysis
PLS is a multivariate statistical technique that makes comparisons between multiple dependent variables and multiple indepen-dent variables. The PLS is designed to solve numerous regressions when specific problems occur in data such as the small size of the research sample, missing data or missing values , and multicollinearity.
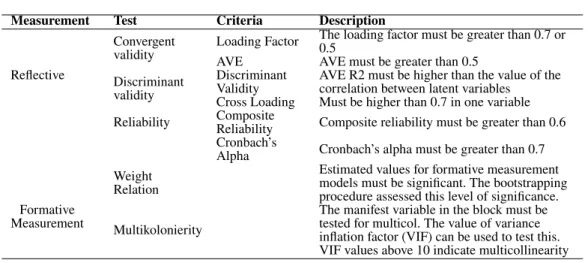
In the measurement of reflective models, the PLS assesses measurements using reliability and validity. For testing reliability, you can use the Cronbach’s alpha parameter. The Cronbach’s alpha value reflects the reliability of all indicators in the model. Table 1 shows the outer model criteria. The minimum value is 0.7, while the ideal value is 0.8 or 0.9. Besides Cronbach’s Alpha, the value ofρc (Composite Reliability) is used, which is interpreted to be the same as the value of Cronbach’s Alpha. Each latent variable must be able to explain each indicator variant at least 50%. Therefore, the absolute correlation between the latent variable and the indicator must be> 0.7 (absolute value of outer loading factor or called outer loadings), so we should remove the reflective indicator from the measurement model if it has an outer Loading Factor value below 0.4.
According to[5], the evaluation of structural models is carried out to see the relationship between latent variables by looking at
TABLE 1 The outer model criteria.
Measurement Test Criteria Description
Reflective
Convergent
validity Loading Factor
The loading factor must be greater than 0.7 or 0.5
AVE AVE must be greater than 0.5 Discriminant
validity
Discriminant
Validity AVE R2 must be higher than the value of thecorrelation between latent variables Cross Loading Must be higher than 0.7 in one variable Reliability CompositeReliability Composite reliability must be greater than 0.6
Cronbach’s
Alpha Cronbach’s alpha must be greater than 0.7
Formative Measurement
Weight Relation
Estimated values for formative measurement models must be significant. The bootstrapping procedure assessed this level of significance.
Multikolonierity
The manifest variable in the block must be tested for multicol. The value of variance inflation factor (VIF) can be used to test this. VIF values above 10 indicate multicollinearity
TABLE 2 The inner model.
Criteria Description
R2 for endogenous
latent variables R2 results of 0.75, 0.5, and 0.25 for endogenous latent vari-ables in the structural model indicate that the model is "good," "moderate," and "weak."
Estimated path
coefficient The estimated value for the path relationship in the structuralmodel must be significant. The bootstrapping procedure can obtain this significance value.
3
RESULTS AND DISCUSSION
3.1
Literature Review
Information collected included information on the construction and use of SiBaja that were sourced from management, legal protection, and literature from relevant prior research.
3.2
Research Design
The research conducted was quantitative non-experimental-correlational research with a case study and explanatory research design. There are twelve hyphotheses which were tested in this study. They are as follows.
H0 There is no significant positive correlation between organizational factors (Organization) on achieving the net benefits (Net
Benefits) of IS implementation.
H1 Organizational factors (Organization) correlate positively and significantly to the achievement of net benefits (Net Benefit)
for IS implementation.
H2 User Satisfaction (US) has a positive and significant effect on Net Benefit (NB)
H3 System Use (SU) has a positive and significant effect on Net Benefit (NB)
H4 User Satisfaction (US) has a positive and significant effect on System Use (SU)
H5 Service Control (SC) has a positive and significant effect on Internal Control (IC)
H6 Information Quality (IQ) has a positive and significant effect on Internal Control (IC)
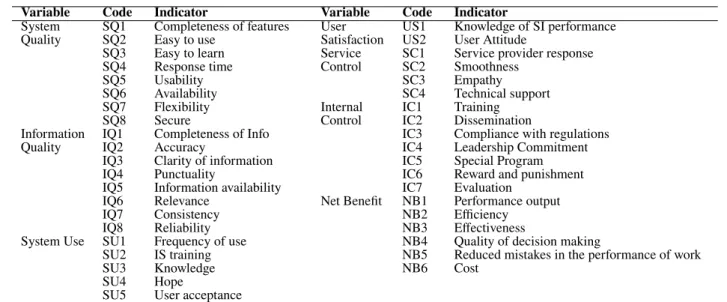
IQ4 Punctuality IC6 Reward and punishment IQ5 Information availability IC7 Evaluation
IQ6 Relevance Net Benefit NB1 Performance output
IQ7 Consistency NB2 Efficiency
IQ8 Reliability NB3 Effectiveness
System Use SU1 Frequency of use NB4 Quality of decision making
SU2 IS training NB5 Reduced mistakes in the performance of work
SU3 Knowledge NB6 Cost
SU4 Hope
SU5 User acceptance
TABLE 4 The distribution of respondents.
Role User Type Population
Administrator Internal users 1
Service Administrator 1
Distribution Administrator 1
Pokja 28
OPD Administrator External users 28
PPK 85
H8 Information Quality (IQ) has a positive and significant effect on User Satisfaction (US)
H9 Information Quality (IQ) has a positive and significant effect on System Use (SU)
H10 System Quality (SQ) has a positive and significant effect on User Satisfaction (US)
H11 System Quality (SQ) has a positive and significant effect on System Use (SU)
3.3
Operational Variables And Indicators
There are seven variables used in this study. Table 3 shows detail indicators of each variables. There are two independent variables, namely the System Quality (SQ) variable and the Information Quality (IQ) variable. There are also five dependent variables, including the System Use (SU) variable, the User Satisfaction (US) variable, the Service Control variable (SC), the Internal Control variable (IC), and the Net Benefit variable (NB).
3.4
Population and Sample
TABLE 5 Goodness of fit.
Variable AVE Commonality CR α
SQ 0.827 0.827 0.868 0.453
IQ 0.929 0.929 0.942 0.669
SU 0.730 0.730 0.804 0.484
US 0.876 0.876 0.941 0.889
SC 0.896 0.896 0.928 0.763
IC 0.834 0.834 0.876 0.504
NB 0.920 0.920 0.938 0.716
3.5
Data Collection
Secondary data were obtained from a literature review in the form of literature books, journals, previous research results, and data collected from the ULP management of Malang City. In contrast, we obtained the primary data from questionnaires. The stages of preparing the questionnaire in this study were started by interpreting each dimension in the proposed research model into one measurable statement comprising variables and indicators. Questionnaire data were descriptively analyzed using the PLS Structural Equation Modeling (SEM) analysis method with the SmartPLS program.
3.6
Data Analysis Using SEM
Processed data on the results of the questionnaire answers by respondents using Partial Least Square (PLS).
4
RESULT AND DISCUSSION
Data collection on a sample of 144 siBaja populations was conducted for one week. There are 103 respondents obtained, which comprise of 25 respondents from OPD Admin user (89.29%), 24 respondents from pokja ULP user (85.71%), and 51 respondent from PPK users (60%). There is also one respondent from each Administrator user, Service Admin user, and Distribution Admin user.
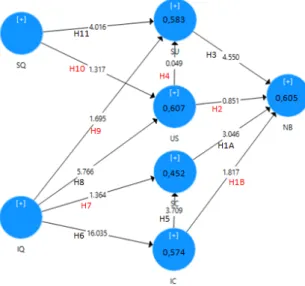
4.1. PLS Analysis (1) Outer Model Testing Measurement Model (Outer Model) Test used a questionnaire data validity test and a questionnaire data reliability test. The validity test of the questionnaire data was carried out using the loading factor and Average Variance Extracted (AVE) parameters while testing the validity of the data assisted by the SmartPLS program using the "PLS Algorithm" method. To test the questionnaire data’s reliability, the researcher used Composite Reliability and Cronbach’s Alpha using the "PLS algorithm" method. Cronbach’s Alpha was one of the values measuring the internal consistency of a latent variable. The latent variable was declared reliable if it had a Cronbach’s alpha value of over 0.7. Figure 7 shows the analysis result on the model using Partial Least Square (PLS).
Based on Figure 7 , all indicators of the SQ, the IQ, the SU, the US, the SC, the IC, and the NB variables have met the requirements of concurrent validity testing respectively with a loading factor of over 0.5.
Table 5 shows the result of goodness of fit analysis. AVE value of all variables meet the requirement of over 0.50. Meanwhile, the Cronbach Alpha value and the Composite Reliability value meet the requirements of over 0.70 except for the System Quality (SQ) and System Use (SU) variables. Given these results, the process can be moved forward to next stage. The next process is removing indicators from the System Quality variable (SQ) and System Use (SU) variables that do not meet these requirements. The structural model testing (Inner Model) in this study used two criteria: R-Square (R2) criteria for endogenous latent variables and path coefficient criteria. Tests using the R2 value criteria were used to explain the effect of certain (exogenous) latent variables on (endogenous) latent variables. R2 values of 0.75, 0.5, and 0.25 for endogenous latent variables in the structural model showed that the model was "good", "moderate", and "weak" based on[5].
FIGURE 7 Analysis result on the outer model.
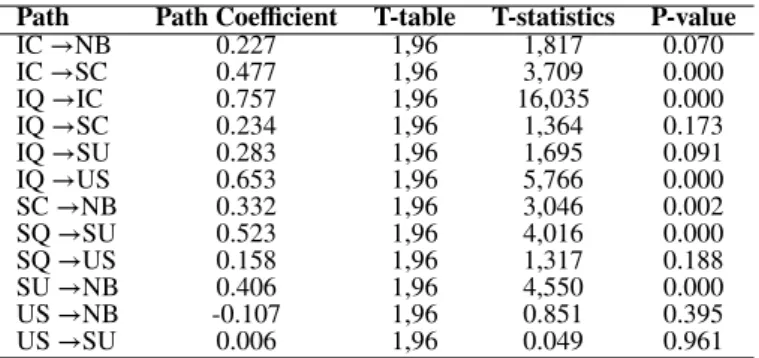
TABLE 6 Test result of inner model using path coefficient criteria.
Path Path Coefficient T-table T-statistics P-value
IC →NB 0.227 1,96 1,817 0.070
IC →SC 0.477 1,96 3,709 0.000
IQ →IC 0.757 1,96 16,035 0.000
IQ →SC 0.234 1,96 1,364 0.173
IQ →SU 0.283 1,96 1,695 0.091
IQ →US 0.653 1,96 5,766 0.000
SC →NB 0.332 1,96 3,046 0.002
SQ →SU 0.523 1,96 4,016 0.000
SQ →US 0.158 1,96 1,317 0.188
SU →NB 0.406 1,96 4,550 0.000
US →NB -0.107 1,96 0.851 0.395
US →SU 0.006 1,96 0.049 0.961
FIGURE 8 The hypothesis testing model. FIGURE 9 Final conceptual model.
TABLE 7 Test result of hypothesis.
Hypothesis Variable Path Coefficient P-value Result
H0 SC →NB (Rejected)
H1a SC →NB 0.332 0.002 Positive and Significant (Accepted) H1b IC →NB 0.227 0.070 Positive but Not Significant (Rejected) H2 US →NB -0.107 0.395 Negative but Not Significant (Rejected) H3 SU →NB 0.406 0.000 Positive and Significant (Accepted)
5
CONCLUSION
This study aims to evaluate the suitability of siBaja to the needs of users and management using Human, Organization, Technology-Fit (HOT-Fit) framework with some modifications. The implementation of SiBaja is not yet fully fit according to the relationship between human-technology, which is shown by the absence of a significant effect between the variables of the User Satisfaction (US) and System Quality (SQ). This is indicated by the path coefficient value of 0.158 and the t-value 1,317 (<1,96) and P-value 0.188 (α>0.05). Furthermore, the implementation of SiBaja is not yet fully fit according to the relationship between organization-technology, as evidenced by the absence of a significant effect between the Information Quality (IQ) vari-able and the Service Control (SC) varivari-able. This is indicated by the path coefficient of 0.234 and the t-value 1,364(<1,96) with P-value 0.173 (α>0.05).
Future research direction would be analyzing the model using other tool, i.e. Generalized Structured Component Analysis (GeSCA). The goal is to provide evidence on the relationship between latent variables which contains reciprocal effects.
References
1. Behl JAOGMMR. MANAGEMENT INFORMATION SYSTEM. 10 edition ed. New Delhi: McGraw Hill; 2010.
2. Yusof MM, Kuljis J, Papazafeiropoulou A, Stergioulas LK. An Evaluation Framework for Health Information Sys-tems: Human, Organization and Technology-Fit Factors (HOT-fit). International Journal of Medical Informatics 2008 jun;77(6):386–398.