John J. Tobin2,3, Amelia M. Stutz4, P. Manoj5, S. Thomas Megeath6, Agata Karska7,
Zsofia Nagy6, Friedrich Wyrowski8, William Fischer6,9, Dan M. Watson10, Thomas Stanke11
ABSTRACT
We present CARMA CO (J = 1 → 0) observations and Herschel PACS
spectroscopy, characterizing the outflow properties toward extremely young and deeply embedded protostars in the Orion molecular clouds. The sample comprises a subset of the Orion protostars known as the PACS Bright Red Sources (PBRS)
(Stutz et al.). We observed 14 PBRS with CARMA and 8 of these 14 with
Her-schel, acquiring full spectral scans from 55µm to 200µm. Outflows are detected
in CO (J = 1→0) from 8 of 14 PBRS, with two additional tentative detections;
outflows are also detected from the outbursting protostar HOPS 223 (V2775 Ori) and the Class I protostar HOPS 68. The outflows have a range of morphologies,
some are spatially compact, <10000 AU in extent, while others extend beyond
the primary beam. The outflow velocities and morphologies are consistent with
1Herschel is an ESA space observatory with science instruments provided by European-led Principal
Investigator consortia and with important participation from NASA.
2Veni Fellow, Leiden Observatory, Leiden University, P.O. Box 9513, 2300-RA Leiden, The Netherlands;
3National Radio Astronomy Observatory, Charlottesville, VA 22903, USA 4Max-Planck-Institut f¨ur Astronomie, D-69117 Heidelberg, Germany
5Department of Astronomy and Astrophysics, Tata Institute of Fundamental Research, Colaba, Mumbai
400005, India
6Ritter Astrophysical Research Center, Department of Physics and Astronomy, University of Toledo,
Toledo, OH 43560
7Centre for Astronomy, Nicolaus Copernicus University, Faculty of Physics, Astronomy and Informatics,
Grudziadzka 5, PL-87100 Torun, Poland
8Max-Planck-Institut f¨ur Radioastronomie, Auf dem H¨ugel 69, 53121, Bonn, Germany 9NASA Goddard Space Flight Center, 8800 Greenbelt Road, Greenbelt, MD 20771 10Department of Physics and Astronomy, University of Rochester, Rochester, NY 14627 11European Southern Observatory, 85748 Garching bei M¨unchen, Germany
being dominated by intermediate inclination angles (80◦ ≥ i ≥20◦). This
con-firms the interpretation of the very red 24µm to 70µm colors of the PBRS as a
signpost of high envelope densities, with only one (possibly two) cases of the red
colors resulting from edge-on inclinations. We detect high-J (Jup >13) CO lines
and/or H2O lines from 5 of 8 PBRS and only for those with detected CO outflows.
The far-infrared CO rotation temperatures of the detected PBRS are marginally
colder (∼230 K) than those observed for most protostars (∼300 K), and only one
of these 5 PBRS has detected [OI] 63µm emission. The high envelope densities
could be obscuring some [OI] emission and cause a ∼20 K reduction to the CO
rotation temperatures.
1. Introduction
The earliest stage of the star formation process is characterized by a dense, infalling envelope of gas and dust surrounding a nascent protostar. This early phase, in particular, is known to be associated with powerful outflows (Arce et al. 2007; Frank et al. 2014). These outflows may ultimately play a role in halting the mass infall process and dispersing the envelope (Arce & Sargent 2006), thereby contributing to the overall low efficiency of the star formation process (Offner & Arce 2014). These outflows develop rapidly and with velocities
of∼10 - 100 km s−1 the outflows may propagate by 0.1 pc in 10,000 yr - 1,000 yr timescales.
Therefore, outflows are important to characterize at the youngest possible ages in order to understand their early evolution.
The youngest identified protostars are known as Class 0 sources (Andre et al. 1993); they are distinguished from more-evolved Class I sources by their cold bolometric temperatures
(Tbol < 70 K; (Myers & Ladd 1993)) and/or ratio of submillimeter luminosity (Lsubmm) to
bolometric luminosity (Lbol) being > 0.5%. These diagnostics indicate that Class 0 sources
typically have denser and more massive infalling envelopes than Class I sources. In addition to the Class 0 sources, an earlier phase of the star formation process has been postulated, the first hydrostatic cores (FHSC; e.g., Larson 1969). A number of candidate FHSCs have been identified (Enoch et al. 2010; Chen et al. 2010; Pineda et al. 2011; Schnee et al. 2012); moreover, candidate FHSCs have quite low luminosities and bear some similarity to the
Spitzer-identified very low-luminosity sources (VeLLOs Young et al. 2004; Dunham et al. 2006). The exact nature of the VeLLOs and candidate FHSCs remains unclear as it is difficult to distinguish bonafide FHSCs from sources that will go on to form very low mass stars (Dunham et al. 2014).
et al. 2010; Ali et al. 2010; Manoj et al. 2013; Furlan et al. 2016), a sample of 19 protostars
with bright 70 µm and 160µm emission and correspondingly faint or undetected (8 sources)
24µm emission were detected in the Orion star forming region (Stutz et al. 2013, hereafter
ST13). We refer to these protostars as the PACS Bright Red Sources (PBRS); of the 19
PBRS, 12 were first identified as protostars by Herschel and 7 Spitzer-identified protostars
also fulfilled the 24 µm to 70 µm color criteria (ST13). The PBRS are not low-luminosity
like the VeLLOs and candidate FHSCs; they have bolometric luminosities (Lbol) ranging
between 0.65 L and 30.6 L, with a median Lbol of∼3 L. Thus, the PBRS are the largest
sample of extremely young protostars with typical luminosities; the median luminosity of
Class 0 protostars is 3.5 L in Orion and 1.4 L in the nearby clouds (Dunham et al. 2014).
While the PBRS have only been well-characterized in Orion, similar examples are present in more nearby clouds (e.g., VLA 1623, IRAS 16293-2422), and Sadavoy et al. (2014) identified
several protostars in Perseus that were not classified as protostars in Spitzer or undetected
at 24 µm (i.e., HH211-mms Rebull et al. 2007).
We further characterized the envelopes of 14 PBRS using observations of the 2.9 mm dust continuum (Tobin et al. 2015); that study, hereafter Paper I, focused specifically on the most
deeply embedded andHerschel-identified sources. The observed PBRS were all detected and
found to have among the largest 2.9 mm luminosities of known Class 0 protostars. We also found that 6 out of 14 have visibility amplitudes that are flat within increasing uv-distance. The flat visibility amplitudes indicate that the 2.9 mm emission is very concentrated, and this finding, together with the high 2.9 mm luminosities, confirms that most PBRS have dense envelopes. This corroborates the interpretation of the spectral energy distribution (SED) model comparisons in ST13. The characterization of the PBRS from both the SEDs and millimeter continuum have led us to conclude that the PBRS may be among the youngest Class 0 objects. If the PBRS represent a distinct portion of early Class 0 evolution, as suggested by ST13, then the relative numbers of PBRS to Class 0 sources in Orion indicates
that a ‘PBRS phase’ could last ∼25,000 yr. This estimate assumes that the Class 0 phase
lasts ∼150,000 yr (Dunham et al. 2014).
A remaining source of uncertainty in the interpretation of the PBRS as the youngest Class 0 protostars is their unknown disk/envelope inclination angles with respect to the plane of the sky. There is a degeneracy between high envelope densities versus high (nearly
edge-on) inclinations that could not be mitigated due to the lack of emission shortward of 10 µm
to examine the outflow properties of the youngest protostars.
The jets and outflows from protostars are detected with a variety of complementary methods and the types of outflows and the ways to detect them also vary with evolution. Collimated jets detected in optical or near-infrared line emission are typically associated with more evolved Class I or Class II sources (Reipurth et al. 1997, 2010, e.g., HH111), while Class 0 protostars typically have a molecular outflow observable in only millimeter lines of CO and other molecules (Arce et al. 2007; Frank et al. 2014). However, this does not mean there is no collimated jet emission, just that it may be undetectable due to high levels of obscuration. The molecular outflow emission toward some low-mass protostars has an angular dependence of velocity, with low-velocity material at the edges of the outflow cavity
and velocities as high as ∼ 100 km s−1 along the main axis of the outflow (e.g.,
Santiago-Garc´ıa et al. 2009; Hirano et al. 2010). Jet-like features can also be seen in shock-tracing molecules such as SiO and SO (e.g., Lee et al. 2008, 2009). The velocity gradients along the outflow axis also offer crucial information of disk-protostar orientation (e.g., Cabrit & Bertout 1986; Lee et al. 2000).
Far-infrared spectroscopy with the Infrared Space Observatory and the Herschel Space
Observatory has also been found to be an excellent probe of the physical conditions of
outflows from young stars. The high-J CO (Ju > 13) and H2O transitions, in addition to
OH and [OI] transitions, probe the warm and hot outflow conditions on scales very near the protostar and the jet driving source (e.g., van Kempen et al. 2010; Karska et al. 2013; Green et al. 2013; Manoj et al. 2013). The lines are thought to be excited primarily by shocks
(Manoj et al. 2013), with UV radiation photo-dissociating H2O, causing lower abundances
relative to non-irradiated shock models (Karska et al. 2014).
The initial development of the outflows and their subsequent breakout from their sur-rounding envelopes are still quite uncertain. Outflows have also been detected from VeLLOs and candidate FHSCs (Dunham et al. 2011; Pineda et al. 2011; Schnee et al. 2012; Tobin et al. 2015). Theory has predicted that such young objects can indeed produce the slow
outflows (∼2 - 7 km s−1) that have been observed (Price et al. 2012), and the outflows
may develop prior to the formation of a rotationally-supported accretion disk (e.g., Li et al. 2013, 2014). However, it is still uncertain how quickly more powerful outflows emerge in protostars; do the outflows have a steady growth in power as the source luminosity (from accretion) increases or do they only become powerful once a certain threshold in luminosity is reached?
In order to examine the outflow conditions from the youngest known Class 0
proto-stars, we have obtained interferometric observations of the CO (J = 1 →0) molecular line
Orion A and B molecular clouds. The youth and number of PBRS sources in Orion offers an unique opportunity to examine the properties of outflows toward objects that are con-sistent with being among the youngest protostars. Furthermore, spectrally and spatially resolved observations of the molecular outflows toward these protostars will enable us to constrain the range of possible inclination angles of the protostellar sources, ensuring that their characterization as the youngest protostars is not strongly influenced by orientation.
We have observed 14 PBRS (from the full sample of 19 cataloged by Stutz et al. (2013) and Paper I) with the Combined Array for Research in Millimeter-wave Astronomy
(CARMA), focusing on the Herschel-detected PBRS sample. We observed the protostars
in both the dust continuum and spectral line emission to examine the envelope and outflow properties of these sources. We discuss the observations in Section 2, our outflow results
from CO (J = 1→0) and Herschel spectroscopy are presented in Section 3, we discuss the
results in Section 4, and summarize our main conclusions in Section 5.
2. Observations and Data Reduction
2.1. CARMA Observations
We conducted observations toward 14 out of 19 of the PBRS identified in ST13 with
CARMA in the D-configuration (∼500resolution) during late 2012 and early 2014 and
follow-up observations in C-configuration (∼200resolution) for some in early 2014. The observations
were conducted with the main CARMA array comprised of 6 - 10.4 m and 9 - 6.1 m antennas. We observed two or three sources per track and configured the correlator with four 500 MHz
continuum windows, two 8 MHz windows to observe para-NH2D (J = 111→101) and C18O
(J = 1 → 0), and the two 31 MHz windows for observation of 13CO (J = 1 → 0) and
12CO (J = 1→0). The C-configuration observations had five 500MHz continuum windows
because we did not observe para-NH2D in that configuration. The continuum observations
were presented in Tobin et al. (2015) and here we will present only the 12CO (J = 1 →0)
results because other lines did not yield strong detections. Our sensitivity is typically 0.15
Jy beam−1 channel −1 for the CO (J = 1 → 0) in 0.5 km s−1 channels. We used standard
procedures within the MIRIAD software package (Sault et al. 1995) to edit, reduce, and image the data; all maps were reconstructed with natural weighting. The CARMA observation log
is given in Table 1. The absolute flux calibration uncertainty is ∼10-20%. The largest
angular scale that can be recovered from observations is ∼2000; we estimate this number to
2.2. Herschel PACS Spectroscopy Observations
We also observed 8 PBRS sources with the Photodetector Array Camera and
Spectrom-eter (PACS; Poglitsch et al. 2010) on the Herschel Space Observatory (Pilbratt et al. 2010)
as part of program OT2 jtobin 2; we also observed the Class I protostar HOPS 347. The
PACS spectrometer is a far-infrared integral field spectrograph with a 5×5 spaxel (spatial
pixel) foot print and spaxel sizes of 900, for more information see Poglitsch et al. (2010).
We conducted full range scans of the entire spectral range from ∼55 µm to ∼ 200 µm
in standard chop-nod mode. Table 2 lists the observations dates and observations ids for the observed sources. The PACS range scan spectra were reduced using HIPE 13.0 SPG v11.1.0, calibration tree version 56. The root-mean-squared absolute flux calibration uncertainty of
the PACS spectra is∼12%.
The line spectroscopy observations of the [OI] 63.18 µm transition were conducted in
unchopped mode. The unchopped mode uses separately defined off positions away from the cloud to prevent corrupting the [OI] line with a contaminated off position in chop-nod mode. This mode was necessary because extended [OI] emission is very prevalent in the Orion molecular cloud. The use of unchopped mode will, however, result in foreground/background [OI] emission on the surrounding molecular cloud being preserved, in addition to that of the protostar itself. These observations were taken in bright line mode, which has less redundancy at each wavelength than faint line mode. The data used in this paper are the from the default archive reduction from science product generation version 12.1.0 and utilizing PACS calibration tree version 65.
In this paper, we are making use of the flux densities derived from the central spaxel, corrected for the point spread function losses. For flat-fielding, we use the observed relative spectral response function (RSRF) rather that the telescope background method.
2.3. Magellan Near-infrared Observations
We observed the source HOPS 68 with the Magellan Baade telescope, located at Las Campanas in Chile on 2009 January 17. The observations were conducted with the Persson
Auxiliary Nasmyth Infrared Camera (PANIC, Martini et al. 2004), which has 20 ×20 field of
view on a 1024×1024 pixel detector. HOPS 68 was observed in Ks-band using a 3×3 dither
pattern with 20 second integrations at each dither position and 1500 steps between dither
observations; see Tobin et al. (2010) for a description of the methods used.
2.4. Sample and Sub-samples
The observations and results presented in this paper are based on sub-samples of the
PBRS sample presented in ST13. ST13 identified 18 sources with [24µm]−[70µm] colors
(in log (λFλ) space) redder than 1.65. Of this sample, 11 were first discovered with Herschel
observations and 7 were previously known HOPS protostars from the Spitzer surveys of the
region that met the redness criteria. Furthermore, an additional PBRS (135003) was not included in ST13, but was first presented in Paper I, bringing the total number of PBRS to 19. We list the full sample of PBRS in Table 3 and identify those that have been
followed-up with CARMA and Herschel PACS Spectroscopy. The CARMA follow-up concentrated
primarily on sources that had not been previously identified by Spitzer as protostars due to
their deeply embedded nature, rendering them faint or undetected at 24 µm. The Herschel
PACS spectroscopy then concentrated on theHerschel-identified PBRS that had been found
in the HOPS data that had been analyzed prior to the Herschel Open Time 2 proposal
deadline. Thus, our source follow-up is not homogeneous, but there is enough overlap in order to identify characteristic trends within the sample and sub-samples which we will detail in the following sections.
3. Results
We have compiled a significant amount of data to further characterize the PBRS and their outflow properties. We will first discuss the cold molecular outflows probed by CARMA
CO (J = 1→0) and probe scales beyond those examined by CARMA using Spitzer 4.5 µm
emission. Lastly, we will discuss the results for the warm and hot components of the
molecu-lar outflows withHerschel PACS spectroscopy and place the properties of the PBRS outflows
3.1. Molecular Outflows
The 12CO (J = 1 → 0) molecular line was observed to examine the outflow activity
toward each source; this is the canonical tracer of outflowing gas toward protostellar objects (Snell et al. 1980). Outflows are generally characterized by distinct red and blue-shifted emission located on either side of the protostellar source, modulo inclination effects. The pervasiveness of CO in the Orion molecular cloud complicates analysis of outflows. Emission
at±2 km s−1 around the systemic velocity cannot be analyzed due to the12CO (J = 1→0)
emission being resolved-out due to confusion with the extended molecular cloud. Therefore, we are generally only able to detect outflow features that have velocities high enough to emit
outside the ±2 km s−1 velocity range.
3.1.1. Detections and Morphologies
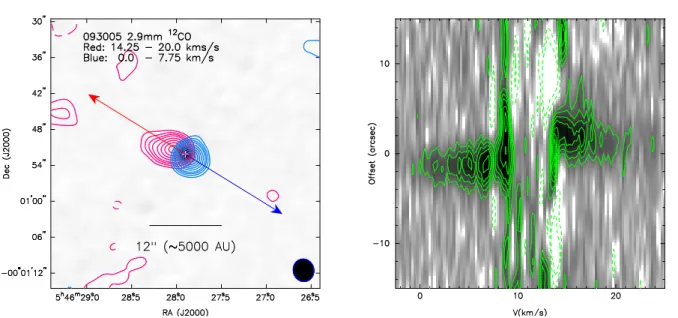
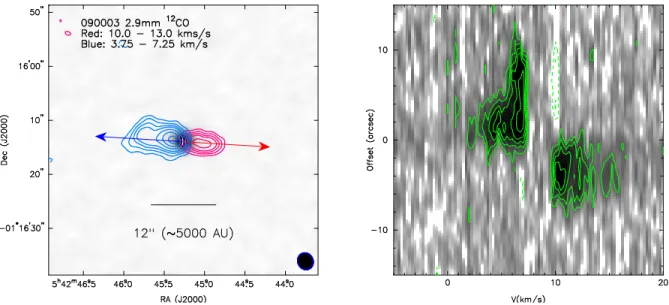
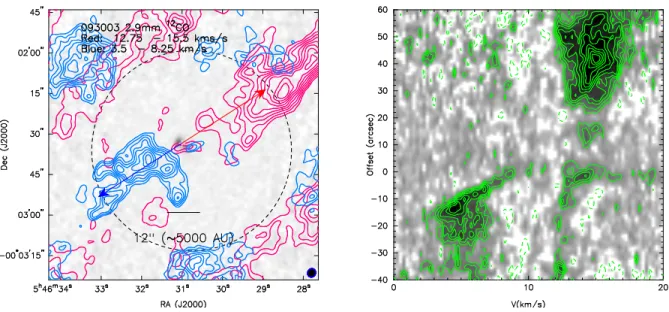
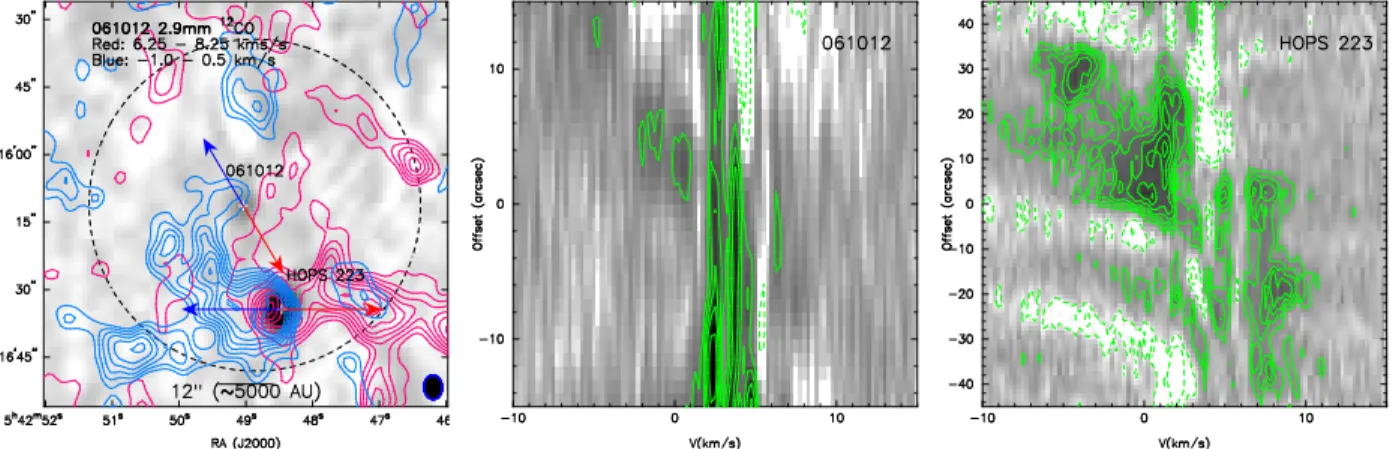
We detect clear CO outflows toward 7 PBRS sources 093005, 090003, 082012, 119019, 135003, HOPS 373 and 019004 (Figures 1, 2, 3, 4, 5, 6, & 7), as well as for the Class I source HOPS 68 in the field of 019003 shown in Figure 8. Tentative detections are found toward 3 additional PBRS 302002, 061012, and HOPS 372 (Figures 9, 10, & 3). The HOPS 372 outflow is apparent in the low-velocity panel of Figure 3, but at higher velocities the outflow emission is dominated by 082012. We did not detect outflow emission toward four PBRS 091015, 091016, 097002, and 082005; however, this does not mean that these sources do not have outflows, but that they were not detectable with our resolution and sensitivity.
The outflows have a variety of morphologies, there is not a typical CO outflow mor-phology toward the PBRS sources. The PBRS 093005 and 090003 have spatially compact outflows, with total lengths of the red and blue-shifted lobes being less than 0.05 pc (Figures 1 & 2). The outflows toward 119019, 082012, 135003, and HOPS 373 all extend outside the CARMA primary beam, with total lengths greater than 0.1 pc (Figures 3, 4, 5, and 6).
The outflows toward 082012 and 135003 also have emission extending to velocities > ± 10
km s−1 from the systemic velocity with jet-like morphologies.
Toward 061012, there is evidence for an outflow, but this is unclear due to confusion with the wide-angle outflow of its neighbor HOPS 223 (Figure 10). HOPS 223 (also known as V2775 Ori) is an outbursting Class I source (Fischer et al. 2012) and this is the first clear
detection of a CO outflow toward this source. However, the Spitzer imaging already showed
strong evidence for outflow-associated features. Toward 302002 (Figure 9) there appears to
be low-velocity 12CO emission in its vicinity that appears outflow-like, but its detection is
The outflow toward 119019 is distinct from the other PBRS in that it has a large spatial
extent, but at low-velocities; the full velocity width is only 6 km s−1for both the red and blue
sides of the outflow. Moreover, the spatial overlap between the redshifted and blueshifted emission is strong evidence that this source is viewed close to edge-on.
The non-detections of outflows toward 091015, 091016, 097002, and 082005 could re-sult from the outflows having low-velocities and being confused with the emission from the
molecular cloud. Also, there is a tentative trend between detectable outflows and Lbol. The
PBRS 119019 was the lowest luminosity source (Lbol = 1.56 L) with a clear outflow
detec-tion; the tentative outflow detections and non-detections have luminosities between 0.65 L
and 1.56 L. The outflow properties of individual sources are described in more detail in
the Appendix.
The outflow from HOPS 68 (Figure 8) is worth mentioning because it was also found to have quite high velocities, and the relative position angle of the red and blue-shifted lobes changes from high to low-velocity. At low velocities the outflow is oriented northeast to southwest, but at high velocities the red-shifted side is oriented northwest to southeast while the blue lobe still appears extended in the same direction as at low velocities. We overlaid
the high-velocity CO contours on a Ks-band (2.15µm) image from Magellan PANIC (Figure
8) and we see that there are two sets of bow-shock features that overlap with the blue-shifted CO emission. One set of features is in the southeast direction and the other set is in the south west direction. Thus, the change in position angle of the CO emission from low to high velocities is likely indicative of two outflows from HOPS 68.
3.1.2. Outflow Parameters
We calculate the outflow mass, momentum, and energy following the procedure used by Plunkett et al. (2013) (based on Bally et al. 1999), and give these values in Table 4.
The analysis by Plunkett et al. (2013) uses 13CO optical depths and excitation temperature
derived from12CO (assuming optically thick emission) in order to calculate column densities,
from which the mass, momentum, and energy can be calculated. However, our observations
did not have enough sensitivity to detect the 13CO (J = 1 → 0) outflow emission, we
therefore adopted a 12CO/13CO ratio of 62 (Langer & Penzias 1993) and divided the 12CO
(J = 1 → 0) intensities by this ratio, under the assumption that the 12CO emission is
optically thin at all velocities. This assumption is not valid at all velocities, but probably
most reasonable for the higher velocity (> ±10 km s−1)emission. The principal effect will
can be up to an order of magnitude; missing flux will also affect the parameters but this is more difficult to quantify since the low-velocity emission with the highest opacity will be
the most severely affected by spatial filtering. The 13CO abundance is taken to be N(13CO)
= N(H2)/7×105 Frerking et al. (1982) and the excitation temperature is calculated using
the 12CO brightness temperature and was between 15 K and 40 K in our observations (see
Equation 3 in Plunkett et al. 2013). We do not attempt to correct the outflow properties for the effects on inclination.
The observed outflow properties (mass, momenta, energy, and force; see Table 4) of the PBRS are generally consistent with results from Plunkett et al. (2013); however, there is a general tendency for lower values of mass, momentum, and energy for the PBRS, which could
result from the lack of13CO. We also computed the outflow force (F
CO) and dynamical time
based on the apparent outflow size and the maximum velocity of observed CO. We examined
the relationship between Lbol and FCO in Figure 11. For the PBRS with a detected outflow,
there is no clear correlation between FCO and Lbol, but more luminous sources tend to have
greater values of FCO. We have also plotted the relationships derived by Bontemps et al.
(1996) and van der Marel et al. (2013) for comparison. The relationships were derived from samples primarily comprised of Class I protostars and Class 0 protostars lie above the
relationship and not below; the CO (J = 6→5) measurements from Yıldız et al. (2015) for
Class 0 sources are also above the Bontemps et al. (1996) relationship. The relations do go through our observed the points, but four PBRS are found below the Bontemps et al. (1996) relationship. On the other hand we use interferometer data without zero-spacings, while the
other studies used single-dish maps. We also did not have 13 CO detections, making our
values lower limits. We do not calculate upper limits for the sources with non-detections because the large amount of resolved emission near the source velocities results in these values having little physical meaning. However, their outflow parameters will (at a minimum) be lower that those measured for 090003/093005.
3.1.3. Outflow Inclinations
The outflow inclinations are difficult to precisely measure; however, we qualitatively compared our data with the simulations of Cabrit & Bertout (1986), which show model PV plots and integrated intensity plots for accelerating outflows. Model outflows are shown for
a fixed opening angle and outflow length at inclinations of 5◦, 30◦, 50◦, and 80◦. As such,
the uncertainty in our estimates of the outflow inclination is likely ± ∼20◦. The outflows
of 090003, 093005, HOPS 223, and 019003 are consistent with an outflow inclinations near
well-collimated outflows of 082012, 135003, and HOPS 68 appear most consistent with an
inclination near 50◦. Both the wide-angle outflow toward HOPS 373 and the tenuous outflow
toward 302002 are consistent with having inclinations between 50◦ and 80◦; based on their
velocity distributions, HOPS 373 is likely closer to 50◦, while 302002 is likely closer to 80◦.
The PBRS 061012 appears to have an outflow, but the data do not lend themselves to a reasonable estimate of the inclination. Finally, 119019 is the only PBRS that is consistent with having a near edge-on inclination, as indicated by the CO emission only being detected at low velocities and the extended spatial overlap of the red and blue-shifted emission toward 119019.
We can broadly conclude that for the PBRS with detected outflows, extreme edge-on
orientations cannot be the cause of their extremely red 24 µm to 70 µm colors, except for
119019. The estimated inclinations for the PBRS are also given in Table 5. Furthermore, while there is a large degree in uncertainty in the outflow inclinations, it is most likely that the distribution of inclination angles appears dominated by intermediate inclinations
(80◦ ≥ i ≥20◦). While our numbers are small, the distribution is likely consistent with a
random distribution of inclinations (the average inclination for a random distribution is 60◦),
which is expected for a collection of sources whose selection criteria is not particularly biased toward a particular geometric orientation; as had been a previous concern with respect to the PBRS was they could have simply been edge-on sources and the outflow data show that this is clearly not the case. Given the uncertainty in the inclination angles, we have not corrected the derived outflow parameters in Table 4 for this effect.
3.2. Evidence for Extended Outflows
The CARMA 12CO observations are only sensitive to emission within the 3000 (12600
AU) radius primary beam, hence other observations are needed to determine if the outflows
extend to larger scales. We examined the Spitzer 4.5 µm images of all the sources from
Megeath et al. (2012). The emission at 4.5 µm can trace both scattered light in the outflow
cavities near the protostars and shock-excited H2emission along the outflows. Smooth 4.5µm
emission near the source is likely indicative of scattered light and knotty or bow shock-like
features along the outflow are likely H2 emission (e.g., Tobin et al. 2007). Images of the
4.5 µm emission are shown for all the sources in Figure 12a and 12b.
Toward the sources HOPS 373, 093005, 302002, and 090003 there is 4.5 µm emission
however, the outflow extends out of the primary beam, but perhaps not much further (Gibb & Little 2000).
There are a few cases where the association of the 4.5 µm emission with the outflow
is ambiguous. For 135003, there are some knotty features along the direction of the known
outflow, extending∼0.15 pc and was identified as an outflow candidate (SMZ 1-38) by Stanke
et al. (2002). Then in the case of 019003, we see a feature adjacent to the position of the protostellar source from the 2.9 mm continuum, and possibly an extended feature in the direction of the blue-shifted outflow lobe. The crowding and number of imaging artifacts from bright sources make this field difficult to interpret.
We only find clear evidence for 4.5 µm emission extended > 0.1 pc for three sources
082012, 061012, and 119019. The bow-shock directions or trail of H2 knots indicate a likely
origin from the PBRS source. The emission from 061012 and 119019 appears to extend∼0.3
pc and the emission from 082012 extends ∼0.2 pc. If we assume an outflow propagation
speed of 10 - 100 km s−1, then the dynamical time is between 3000 - 30000 yr for 0.3 pc and
2000 - 20000 yr for 0.2 pc. Thus, even though there is evidence for outflows toward these sources extending relatively large distances, extreme youth is still likely.
Toward the sources without detected CO (J = 1→0) outflows, 091015, 091016, 082005,
and 097002, there is also no evidence for 4.5 µm emission (or emission shortward of 70 µm)
associated with the sources, as shown in (see Figure 12a and 12b). Whereas, the sources
with compact emission at 4.5µm also had detections of CO outflows.
3.3. Warm/Hot Outflow Gas
We obtainedHerschel PACS spectroscopy toward a subset of the PBRS (eight observed
with PACS). This subset samples luminosities between 0.65 L and 12 L and a variety
of 12CO molecular outflow emission properties; thus, this subsample should be reasonably
representative of the PBRS as a whole. PACS spectroscopy offers a complementary view of the outflow emission from protostars; rather than the cold, entrained gas traced in the CO
(J = 1 →0) line, the PACS lines trace the warm/hot shock-heated portion of the outflow
concentrated on scales <2000 AU.
The continuum-subtracted PACS spectra for all observed sources, extracted from the central spaxel, are shown in Figure 13. The spectra have a wide variety of emission line strengths; detections in high-J CO and water are found toward 5 out of the 8 PBRS. The spectrum toward HOPS 373 is particularly strong and rich in line emission, detecting CO
all sources that exhibit a clear outflow in the CO (J = 1→0) transition. We calculate the total high-J CO luminosities and give their values in Table 6.
Figure 14 shows the non-continuum subtracted CO (J = 14 → 13) spectra for the all
observed sources. The PBRS 061012 has a tentative detection (2.5σ) in the CO (J = 14→
13) line, while its detection was not immediately apparent in the full spectrum shown in
Figure 13. However, 061012 does not have detected emission in the 179.5 µm H2O 212-101
line which typically has a line flux greater than or equal to the CO (J = 14 → 13) line.
Thus, the detection toward 061012 is considered tentative.
Observations were also obtained toward all the PBRS in unchopped line spectroscopy
observations of the [OI] 63.18 µm transition. This emission line is thought to be an tracer of
the protostellar jet, perhaps even before the molecular outflow is well-established (Hollenbach & McKee 1989). Since these observations were conducted in the unchopped mode, extended [OI] emission from the cloud is present in the spectral cubes. This extended [OI] emission from the cloud must be subtracted from the data in order to isolate [OI] emission from the protostar itself. To remove the extended [OI] (and continuum emission), we have calculated the median intensity at each wavelength in the spectral cube using the 18 edge spaxels. We also compute the standard deviation of the edge spaxel intensities at each wavelength, this is representative of the uncertainty in the background emission subtracted at each wavelength. We use the median intensity of the edge spaxels rather than the mean because some spaxels have very high intensities and the mean would be skewed toward a value larger than most of the edge spaxel intensities. The background subtracted [OI] spectra are shown toward each source in Figure 15 as the thick solid line and the standard deviation of the background at each wavelength is shown as the thin dashed line in Figure 15.
The only PBRS with a clear detection of the [OI] line is HOPS 373; 019003 at first
glance appears to have a detection, but it is ∼2σ above the uncertainty of the subtracted
background [OI] emission, so this detection is tentative. Furthermore, 119019 and 061012
have apparent peaks at location of the [OI] line; however, both of these are only 2σdetections
above the noise and other features are found in those spectral with the same significance, but do not correspond to an expected spectral feature. Therefore, neither of these sources are regarded as detections.
detected outflows), nor do the 8 pixels adjacent to the central spaxel show emission after background subtraction toward HOPS 373. Therefore, we conclude that the well-detected emission toward HOPS 373 is only detected in the central spaxel and we are not missing
extended flux at our sensitivity (σ[OI] ∼ 1 Jy channel−1), and we are not subtracting off
extended emission associated with the PBRS outflows.
We have examined the [OI] line luminosities with respect to larger protostar samples
from (Green et al. 2013) and Mottram et al. (2016, submitted). The ∼2σ [OI] detections
for 119019 and 062012 and 3σ upper limits for 093005, 091015, and 091016 have [OI]
lu-minosities upper limits consistent with the detected range of [OI] lulu-minosities for a given
Lbol (L[OI] = 10−5 - 10−2 L ; Green et al. 2013). Thus, the [OI] line is not found to be
particularly strong toward the PBRS, but we cannot say that the [OI] emission anomalously weak toward the PBRS given that the upper limits do not indicate [OI] luminosities to be
significantly lower than other protostars with a similar Lbol.
In addition to the [OI] 63.18 µm line, we examined the spectra for [OI] emission at
145.5 µm in the range scans. As shown in Figure 13, this line is only detected toward
019003. However, we do not think this is emission from the protostar itself, but extended emission that was not fully subtracted from the off position as some spaxels have a negative feature, while others have emission.
The [OI] 63 µm luminosity from post-J-shock gas can be used to calculate the mass
flow rate through the shock (Hollenbach & McKee 1989; Hollenbach 1985): M˙ = L([OI])
×8.1×10⁻⁵ M yr−1 L−1. Since our observations encompass, in each case, all the regions in
which the outflows from our targets drive shocks. Thus, the result is the mass-loss rate from the protostar, averaged over the outflow dynamical time. The [OI] luminosities and outflow rates inferred from the line luminosities (and their upper limits) are given in Table 6.
3.3.1. Extended emission
The high-J CO and water line emission is extended across multiple spaxels in some sources, the most obvious of which is 135003. We overlay the spectra in each spaxel on the
CO (J = 1→0) map in Figure 16a for the longer and shorter wavelength ends of the PACS
spectrometer red channel. H2O and CO emission is a detected in all spaxels that overlap
with the blue-shifted side of the CO (J = 1→0) outflow, and the line emission is actually
extended H2O and CO emission on the blue-shifted side of the CO (J = 1 → 0) and like
135003 the extended emission is also brighter than the central spaxel.
3.3.2. CO Luminosities and Rotation Temperatures
We have calculated the high-J CO luminosities and rotation temperatures for the 5 PBRS with multiple detected CO transitions. We calculate the column densities of each CO line and luminosity of each line following Manoj et al. (2013); however, instead of fitting Gaussian functions to the unresolved line profiles, we directly sum the spectral elements around the wavelength of a particular CO line and subtract the background emission esti-mated from line-free continuum regions adjacent to the emission line. We regard this method as more reliable than fitting Gaussians given the low spectral resolution of the data; similar results are obtained for the Gaussian method, however (Manoj et al. 2016 submitted).
We show the rotation diagrams for the 5 sources with robust CO detections in multiple
lines in Figure 17. All sources show the characteristic warm component (∼300 K) of the
CO rotation diagrams (e.g. van Kempen et al. 2010; Karska et al. 2013) and only HOPS 373
shows evidence of another temperature component in CO lines with Ju ≥25; all other PBRS
have non-detections for CO lines with Ju ≥25. Thus, we fit a linear slope to the rotation
diagrams for all detected CO lines with Ju ≤25, finding Trot between 216 K and 282 K.
HOPS 373 has the highest Trot and 119019 has the lowest Trot.
We plot the PACS CO luminosities (L(CO)) versus Lboland Tbol in Figure 18. The PBRS
have CO luminosities that are consistent with the observations from the HOPS, WISH, WILL
and DIGIT2 samples (Karska et al. 2013; Manoj et al. 2013; Green et al. 2013; Karska et al.
2014, Mottram et al. submitted; Karska et al. in prep.)3. However, HOPS 373 has nearly the
highest CO line luminosity for all protostars in the samples considered here for protostars
with Lbol <30 L. Looking at L(CO) vs. Tbol, also in Figure 18, the PBRS are comparable
to other sources with low values of Tbol.
The comparison of CO Trot to the HOPS/WISH/WILL/DIGIT samples is shown in
Figure 19; these rotation temperatures are all measured using CO lines with 14 ≤ Ju ≤25.
2WISH stands for Water In Star forming regions withHerschel, WILL stands for WIlliam Herschel Line
Legacy, and DIGIT stands for Dust, Ice, and Gas, In Time. WISH and DIGIT wereHerschelkey programmes and WILL was an Open Time 2 programme.
3 The PACS CO data to be published in Karska et al. is a synthesis and updated analysis of the WISH,
The PBRS have Trot values that are among the lowest observed for all protostars in the
other sample at any luminosity. However, given the uncertainties in our own measurements
and those in the literature, the PBRS are consistent with the observed distribution of Trot,
but on the low-side of the distribution. We discuss the possible causes for the PBRS have
lower Trot values further in Section 4.4.
3.3.3. Far Infrared Line Ratios
We calculated diagnostic line ratios that have been used by Karska et al. (2014) to compare the WISH and WILL observations with various shock models (Kaufman & Neufeld
1996; Flower & Pineau Des Forˆets 2010; Flower & Pineau des Forˆets 2015) and list them
in Table 7 for the sources with detected lines. For most ratios, the values calculated for the PBRS are either within the range observed in the WISH/WILL samples (Karska et al.
2014) or the values are within 1σ of the observed range. The primary line ratio that is
systematically different from the WISH/WILL samples is the CO (J = 16 → 15)/CO
(J = 21→20); the ratios are systematically larger for all the PBRS. This likely reflects the
colder CO Trot values that are derived for the PBRS, relative to the WISH/WILL sources.
We also list ratios for CO (J = 17 → 16)/CO (J = 22 → 21), CO (J = 16 → 15)/CO
(J = 17→16), and CO (J = 21→20)/CO (J = 22→21) because CO (J = 17 →16) and
CO (J = 22 →21) are also accessible from SOFIA4.
One source, HOPS 373, also had detections of OH transitions, enabling further
compari-son to the WISH/WILL results. Note that one of the OH 84µm doublet lines is contaminated
by CO (J = 31→ 30) and to correct for this we measured the flux of the uncontaminated
doublet line and multiplied its flux by two. The ratio of OH 84µm to OH 79µm is larger than
WISH/WILL, but within the uncertainties, H2O (404-313) to OH 84 µm is consistent with
WISH/WILL, and CO (J = 16→15) to OH 84µm is slightly in excess of the WISH/WILL
results. Thus, for HOPS 373, the H2O line emission relative to OH is weaker than predicted
by the shock models, consistent with the suggested interpretation of Karska et al. (2014)
that UV irradiation of the shocks is needed in order to explain the H2O and OH line ratios
as suggested by Karska et al. (2014).
4. Discussion
The PBRS have been demonstrated, through multiple lines of evidence, to be consistent
with being the youngest known Class 0 protostars. Their SEDs indicate that they are
surrounded by very dense envelopes (ST13) and this was further confirmed by the CARMA 2.9 mm dust continuum luminosities (Paper I). If these sources truly are a sample of the youngest protostars, the results from the outflow diagnostics presented here can offer valuable clues to the properties of outflows toward very young protostars. Given the multitude of the data presented, including the continuum results from Paper I, we have compiled a list of PBRS properties determined from the follow-up observational data and present a summary of these data in Table 5.
4.1. Nature of the PBRS Very Red Colors
A principal uncertainty in the characterization of the PBRS was if the extremely red
24µm to 70 µm colors observed by ST13 were strongly influenced by source viewing angle.
If the PBRS were typical Class 0 sources and observed in exactly edge-on orientation, then
the combined opacity of the envelope and disk midplane could result in the very red 24 µm
to 70 µm colors. However, ST13 showed that even if the PBRS were all viewed edge-on,
the envelope densities would still have to be>2×higher than typically found toward HOPS
protostars; the median envelope density for Class 0 protostars in HOPS at a radius of 1000
AU is found to be 5.9 × 10⁻¹⁸ g cm−3 from SED modeling (Furlan et al. 2016).
For the sources with detected CO (J = 1 → 0) outflows, the clear spatial separation
of the blue and redshifted CO emission clearly shows that 093005, 090003, 082012, HOPS
372, HOPS 373, 135003, 019004 are not observed with edge-on orientation and must be
observed at an intermediate viewing angle (neither edge-on nor face-on). The distribution of inclinations is consistent with being random; therefore, the extremely red colors of these protostars are not the result of extreme edge-on viewing angle, but are due to the high density of the infalling envelope itself. We are unable to make a definitive conclusion about 061012 since the outflow is not clearly detected, but there appear to be separated blue and red lobes.
However, for two sources, 119019 and 302002, only low-velocity CO emission is found for those outflows. The outflow toward 302002 (Figure 9) had a small velocity gradient from
across the source, and we mentioned in Section 3.1.3 that the inclination is likely between 50◦
and 80◦, but closer to 80◦. In the more extreme case of 119019, this PBRS had no detectable
velocities (Figure 4. Thus, these two sources may only have been classified as PBRS because their of edge-on (or nearly edge-on) orientation.
In summary, we confirm that the extremely red colors of the PBRS are not the result
of inclination for 7 out of 9 sources with detected CO (J = 1 → 0) outflows. The sources
without detections of CO (J = 1 → 0) outflows may have low-velocity outflows that are
confused with the cloud emission, or the outflows are still too small in spatial extent and are not bright enough to detect with the sensitivity of our current observations.
4.2. Outflow Properties
The outflows exhibit a range of masses, momenta, energies, and forces; HOPS 373 has outflow properties typical of those in Plunkett et al. (2013) and 082012 has outflow properties in excess (Table 4). In contrast, the two most compact outflows in the sample (090003 and 093005) have quite low outflow masses, momenta, energies, and forces. Since the Plunkett et al. (2013) sample includes single-dish data to measure the total flux, a comparison with Arce & Sargent (2006), using interferometer-only data, is more appropriate. The ranges for the observed outflow parameters from Arce & Sargent (2006) and Plunkett et al. (2013)
are given in Table 4. We note, however, that neither of those studies computed FCO. The
sources 093005, 090003, and 302002 have values all less than the range from Arce & Sargent (2006), HOPS 223 is within the range, and HOPS 373 and 082012 have values in excess of these numbers.
The outflow toward 082012 is truly exceptional, its high-velocity nature was first re-ported by Sandell et al. (1999); it is more energetic and has more momentum than the strongest outflows in the Plunkett et al. (2013) sample. The increased collimation and large velocity extent bears resemblance to NGC 1333 IRAS 4A, L1448C (Hirano et al. 2010), and IRAS 04166+2706 (Santiago-Garc´ıa et al. 2009). This outflow has energies and momenta in excess of all the outflows observed by Arce & Sargent (2006) and Plunkett et al. (2013), but it is comparable to L1448C (Hirano et al. 2010). The outflow of 082012 is likely even more powerful than we measure it to be, given that our properties are lower-limits due to lack
of 13CO observations to determine the optical depth and because we do not cover the full
extent of the outflow. The outflow of 082012 is also likely blended with that of HOPS 372 at low velocities, but at higher velocities it appears to only come from 082012. Even if we are measuring the combined outflow properties, it is very strong relative to those observed in the nearby star forming regions.
outflows found in our data. The outflows of 093005 and 090003 are not observed to extend
further than their apparent envelope sizes observed at 870µm. This and the compact 4.5µm
emission may indicate that the outflows are just beginning to break out from their dense, natal envelopes. These outflows are not particularly powerful either, the outflow forces plotted in Figure 11 are on the low-end for Class 0 sources and 090003 is lower that the linear relationship from Bontemps et al. (1996), above which all Class 0s lie in current data (Yıldız et al. 2015, Mottram et al. submitted). Furthermore, the well-developed outflow
from 135003 is also found to lie below the Lbol vs. FCO relationship. Alternatively, the
outflows could be more powerful, but since their energies and momenta are calculated using
entrained material, observed CO (J = 1 → 0), the outflows only appear weak with these
measures.
The deeply embedded sources without 4.5 µm emission or outflow detections (097002,
091015, 091016, and 082005) may have outflows that are too weak/faint to detect in our observations. However, the lack of outflow detections toward these most embedded sources and the lack of particularly powerful outflows from 093005 and 090003, could indicate that outflows may be weak during the early Class 0 phase, given the apparent youth of the sources and small spatial extent of the outflows. Thus, it possible that the outflow momen-tum/energy/force may be initially small early-on and are rising early in the Class 0 phase such that the Class 0 outflows will be systematically more powerful than Class I outflows (e.g., Bontemps et al. 1996; Yıldız et al. 2015). Weak initial outflows from protostars are pre-dicted from simulations of the FHSC phase (Tomida et al. 2013; Price et al. 2012) where the
outflows are <15 km s−1. If the PBRS have recently transitioned out of the FHSC phase,
then they may not have reached their full outflow power as of yet. This will be further studied using single-dish data by Menenchella et al. (in prep.).
The absence of detected outflow activity in CO (J = 1 → 0) toward the four sources
mentioned above cannot be construed as evidence of outflow absence because of our finite resolution and sensitivity. For example, the outflow toward OMC MMS6N (also known as HOPS 87) was only detected when it was observed at the highest resolutions with the SMA (Takahashi et al. 2012), due to its very small spatial extent. Thus, the non-detected outflows could be very compact and in the process of breaking out from the envelopes, necessitating higher resolution data. On the other hand, OMC MMS6N did have strong
H2O and CO emission lines observed in the far-infrared spectrum from Herschel (Manoj
et al. 2013) and 091015/091016 had no detected emission lines in their PACS spectra. In
contrast, 091015/091016 are low-luminosity sources (L=0.65 L and 0.81 L) and OMC
MMS6N is a higher-luminosity source (L >30 L), making direct comparisons between the
4.3. Relationship of Outflows and 2.9 mm Continuum Properties
In Paper I, the 2.9 mm continuum luminosities and visibility amplitude profiles were
an-alyzed. We found that most PBRS had 2.9 mm continuum luminosities (median of 1.0×10⁻⁵
L) and L2.9mm/Lbol ratios (median of 8.8×10⁻⁶) greater than most nearby Class 0
proto-stars, which have a median L2.9mm = 3.2×10⁻⁶ L and a median L2.9mm/Lbol = 8.5×10⁻⁷.
The nearby Class 0 continuum samples are drawn from Tobin et al. (2011), Looney et al.
(2000), and Arce & Sargent (2006), which are sensitive to comparable spatial scales; L2.9mm
is calculated assuming a 4 GHz bandwidth centered at 2.9 mm. The PBRS have a median
L2.9mm that is 3×larger that typical Class 0s and L2.9mm/Lbol that is 10×larger. This means
that the more nearby Class 0 protostars with high L2.9mm also have a high Lbol, whereas the
PBRS tend to have lower Lbol. Furthermore, the highest L2.9mm for nearby Class 0 protostars
is 2.9×10⁻⁵ Ltoward NGC 1333 IRAS 4A, in contrast to the highest L2.9mm of 3.4×10⁻⁵L
for the PBRS 082012; see Figure 2 from Paper I. Finally, 6 out of 14 PBRS (093005, 090003,
091016, 091015, 097002, and 082005) had flat visibility amplitude profiles (and small 5 kλto
30 kλ visibility amplitude ratios), consistent with most emission being emitted from scales
< 2000 AU (Figures 3 and 4 from Paper I). Thus, the PBRS tend to have more massive
envelopes relative to their bolometric luminosities as compared to other Class 0 sources and the flat visibility amplitude ratios indicate high densities in the inner envelopes (Paper I).
Here we more closely examine the two PBRS have apparent inclination angles that are
close to edge-on: 119019, being almost exactly edge-on, and 302002 being near 80◦(between
50◦to 80◦). The PBRS 119019 has L2.9mm/Lbol (1.47×10⁻⁶) and L2.9mm (2.3×10⁻⁶ L) values
consistent with typical Class 0 protostars from the literature. Thus, in addition to having an nearly edge-on outflow, the 2.9 mm continuum emission from 119019 is not consistent with it having a massive, dense envelope like the rest of the PBRS (Table 5). This points to 119019 perhaps being more evolved than the rest of the PBRS and its very red colors can be
attributed to an edge-on inclination. On the other hand, 302002 has values of L2.9mm/Lbol
(1.2×10⁻⁵) and L2.9mm (1.0×10⁻⁵ L) consistent with rest of the PBRS. Both of these sources
also have declining visibility amplitudes (Paper I).
We also find a tendency for the PBRS with flat visibility amplitudes to show either a
compact outflow or have no detectable outflow in the CO (J = 1 → 0) line and Spitzer
4.5 µm emission. We suggested in Paper I that the PBRS with flat visibility amplitudes
amplitudes may indeed be the initial stages of the Class 0 protostellar phase.
The change in visibility amplitude profile could be related to the outflows carving out cavities and lowering the overall mass of the inner envelope. On the other hand, if the inner envelope mass is rapidly accreted onto the protostar, then the visibility amplitude profiles
would also dramatically decline. Using the example from Paper I, the free-fall time of 2M
confined to a constant density sphere with R = 1500 AU is only the∼10,000 yr, quite short
on the timescale of protostellar collapse. For the case of inside-out collapse (Shu 1977), the
rarefaction wave would take∼36,000 yr to propagate out 1500 AU (assuming a sound speed
of 0.2 km s−1), the boundary of the rarefaction wave is where the density profile changes
from r−2 to r−1.5, reflecting free-fall collapse. Moreover, in the case of strong rotation, a
portion of the density profile inside of the rarefaction wave can have a density profile of r−0.5
(Cassen & Moosman 1981; Terebey et al. 1984). Thus, in either case, the density structure of the inner envelopes can be significantly altered on a timescale shorter than the Class 0
phase (∼150,000 yr, Dunham et al. 2014). Thus, the outflow detection and extents may
simply correlate with the decrease in the visibility amplitude profiles and not cause it.
Lastly, the only flat visibility amplitude source with detected far-infrared line emission is 093005; only continuum emission was detected toward 091015 and 091016. The remaining sources with line emission had declining or uncertain visibility amplitude profiles.
4.4. Far-Infrared Diagnostics in the Context of the PBRS
A key finding of our study is that in the absence of other outflow indicators (CO (J =
1 → 0), Spitzer 4.5 µm scattered light/H2), the PACS line emission (CO, H2O, or [OI])
does not independently show evidence for outflows in the form of shocks from the inner envelopes of the protostars. Thus, we only find far-infrared line emission toward sources
that have detected CO (J = 1 → 0) outflows. This hints at a strong link between the
mechanisms that produce the cold CO outflows and the warm/hot component observed in
the far-infrared. Furthermore, the [OI] 63µm transition is only convincingly detected toward
1 PBRS (HOPS 373) out of the 6 PBRS for which we could reliably subtract the background [OI] emission from the edge spaxels. We do not consider the detections and non-detections of 135003 and 019004 meaningful because of the strong, extended, and spatially variable [OI] emission in the OMC2/3 region. HOPS 373 has one of the more well-developed outflows, has
an H2O maser (Haschick et al. 1983), and has the brightest line spectrum of all the PBRS.
Hollenbach & McKee (1989) predict strong far-infrared CO and [OI] 63 µm emission
[OI] luminosity detected toward HOPS 373 is comparable to other protostars with similar luminosity (Green et al. 2013). While the tentative detections and non-detections toward the remaining PBRS do not point to anomalously weak [OI], we can confirm that the PBRS do not have exceptionally strong [OI] emission. Thus, we conclude that the outflows from the PBRS that give rise to the [OI] and high-J CO luminosities appear comparable in those tracers of other Class 0 protostars.
If PBRS are typical of the youngest protostars, early Class 0 protostars, then we posit that outflows may be very weak initially. At a minimum, the PACS [OI] and CO
observa-tions, in addition to CO (J = 1→0), demonstrate that the PBRS are not accompanied by
significantly stronger outflows than typical Class 0 protostars. While the PBRS are inconsis-tent with the expected properties of first hydrostatic cores (FHSC) due to their luminosities
and colors (ST13), the outflows predicted from FHSCs are quite weak <15 km s−1 (Tomida
et al. 2013; Price et al. 2012). The outflows are expected to increase in velocity as the source evolves, though the simulations did not follow the longer term evolution. Such slow outflows from the PBRS would be consistent with them having recently transitioned out of a FHSC phase. If the outflow power is directly linked to the mass accretion rate, then the time in
which protostars have very low outflow power is likely quite short < 10000 yr, consistent
with the apparent youth of the PBRS.
Alternatively, at 63 µm the opacity from the infalling envelopes may be obscuring the
[OI] emission. Following Kenyon et al. (1993), the optical depth through an envelope with a
density profile consistent with free-fall (r−1.5) density profile (Ulrich 1976) is given by
τλ = κλ
˙
M
2π(2GM∗)1/2
r−1/2 (1)
where κλ is the wavelength dependent dust opacity, G is the gravitational constant, M˙
is the mass infall rate, M∗ is the protostar mass, and r is the inner radius for which the
optical depth is being calculated. M∗ is taken to be 0.5 M, which is adopted to set the
envelope density for a given infall rate; the absolute value for the mass is not important, only the envelope density. Under the assumption of free-fall collapse, the infall rate is directly proportional to the envelope density
ρ1000 = 2.378×10⁻¹⁸
˙
Menv
10−5M
yr−1
!
M∗
0.5M
g cm−3 (2)
which is the volume density at a radius of 1000 AU, following the notation of Furlan et al. (2016). From spectral energy distribution model fitting to the Orion protostars (Furlan et al.
2016), the Class 0 protostars in Orion had medianρ1000 of 5.9×10⁻¹⁸ g cm−3 with upper and
modeled by Furlan et al. (2016) to have a median ρ1000 of 1.8×10⁻¹⁷ g cm−3, and the SED
fits tend to prefer densities of 3× to 10×higher than the typical and lowest density Class 0
protostars, respectively.
This difference in density translates to significantly more opacity at 63 µm for the
PBRS, a factor of 4× to 13× higher than the median Class 0 density and lower quartile;
this results in a transmission of only 0.09 for a typical PBRS, versus 0.55 and 0.84 for the Class 0 median and lower Class 0 quartile, respectively. High opacity may be a particularly
important consideration for 093005 which has a clear outflow in CO (J = 1 → 0), PACS
CO, and H2O emission but without [OI] emission.
The high envelope opacities can also influence the CO rotation temperatures because the increasing optical depth at shorter wavelengths would cause the rotation temperatures to decrease due to flux attenuation of the line emission. To characterize the magnitude of this effect, we examined the difference in transmission for the PACS CO lines down to a radius of 1000 AU (where much of the PACS CO emission appears to be emitted, Green et al. 2013;
Manoj et al. 2013). For typical Class 0 envelope densities (ρ1000 = 5.9×10⁻¹⁸ g cm−3), the
typical density of the PBRS envelopesρ1000= 1.8×10⁻¹⁷g cm−3, and assuming dust opacities
from Ossenkopf & Henning (1994, Table 1, column 5), we found that the 3×higher envelope
density could decrease the CO rotation temperatures by ∼20 K. Thus, the CO rotation
temperatures of 220 K - 230 K would be higher if corrected for optical depth, making them even more consistent with the WISH/WILL/DIGIT/HOPS samples
5. Summary and Conclusions
We have presented an observational study of both the cold and warm/hot molecular gas in outflows from the youngest known protostars in the Orion molecular clouds, the PACS Bright Red Sources (PBRS). The cold gas was probed toward 14 out of 19 PBRS
using observations of the CO (J = 1 → 0) transition from CARMA, and the warm/hot
gas was examined for 8 out of the 19 PBRS using full spectral scans (55 µm to 200 µm)
from the Herschel PACS far-infrared spectrometer. Finally, we also examined Spitzer 4.5
µm imaging to look for evidence of both compact and extended outflow activity from both
scattered light and shocked H2 emission. The results from the follow-up work done in this
study and Paper I demonstrate the critical need for complementary data in the determining the nature of protostellar sources that are otherwise only characterized by their SEDs. Our main conclusions are as follows.
HOPS 373, 082012, and 019003) in the CO (J = 1 → 0) molecular transition. There is tentative evidence for outflows toward an additional three PBRS (HOPS 372, 302002, and 061012). We also detect outflows from two non-PBRS HOPS 223, a FU Ori-like outbursting protostar (Fischer et al. 2012) and HOPS 68 (Poteet et al. 2011); the HOPS 68 outflow also appears to be quadrupolar. No detectable outflow activity is found toward the PBRS
097002, 082005, 091015, and 091016 in CO (J = 1 → 0), 4.5 µm emission, or far-infrared
spectroscopy (only 091015 and 091016).
2. The outflows toward 090003 and 093005 are the most compact, subtending less than
2000 (8400 AU) in total extent, having dynamical ages ≤2,500 yr. These outflows are also
found to have momenta, energies, and forces that are at the low end for Class 0 protostars. This observation, in addition to the lack of detectable outflows toward several other PBRS, leads us to suggest that outflows may start out weak in protostellar sources and become more energetic with time. These sources are also the only ones with flat visibility amplitudes to have detected outflows and we find a tentative tendency for the sources with flat visibility amplitudes in the 2.9 mm continuum (see Paper I) to either have no detected outflow activity or the most spatially compact outflows. This is further evidence for the sources with flat visibility amplitude being among the youngest protostars and the youngest PBRS.
3. The outflow from 082012 is extremely powerful, with red-shifted emission detected
out to +40 km s−1 from line center and extent greater than the CARMA primary beam.
Its total energy is in excess of any individual outflow in the NGC 1333 star forming region (Plunkett et al. 2013) and comparable to some of the most powerful known outflows from Class 0 protostars (e.g., Hirano et al. 2010, L1448C).
4. We detect far-infrared CO emission lines toward 6 out of the 8 PBRS observed.
H2O lines are detected toward 5 out of 8 PBRS, and OH and [OI] are detected toward 1
PBRS. The far-infrared CO, H2O, and [OI] lines do not reveal outflows in the absence of
outflow detections from other diagnostics. The CO luminosities and [OI] detections/upper limits are consistent with the results from larger samples of Class 0 protostars. However, the CO rotation temperatures tend to be lower than the typically observed 300 K CO rotation temperature for protostars; however, given the uncertainties the PBRS are consistent with the larger samples. Nevertheless, with a simple calculation of envelope opacity to a radius of
1000 AU, we find that the observed rotation temperatures of the PBRS could appear∼20 K
lower due to envelope opacity, given that the PBRS seem to have denser envelopes than typical Class 0 protostars.
is currently supported by grant 639.041.439 from the Netherlands Organisation for Scien-tific Research (NWO). J.J.T acknowledges past support provided by NASA through Hubble Fellowship grant #HST-HF-51300.01-A awarded by the Space Telescope Science Institute, which is operated by the Association of Universities for Research in Astronomy, Inc., for NASA, under contract NAS 5-26555. The work of A.M.S. was supported by the Deutsche Forschungsgemeinschaft priority program 1573 (’Physics of the Interstellar Medium’). AK acknowledges support from the Foundation for Polish Science (FNP) and the Polish Na-tional Science Center grant 2013/11/N/ST9/00400. This work is based in part on observa-tions made with Herschel, a European Space Agency Cornerstone Mission with significant participation by NASA. Support for this work was provided by NASA through an award issued by JPL/Caltech. We are very grateful to have had the opportunity to conduct these follow-up observations with the CARMA array in California. The discontinuation of support for this productive facility is a loss that will continue to be felt into the future. Support for CARMA construction was derived from the states of Illinois, California, and Maryland, the James S. McDonnell Foundation, the Gordon and Betty Moore Foundation, the Kenneth T. and Eileen L. Norris Foundation, the University of Chicago, the Associates of the California Institute of Technology, and the National Science Foundation. Ongoing CARMA develop-ment and operations are supported by the National Science Foundation under a cooperative agreement, and by the CARMA partner universities.
Facilities: CARMA, Herschel, Spitzer, Magellan
A. Individual Sources
A.1. HOPS 373
HOPS 373 is the close neighbor of 093005, located 11000 to the south. The dust
contin-uum emission observed in D-configuration only showed some asymmetry and the combined
D and C configuration data resolved a second component, separated by 400 (Paper I). An
outflow was previously detected in CO (J = 3 → 2) observations with the JCMT (Gibb &
Little 2000) and an associated water maser by Haschick et al. (1983). Our observations of
CO (J = 1 →0) in Figure 6 show that the outflow has quite a wide angle and is extended
beyond the primary beam. We also tentatively detected an outflow originating from the secondary source that has blue and red-shifted lobes opposite of the main outflow. The wide separation of the blue and red-shifted lobes indicates that the source is viewed at an
inclination angle between 50◦ and 80◦. There is higher-velocity redshifted emission observed
The far-infrared line emission from this source is quite intense, detecting [OI], OH, CO,
and H2O. The line emission from this source is the third brightest of all HOPS protostars
and the only PBRS in our sample with confidently detected [OI] and OH emission.
A.2. 093005
The reddest PBRS, 093005, is located at the intersection of three filaments and ∼11000
north of HOPS 373 (ST13). At wavelengths shorter than 70µm, 093005 was only detected in
Spitzer 3.6 µm and 4.5µm imaging (Figure 12a). The 4.5µm emission could be indicative of
shocked H2 emission and/or scattered light in an outflow cavity. Thus, a detection at 4.5µm
is indicative of possible outflow activity toward this source. We clearly detect the CO outflow originating from 093005, as shown in Figure 1. The outflow appears compact with an offset
between the red and blueshifted lobes of only ∼300. The position-velocity diagram of the
outflow simply shows high-velocity emission offset from the protostar position, not the typical increasing velocity with distance as typical for many protostellar outflows (Arce et al. 2007). The features could result from a compact bow shock component as the outflow begins to
break out from its envelope. However, the resolution of our observations was only∼300 (1200
AU), making clear determinations as to the nature of the high-velocity features difficult. The relative velocities of the red and blue-shifted lobes and their close spatial location indicate
that the source is not oriented edge-on and is at an inclination angle of ∼30◦. Compact
bow-shocks viewed at an intermediate inclination could show observed morphology (Arce
et al. 2007). Far-infrared CO and H2O line emission is also clearly detected toward this
source.
A.3. 090003
The PBRS 090003 (also called Orion B9 SMM 3; Miettinen et al. 2012) is located in a loose filamentary complex north of NGC 2024 with several protostars and starless cores over a 0.5 pc region (Miettinen et al. 2012). Much like 093005, the only detection shortward of 24
µm for this source is at 4.5µm, where there is a small feature offset from the location of the
protostar. This may be indicative of a knot of shocked H2 emission (Miettinen et al. 2012;
Stutz et al. 2013). The CO (J = 1→0) outflow from this source appears similar to that of
093005 and is indicative of∼30◦ inclination, as shown in Figure 2; however, in contrast, there
is a more spatially extended, low-velocity component. The high-velocities near the source and low velocities extended away from the source could be indicative of a wide-angle wind
12CO emission from the cloud, so we are able to see lower-velocity features than in 093005.
Miettinen et al. (2012) observed 13CO (J = 2 →1) with APEX (∼ 3000 resolution) and did
not detect any indication of outflow emission from 090003, suggesting that the outflow is quite compact.
A.4. 082012 and HOPS 372
The outflow from 082012 is the brightest and one of the two most spatially extended outflows in the sample. Moreover, the outflow is visible over the largest velocity range (aside from HOPS 68) as shown by the 3 panels integrated at low, moderate, and high velocities
in Figure 3. Sandell et al. (1999) previously reported single-dish CO (J = 3 → 2) and
continuum maps at 450 µm and 850 µmtoward this region. They resolved the dust emission
around both protostars, and found a high-velocity outflow, consistent with our data, but
mapped over a larger region, ±15000 from the source.
The clear separation of the blue and redshifted lobes indicates an intermediate orienta-tion of the source(s). The driving source of the collimated, high-velocity emission seems to be 082012; however, at lower velocities the red-shifted lobe extends back to HOPS 372 and there is blue-shifted emission that appears associated with HOPS 372 as well. Thus, the two outflows are nearly parallel and are perhaps interacting, but at a minimum their emission is clearly overlapping at lower velocities.
The highest observed outflow velocities toward 082012 are in excess of ±40 km s−1 with
multiple components being evident in the PV diagram and we can see the characteristic ‘Hubble-flow’ in the PV diagram. Furthermore, there are also red and blue-shifted CO emission clumps nearly orthogonal to the main outflow of 082012 which could be yet another
outflow in the region. Furthermore, there are extended H2 knots along the position angle of
the outflow from 082012 as shown in Figure 12a.
A.5. 135003