AbstractA group decision support system is required on a value-based decision because there are different concern caused by differing preferences, experiences, and background. It is to enable each decision-maker to evaluate and rank the solution alternatives before engaging into negotiation with other decision-makers. Stakeholder of multi-criteria decision making problems usually evaluates the alternative solution from different perspective, making it possible to have a dominant solution among the alternatives. Each stakeholder needs to identify the goals that can be optimized and those that can be compromised in order to reach an agreement with other stakeholders. This paper presents group decision model involving three decision-makers on the selection of suitable system for a building’s roof. The objective of the research is to find an agreement options model and coalition algorithms for multi person decision with two main preferences of value which are function and cost. The methodology combines value analysis method using Function Analysis System Technique (FAST); Life Cycle Cost analysis, group decision analysis method based on Analytical Hierarchy Process (AHP) in a satisfying options, and Game theory-based agent system to develop agreement option and coalition formation for the support system. The support system bridges theoretical gap between automated design in construction domain and automated negotiation in information technology domain by providing a structured methodology which can lead to systematic support system and automated negotiation. It will contribute to value management body of knowledge as an advanced method for creativity and analysis phase, since the practice of this knowledge is teamwork based. In the case of roof system selection, it reveals the start of the first negotiation round. Some of the solutions are not an option because no individual stakeholder or coalition of stakeholders desires to select it. The result indicates the alternative solution that will be the best-fit solution. In this problem, a space frame system is the ‘best-fit’ solution for the roof system.
Keywordssupport system, value-based, group decision and negotiation, roof system
AbstrakSistem pendukung keputusan kelompok sangat diperlukan dalam proses pengambilan keputusan berbasis nilai, sebagaimana karakteristik keilmuan Manajemen Nilai yang didasarkan pada kelompok kerja multi disiplin. Karenanya ada perbedaan pertimbangan bagi setiap pengambil keputusan sebagai akibat dari perbedaan preferensi, pengalaman, dan latar belakang. Pada sistem tersebut sangat dimungkinkan setiap pengambil keputusan untuk mengevaluasi solusi alternatif sebelum terlibat dalam negosiasi dengan pengambil keputusan yang lain. Evaluasi alternatif pada pengambilan keputusan dengan multi-kriteria biasanya dari perspektif yang berbeda, tanpa adanya solusi yang dominan diantara pengambil keputusan. Sehubungan kepentingan untuk mendapatkan persetujuan dari pengambil keputusan yang lain, setiap pengambil keputusan perlu untuk mengidentifikasi tujuan yang akan dioptimalkan dan yang dapat dikompromikan. Paper ini menyajikan model pengambilan keputusan bersama sebagai sistem pendukung dengan tiga pengambil keputusan pada proses pemilihan sistem atap bangunan. Tujuan dari penelitian ini untuk mendapatkan model pilihan persetujuan dan algoritma koalisi dengan dua kriteria yaitu kriteria fungsi dan kriteria biaya. Metode yang digunakan mengkombinasikan metode analisa nilai, analisa pengambilan keputusan kelompok, dan teori permainan berbasis sistem agen. Metode pertama menggunakan analisa biaya siklus hidup dan analisa fungsi, metode kedua menerapkan Proses Hirarki Analitik, dan metode ketiga digunakan untuk mengembangkan opsi persetujuan algoritma koalisi untuk membangun sistem pendukung keputusan. Sistem yang diusulkan akan menjembatani perbedaan antara teori otomatisasi desain di dalam domain konstruksi dan otomatisasi negosiasi di keilmuan teknologi informasi, melalui penyajian metode yang terstruktur menuju penyusunan pendukung sistem dan otomatisasi negosiasi. Sistem yang dibangun akan memberi kontribusi pada lingkup keilmuan manajemen nilai sebagai metode mutakhir pada tahap kreativitas dan tahap analisis karena dasar keilmuan ini berbasis pada kerja kelompok. Pada kasus pemilihan sistem atap, pada tahap awal negosiasi, ditemukan ada beberapa alternatif yang bukan merupakan alternatif solusi karena tidak ada satu pengambil keputusanpun atau koalisi diantara mereka yang menginginkan alternatif tersebut. Hasil yang ada mengindikasikan solusi alternatif yang menjadi solusi terbaik bagi seluruh pengambil keputusan. Pada kasus di penelitian ini, konstruksi rangka ruang adalah solusi terbaik untuk sistem atap bangunan.
Kata Kuncisistem pendukung, keputusan berbasis nilai, keputusan kelompok dan negosiasi, sistem atap
2
I.INTRODUCTION
his paper provides an approach and develops a framework for multi person decision in a building system decision in a case of roof system selection. As a process involving multi disciplines and teamwork, a group decision becomes an important role in an element or a building system selection such as roof system. The framework is facilitated by the implementation of coalition formation and it will help to reduce cost and to improve value of building system decision in
Christiono Utomo is with2 Department of Civil Engineering, FTSP,
Institut Teknologi Sepuluh Nopember, Surabaya, 60111, Indonesia. E-mail: [email protected].
construction projects. Many researchers suggested applying Game Theory in multi person decision support [1]. However, the support model with value criteria has not been developed. The characteristic of value criteria cannot be applied to previous research. Existing models that are commonly accepted are optimization-based models, for example aggregation methods, but these are not able to solve the problem of value criteria [2]. This research applies the satisfying game method where function and cost of solution techniques as value criteria can be formulated on coalition algorithms [3].
The roof is one of the most important systems in a building. No one roofing system meets every buildings needs, which is why there are so many varieties from which to choose as the correct one for their building [4].
Support System Model for Value based Group
Decision on Roof System Selection
Christiono Utomo1
Emerging roof technologies complicate product selection. These products may provide performance improvements and cost-saving benefits initially as well as during the life of the roof. Smith argues that knowing what technologies to consider and what roofing applica-tions are best-suited for particular buildings makes selection a complex matter [5]. Identifying the right sys-tem is important for either roofing a new building or re-roofing an existing structure [6]. In new design, the roof system selection can be part of the building design, for example, the building can be strengthened to support a heavy roof system.
The selection process in this case is difficult because of the large number of factors, many of which are unrelated or in conflict with one another, and the lack of key data (such as realistic design service life). The weight of roof system selection criteria depend on the perspective of the individual decision-makers [7], for example the architect might be more interested in the image of the building function that will be influenced by the roof system, whereas the project manager or facility manager would be more interested in domain issues related to the owner and constraints such as budget that reflected on initial cost. This makes it difficult for the decision-makers to agree on the evaluation criteria.
With a general understanding of the available system options, consideration of the following technical and non-technical criteria can lead to the selection of the most appropriate system and details for a project. The criteria and alternatives of the roof system selection in this paper are determined from Focus Group research on the group decision maker in a private developer company in Indonesia. There are three decision makers involved which are Architect as Stakeholder 1 (SH1), Facility Manager as Stakeholder 2 (SH2) and Project Manager as Stakeholder 3 (SH3). These criteria include initial cost, maintenance cost, replacement cost, support system, usability period, functional performance, reliability, and image. The first three criteria pertain to cost whereas the other five are relevant to function. It is critical that the selected system sufficiently satisfies all of the criteria.
There are five possible technical solutions for the roof system of the building to be selected and evaluated on eight criteria, by three decision-makers. The alternatives of technical solution are:
1. Steel structure: steel structure system is one of the basic methods used in the construction of building roofs,
2. Pre-cast system: apart from cast in situ concrete structures, building roofs can also be assembled from pre-cast members,
3. Timber system: traditionally timber framework is also used for roof systems,
4. Cast in situ reinforced concrete and
5. Space frame: a space frame or space structure is a truss-like, lightweight rigid structure constructed from interlocking struts in a geometric pattern. Space frames usually utilize a multidirectional span, and are often used to accomplish long spans with few supports. Space frames are an increasingly common architectural technique especially for large roof spans in modernist commercial and industrial buildings [8].
A. Value-based Decision
Value-based decision is an effort of Value Management (VM) process [9]. It improves the value of a facility through identifying opportunities to remove unnecessary costs [10]. VM is a structured and analytical process that seeks to achieve value by identifying all necessary functions at the lowest cost, while maintaining with the required levels of quality and performance [11]. It also means that VM identifies and eliminates unnecessary cost based on function analysis [12]. Unnecessary cost is the nature of design process. VM has been widely adopted in many countries over several decades as a very effective tool to meet the increasing demands for value enhancement by clients [13].
The value based approach as new approach and methodology that involves using a multidisciplinary team including representatives of the owner, user, facility manager, and constructor [9]. The value analysis is an integrated full team approach [10, 14]. In the natural characteristic of construction, it means that a tool for decision team is necessary. Cooperation is the nature in team work on VM workshop [11]. That decision analysis techniques can then applied to determine the relative value of the alternative solutions for performing function [15]. Weighting and scoring technique are relevant in value analyses exercise where a decision needs to be made in selecting an option [16]. A paired comparison is held to determine the weighing to be given to each attribute [17]. Many studies in value-based decision apply multi criteria decision making, such as in assessment of exterior building wall, in material design of concrete and in a modification of value engineering in petrochemical industry [18-20].
B. Cooperative Group Decision
Cooperative Game Theory concepts suited to decentralize multi task environment in a group decision [21]. Cooperative games are often defined in terms of a characteristic function which specifies the outcomes that each coalition can achieve for itself [22]. For some decision, outcomes are specified in terms of the total utility that a coalition can divide (transferable utility). For other decision, utility is nontransferable that the achievement of the coalition cannot be characterized by a single number [21]. A cooperative decision consists of two elements that are first a set of player N = {1,2,…, n}. Members of N run from 1 to n. The second is a characteristic function specifying the value created by different subsets of the decision makers. The characteristic function is a function denoted v that associates with every subset S of N, denoted v(S). In a cooperative game, it is a pair (N,v), where N is a finite set and v is a function that maps subsets of N to members.
C. Coalition and Characteristic Function
subsetCN, or numbered collection of players in which there are n>1 players numbered 1, 2, ..., n and set of all the players N = {1,2,…n}. Coalition is formed by making binding agreements in order to benefit every member of the coalition so that all members might receive more than they could individually on their own.
Since there are n
2possible subsets of N, there are n
2
possible coalitions. If N= {1, 2} or coalitions with two members, the possible coalition are n
2 = {0, 1, 2, 12}. In
every coalition there is empty coalition that is a coalition made up of no members (the null set
) and a grand coalition N consisting of all the decision makers [27]. The benefit of a coalition can be quantified by characteristic function. The characteristic function of a coalition CN is the largest guaranteed payoff to the coalition. A coalition structure is a means of describing how the players divide themselves into mutually exclusive coalitions. It can be described by a set
S S Sm
S 1, 2,..., of the m coalition that is formed.
A multi person decision and negotiation has coalition formation algorithms. The algorithms can also be classified into static and dynamic algorithms [28-29]. The general goal for coalition formation is to maximize utility, but the actual reasons for forming coalitions are normally different for different decision makers, and different decisions [22, 29]. There are three varieties of coalition formation models: the utility-based models [23, 28], knowledge-based model [30-31] and combination based on both models by [26, 29]. Based on the characteristic function game this coalition formation includes three activities which are: generating coalition structure, solving the optimization problem in each coalition, and dividing payoff or the value of generated solution among agents in a fair and stable way so that agents are motivated to stay within the coalition structure rather than moving out [32]. Several ways of dividing payoffs have been proposed in many literatures [33]
.
II.METHOD
The methodology for value-based group decision combines value-based processes, multi-criteria decision-making process, and negotiation base coalition process [34]. Figure 1 represents these processes. It consists of three stages base on the process. The first two stages are referred to [35] and the last stage is based on coalition formation on Game Theory [1, 23].
The selection of roof system in this paper undergoes the following steps:
Stage 1: Determining the function and cost of each technical solution for roof system,
Stage 2: Each decision maker sets the weight of each criterion (win condition). Using Analytical Hierarchy Process (AHP) [36], every decision maker evaluates and ranks the support bridge options based on his/her win conditions and, Stage 3: Identifying agreement options that reflect the
combined preferences of all decision makers by coalition. Finally, determining the ‘best fit’ options for each coalition on first negotiation round.
III.RESULTS AND DISCUSSION
A. Stage One: Value-based Process
Value-based process is the first stage on developing of agreement option and coalition model in this paper [37]. The process of value-based consists of two main stages which are function analysis and LCC analysis.
1. Function Analysis of Roof System
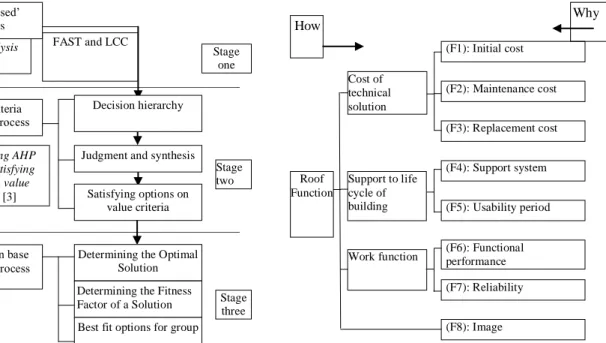
Function analysis of the roof system is presented in Figure2. It is developed by team work based on the Function Analysis System Technique (FAST) method [12]. There are three basic functions, namely cost of technical solution, building life cycle support and work function. These are further divided into eight sub-functions that will be used as the criteria to select roof system (F1-F8). Later, the functions are called c1, c2, c3, f1, f2, f3, f4, and f5 respectively and refer to the satisfying model of value (function/cost).
2. Life Cycle Cost of Roof System Alternatives
Three cost drivers of the building system which are initial cost, maintenance cost and replacement cost were calculated. There is no salvage value on engineering economics practice in Indonesia. Table 1 presents the result of Life Cycle Cost (LCC) analysis and the pro-portion for each category of initial cost (including invest-ment cost), operation and maintenance (O&M) cost and replacement cost. O&M cost is calculated on a yearly basis. Replacement cost and has variability are calculated over the period of time.
B. Stage Two: Multi-Criteria Decision Process
The Process consists of three steps namely constructing decision hierarchy, making judgments and judgment synthesis, and satisfying of technical solutions on value criteria. The two first steps follow evaluation process on Analytical Hierarchy Process (AHP) [36]. The last step is the evaluation model proposed for this paper. Result on this process is the ‘best option’ of technical solution for roof system based on individual decision maker. The process to determine the ‘best option’ for group is dis-cussed in next stage.
1. First Step: Constructing Decision Hierarchy
To obtain a good representation of a problem, it has to be structured into different components called activities. Figure 3 shows three levels of decision hierarchy. The goal of the problem (G =Select the best value of technical solution for roof system for an office building) is addressed by some alternatives (A = a1; a2; a3; a4; a5) which are steel structure, pre-cast system, timber system, reinforced concrete and space frame respectively. The sub-problems namely cost (LCC) and functions are split into eight evaluation criteria that will be used to select the best roof system solution. The evaluations criteria are c1, c2, c3, f1, f2, f3, f4, and f5 or initial cost, maintenance cost, replacement cost, support system, usability period, functional performance, reliability, and image respectively. Then, implementation of AHP (Analytical Hierarchy Process) can be started with compilation of the hierarchy model.
(5), very strong, demonstrated (7) or extreme (9) [36]. Sometimes one needs to compromise judgments (2; 4; 6; 8) or reciprocal values (1/9; 1/8; 1/7; 1/6; 1/5; 1/4; 1/3; 1/2). If there are n items that need to be compared in a given matrix, a total of n(n-1)/2 judgments are needed [36]. For each set of factors, a matrix A of pair-wise comparison can be derived. There are two judgments involved in this decision-the first is criteria judgment for each decision-maker and the second, technical solution judgment for each criterion.
(1) Criteria judgments for each decision-maker
Based on AHP process, the weighting factor of each criterion for each decision-maker is calculated. A set of tables (Table 2, 3, and 4) show the result of pair-wise comparisons of decision- makers. For example in this paper, data and analysis of the Architect is presented.
Table 2 shows the preferences of the Architect in a form of pair-wise comparisons. Table 3 presents the weighting factor of each criterion based on the Architect’s preferences. From this table it can be concluded that the highest ranking of the criteria for Architect is image, and the lowest is initial cost. Table IIc shows the calculation of preference consistency on input judgment. The CR (Consistency Ratio) is 0.08. It is lower than 0.1, which suggests that the pair-wise input can be accepted [36]. The calculation and the relationship between CR, Consistency Index (CI), and largest eigenvalue (λ) are presented in Table 4.
Using the same procedure presented in Table 2, 3, and 4, the weighting factor of each criterion for the Facility Manager and Project Manager (PM) Client can be obtained. Table 5 and Figure 4 presents the result of criteria judgment for all decision-makers.
The weight of each evaluation criteria for each decision-maker is different. The difference presents rationality among decision-maker. The results indicate that the architect and PM Client contrast in preferences. The architect argues that image is the most important criterion in roof system selection, whereas PM client puts initial cost as the highest priority on the decision of the roof system.
(2) Technical solution judgment for each criterion The procedure and calculation for technical solution judgment is similar with criteria judgment. The goal of this process is to get the weighting factor of each technical solution option for each criterion. Table 6, 7, and 8 shows the judgment input, normalization and consistency respectively for criteria initial cost (c1).
The results of the technical solution judgments for all criteria are presented in Figure 5. For example, it can be seen that for the criterion of initial cost (c1), option RC (a4) is the cheapest as compared to space frame (a5), which is the most expensive. Another example is the criteria of image (f5), where space frame (a5) is the highest priority. Steel (a1) is the best for the criteria of functional performance (f3) and reliability (f4).
The goal of judgment synthesis is to get the ranking of the technical solution option for each decision maker. The procedure is presented in Table 9.
3. Third Step: Satisfying Option on Value Criteria Stirling [3] has written and demonstrated satisfying games on multi-criteria decision-making. He writes that ‘A natural procedure of satisfying options is to separate the attributes into two categories, one to involve the
attribute that represents functions of an option and the other to involve attributes that represents losses’. Categorization of this problem is helpful in identifying initial, maintenance and replacement costs as ‘Cost’ and all five function of roof system as ‘Function’. To compare function and cost representing the value of a technical solution, they must be represented on the same scale. This may be done by creating select ability (Ps) and reject ability (Pr) functions [3] and normalizing the problem so that the decision-maker has a unit of function utility and a unit of cost utility to apportion among the options. The two last columns on Table 10 show the utility of cost and function for each option of technical solution.
Based on the results presented in Table 10, Figure 5 provides a cross plot of function and cost, with Pr (reject ability) the abscissa and Ps (select ability) the ordinate. The caution index, v, is taken as unity where the technical solution will be “select” or “reject” if the value (F/C) is >1 or <1 respectively. Observe that although a4 has the lowest cost, it also has low function, and a rational decision-maker can legitimately conclude that this is satisfying, since the function at least outweighs the costs. Options a3 and a2 is easily eliminated by the cost-function test. Options a4 here give the highest satisfying conclusion since it has high function to cost ratio as defined by [11].
Both the facility manager and project manager are likely to take into consideration the costs in their selections. While initial cost is a factor in their decision-making process, it is not the only factor. On the other hand, the architect considers function in their selection
.
Figure 7, 8, and 9 provide a cross plot of function and cost of each decision-maker.
Observe that the preference value of the decision-makers will impact on the value of the technical solution. The example given here is a5 that has a value greater than F/C=1 (to select) on the basic value (Figure 5), but will decrease to less than F/C=1 (to reject) on PM Client’s preference (Figure 8). This also happens with a2, in which the architect (Figure 6) gives it a value greater than F/C=1 (to select), but the Facility Manager (Figure 7) and Project Manager (Figure 8) decide to reject.
C. Stage Three: Negotiation base Coalition Process
In this multi person decision with three stakeholder (Architect, Facility Manager and Project Manager) there were 8 possible (23) coalitions, including empty coalition and five singleton coalitions. Agreement options are determined by conducting five stages, which are;
1. Determining the weighting factor of criteria for each decision-maker and the aggregation,
2. Grading of alternative for each evaluation criteria, 3. Scoring of each alternative for every decision-maker, 4. Determining the optimal solution (payoff optimum)
and
5. Determining the fitness factor of an alternative solution
1. Determining the Optimal Solution (Payoff Optimum) The determination of the optimal solution for each decision-maker in a coalition is based on a cooperative multi-person games with complete information in which coalition-formation among sub-group members are allowed [22, 38, 39]. In the context of Game Theory, they [38-40] presented a proof that the formation of coalitions among decision-maker provides a means for achieving Pareto optimality. Coalition formation leads to an objective function for each decision maker in coalition Rj, where fi(x) is the payoff of decision-maker i
and gRj(x) is the payoff of coalition Rj, for i Rj. The
variable x in the function of the payoff of decision-makers stands for the criteria to be evaluated for the alternative solutions. Therefore, decision-maker i Rj
maximizes gRj(x) instead of fi(x) [26]. For every coalition
structure, decision-maker payoffs are determined by assuming that a rational stakeholder i Rj chooses an
alternative for the group.
Bialas [38] and Wanyama [26] showed that for any imputation
1,2,....,N
, where i the payoff ofdecision-maker i is, therefore i satisfies the following
Equations:
Pw
i P
i
and
iNi UG(1)
A linear programming formula is used to determine the Pareto optimal payoff for each decision-maker in each coalition. A linear programming on Game Theory is used to determine the payoff players in a coalition [26, 41]. Objective function of the linear programming is min β, where β is a measure of deficit that a coalition may suffer during the distribution of resource (UG) with
pre-emptive priority, which are total payoff of coalition (P1) and function of goal constraint every scenario (P2). The value of P2 comes from mathematical model of styles and outcomes correlation [7]. There are five constraints. The first constraint ensures that the total earning of decision-makers is equal to the available resources. The second constraint ensures that no decision-maker earns less than what it can obtain when acting alone. Wanyama [26] clearly argued that the reason being that if the decision-maker receives an amount i < Smin(i), it simply
reject the solution and at worst, earn Smin(i). The third
constraint minimizes the deficit of any coalition. The fourth constraint is number of coalition member, and the last constraint ensures that summation of functional scenario higher than dysfunctional scenario on the mathematical model of negotiation styles and outcomes correlation [37].
Based on the linear programming equation, two kinds of Pareto Optimum payoff can be determined. They represent the value criteria namely COST payoff optimum and function payoff optimum. The process to determine payoff optimum for ‘Cost’ and ‘Function’ is presented on Table 11 and 12, respectively.
The payoff optimum refers to each decision maker in each coalition. The value of (max-min) payoff for a decision maker is used to determine the payoff optimum by applying the coordinating scenario. This means that no one stakeholder has higher importance than others. This scenario can be changed depending on the situation of a project.
2. Determining the Fitness Factor of an Alternative Solution
The linear programming formulation yields a Pareto optimal solution with imputation = (1, 2,...,N) [42,
43]. Therefore, there are two parameters to determine the best option, which are the negative value and positive value. Wanyama [29] determined these values by comparing decision-maker’s payoffs with Pareto optimum. Adapted from [26, 42-44], Figure 10 is the process of fitness factor. The process is applied to both value criteria namely function and cost. There are two categorize of best options which are best for function and best for cost. Based on the two categorize, a best option for all stakeholder can be determined by value equation which is Function/Cost. For both value criteria, the best selectable option is the one with the least negative value. However, if two alternatives have the same negative value, then the one with higher positive value of is better. The rationale is come from [26, 29] that if the negative value is close to zero, then most decision-makers earn a payoff close to their Pareto optimum. A high negative value means that some decision-makers earn higher than their Pareto optimum. Sets of activities could move, expand and retract during negotiation [1]. When a decision maker takes a new alternative, it is purposed to all users. When a new criterion is taken by a decision-maker, this criterion is proposed to the corresponding group.
The coalition formation model worked in the context of multi-criteria group decision-making. Firstly, indivi-dually all decision-makers have their own best solution. Finally, as shown on Table 13, space frame (a5) is found to be the ‘best fit’ solution for all decision-makers after coalition. As the ‘best fit’ solution, a1 is contrary to the best option selected by the project manager and facility manager, who chose a5. On the process of trade off, the project manager and facility manager can propose a new preference if he or she did not accept a5 as the best option.
IV.CONCLUSION
Firstly, this section presents an overall conclusion of the research. This is followed by a brief description on the limitation of the support system model developed in this research and a brief account of future work in the areas of multi-criteria multi-person decision making and its automated system in the domain of value-based decision, operation research, and agent-based negotiation and technology.
A. General Conclusion
can be compromised in order to reach an agreement with other stakeholders.
A ‘Value’ in Function/Cost is the basis for the metho-dology presented on this paper. On the value-based process, function and life cycle cost are analyzed. On multi-criteria decision-making, a satisfying option is used by correlating the function and cost to get the value of a technical solution option. On multi person decision process, the payoff optimum and best fit options are based on the criterion of value, which are function and cost. In this proposed model, a multi person decision consists of exchange of proposals between decision-makers. When decision-maker i proposes its alternative to decision-maker j, this alternative should be the most preferred alternative for decision-maker j (with the highest priorities with respect to the goal) to accept it immediately. If not, decision maker j tries to change the alternatives order of preference by adjusting judgments in pair-wise comparison matrices. If the proposal is not accepted, it will send a counter-proposal. Sets of acti-vities could move, expand and retract during group decision process.
B. Recommendation for Future Research
The research was deliberately limited towards addressing the ‘value’ in the component of value for money. There are many issues relating to the difficulties of cost modeling which have not been addressed. The adopted research strategy is also open to criticism on the basis that it focused only on roof system selection. It is also important to point out that there are significant differences between the subjective interpretation of the researcher and an inter-subjective interpretation amongst the decision makers. Once the paradigm of positivist research is rejected, there is no longer any objective reality against which to measure validity.
This paper has developed the theoretical and philosophical basis of negotiation support. There is considerable amount of work which remains to be done within the wider domains of building economics, construction management, operation research and agent-based negotiation and technology. There is need for further research into the possible application of other methodologies of group decision support and negotiation support. In the domain of operation research, there are a lot of opportunities for mathematical proof research for optimization and satisfying decision in cooperative and incomplete information environments. A mathematical proof research for an unlimited multi-person decision maker in a project involving a whole community will be an interesting research.
Future research in the field of agent-based negotiation and management will have a huge benefit from the development of a user-friendly software which uses a GUI (graphical user interface), but it will surely consume a lot of time and money for research. In future, the combination of many technologies such as Virtual Reality (VR) will help human and its agent to communicate, discuss and make decision for any type or stages of building system design with two main important preferences that are function and cost. As to further illustrate, a final building design decision can be made by an agent from all the project participants in a virtual reality environment simultaneously while being in a different geographical area.
The recommended future works associated with the research reported in this paper are as follows:
1. To integrate the support for elicitation process with technical solution selection. It needs to develop ontology of functional concept of building system product alternatives. At present, such ontology is not available. The work to develop ontology of functional concept has been started by [45] but until now researches in this area are still in its very preliminary stage.
2. To extend the framework of technical solution to address the issue of selecting multiple building (roof) system products alternatives to perform the function. It will be run concurrently between satisfying games method to reduce the number of technical solution and optimization games method to select the best fit for the technical solutions. Research and practice in the objectives area of decision making science to reduce alternatives are still in the qualitative stages, such as advantage and disadvantages analysis, and benchmark analysis.
3. To continue developing, modifying and testing the agent negotiation protocol of the support system and reasoning mechanism. Time constraint will be important criteria to be considered.
4. To continue working on multi-attribute decision making, specifically on the process of eliciting user preference models such as neural network application and value function, and on establishing expert quantitative data from qualitative description of the feature of the alternative solution. It will need the development of trade off algorithms to analyze value of technical solution (roof system) in real time. 5. To develop knowledge management properties on the
model to store the selection data and information in various types of repositories such as system selection repository, user repository, discussion repository, lessons learn repository, and historical information repository.
REFERENCES
[1] T. Wanyama, and B.H. Far, ”A Protocol for multi-agent negotiation in a group-choice decision-making”, Journal of Network and Computer Applications,Vol. 30, pp. 1173-1195, 2007.
[2] J. Vaníček, I. Vrana, and S. Aly, ”Fuzzy aggregation and averaging for group decision making: a generalization and survey”, Knowledge-Based System, Vol. 22(1), pp. 79-84, 2009. [3] W.C. Stirling, “Satisfying Games and Decision Making with
Applications to Engineering and Computer Science”, Cambridge: Cambridge University Press, 2003.
[4] A. Spala, H.S. Bagiorgas, M.N. Assimakopoulos, J. Kalavrouziotis, D. Matthopoulos, and G. Mihalakakou, “On the green roof system, selection, state of the art and energy potential investigation of a system installed in an office building in Athens, Greece”, Journal Renewable Energy, Vol. 33(1), pp. 173-177, 2008.
[5] T. Smith, “Building envelope design guide-roofing systems”,
2009. Retrived from
http://www.wbdg.org/design/env-roofing.php.
[6] J.W. Rossiter and E. Kane, “W83-roofing materials and systems CIB coordinators trend reports and anthology of future perspective”, CIB Publication, Vol. 211, 1997.
Information Technology (IACSIT) and IEEE Society, Singapore, January 22-24, pp. 365-369, 2009.
[8] Centre for Engineering Structures & Material, “What is space structure?”, 2008. Retrived from http://www.surrey. ac.uk/eng/research.
[9] S.J. Kirk, R.G. Turk, and R.W. Hobbs, “Value Based Team Design Decision Making”, USA: The American Institute of Architects, 2007.
[10] J. Kelly, S. Male, and D. Graham, “Value Management of Construction Project”. UK: Blackwell Science, 2004.
[11] J.J. Kaufman, “Value Management: Creating Competitive Advantage”, Financial World Publishing, Canterbury: Kent, 2001.
[12] C.W. Bytheway, “FAST Creativity and Innovation: Rapidly Improving Processes, Product Development and Solving Complex Problems”, Florida: J. Ross Publishing, 2007.
[13] Q. Shen, and G. Liu, “Applications of value management in the construction industry in China”, Journal Engineering, Construction and Architectural Management, Vol.11 (1), pp.485–491, 2004.
[14] G. Thomas and M. Thomas, “Constructing Partnering and Integrated Team Working”, UK: Blackwell Publishing, 2005. [15] R.T. Clemen, “Making Hard Decisions”, 2nd edition. Belmont:
Duxbury Press, 1996.
[16] M. Sanchez, F. Prats, N. Agell, and G.Ormazabal, “Multiple-criteria evaluation for value management in civil engineering”, Journal of Management in Engineering, Vol. 21(3), pp.131-137, 2005.
[17] S. Fan, Q. Shen, and G. Lin, “Comparative study of idea generation between traditional VM workshop and GDSS-supported workshop”, Journal of Construction Engineering and Management Vol. 133(10), pp. 816-825, 2007.
[18] A. Al-Hammad and M.A. Hassanain,”VE in the assessment of exterior building wall system”, Journal of Architectural Engineering, Vol.2 (3), pp.115-119, 1996.
[19] M. Qingan, M. Qing, and Y. Hong, “Value analysis application in material design of concrete”, Proceeding of SAVE International Conference, 1999.
[20] J.M. Fisher, “The modification of value engineering for application in the petrochemical industry”, Master Thesis, University of Calgary, Alberta, 1999.
[21] M. Klusch and O. Shehory, ”Coalition formation among rational information agents”, MAAMAW, LNAI 1038, Springer Verlag, 1996, pp.204-217.
[22] A. Kelly, “Decision making using game theory: An introduction for managers”, Cambridge University Press: Cambridge, UK, 2003.
[23] S. Kraus, “Strategic Negotiation in Multi-agent Environments”. MA: The MIT Press, 2001.
[24] J. Contreras, “A cooperative game theory approach to transmission planning in power system”. Ph.D. Dissertation, University of California Berkeley, 1997.
[25] N.E. Zarour and S. Bouzidi, “Coalition formation for cooperative information agent-based system”, International Journal of Computers, Communications & Control, Vol. 1 (3), pp. 85-92, 2006.
[26] T. Wanyama, “Decision support for COTS selection”, Ph.D. Dissertation, University of Calgary, 2006.
[27] L.K. Soh and C. Tsatsouls, “Satisfying coalition formation among agents”, AAMAS 02, Bologna Italia, 2002.
[28] M. Klusch and A. Gerber, “Dynamic Coalition Formation”, London: Lawrence Erlbaum Associates, 2002.
[29] T. Wanyama, “Static and dynamic coalition formation in group-choice decision making”, in MDAI 2007, LNAI 4617, V. Torra, Y. Narukawa, and Y. Oshida (Eds.). Berlin Heidelberg: Springer-Verlag, 45–56, 2007.
[30] R.T. Maheswaran and T. Basar,”Coalition formation in proportionally fair division auctions”, The Autonomous Agents and Multi Agent System (AAMAS) Conference, Melbourne Australia. July, 2003.
[31] S. Abdallah and V. Lesser, “Organization-based coalition formation”, The Third International Joint Conference on Autonomous Agents and Multi agent Systems Volume 3. NY, July 19 - 23, pp.1294-1295, 2004.
[32] T.W. Sandholm and V.R. Lesser, ”Coalitions among
computationally bounded agents”, Jounal Artificial Intelligence, Vol.94 (1), pp. 99-137, 1997.
[33] J.P. Kahan, and A. Rapoport,”Theories of Coalition Formation”, Lawrence Erlbaum Associates Publishers, 1984.
[34] C. Utomo, A. Idrus, M. Napiah, and M.F. Khamidi, “Agreement options and coalition formation on value-based decision”, Symposium on Computational Intelligence in Multi criteria Decision-Making. IEEE Society Nashville, TN, March 30 – April 2,pp.118-125, 2009.
[35] ASTM “ASTM Standards on Building Economics, 5th edition”,
ASTM International, 2004
[36] C. Utomo, ”Development of a negotiation support model for value management in construction”, Ph.D Dissertation. Universiti Teknologi PETRONAS: Malaysia, 2009.
[37] T.L. Saaty, ”Decision Making – the analytical hierarchy process and network process (AHP/ANP)”, Journal of System Science and System Engineering, Vol. 13(1), pp.1-34, 2004.
[38] W.F. Bialas, “Cooperative n person stackelberg games”, Proceeding of the 28th IEEE Conference on Decision and Control,
May, 1998.
[39] R.J. Aumann, and M. Maschler, “The bargaining set for cooperative games”, in Classics in Game Theory, Harold W Kuhn (Editor), New Jersey: Princeton University Press, 1997, pp.140-169.
[40] P. Caillou, S. Aknine and S. Pinson, “Searching pareto optimal solutions for the problem of forming and restructuring coalitions in multi agent system”, Group Decision and Negotiation,Vol. 18(6), 2009.
[41] E.N. Barron, “Game theory an introduction”. Hoboken, NJ: Wiley-Inter Science- John Wiley and Sons., 2008.
[42] E.A. Thompson, “A pareto optimal group decision process”, Public Choice, Vol. 1., 1966.
[43] W.E. Schmitendorf and G. Moriarty,”A sufficiency condition for coalitive pareto-optimal solutions”, Journal of Optimization Theory and Applications, Vol. 18(1), pp.93-98, 1976.
[44] K. Westwood and V. Allan, “Who works together in agent coalition formation?”, in: CIA 2007, LNAI 4676, M. Klusch et al. (Eds.), Berlin Heidelberg: Springer-Verlag, 2007, pp.241–254. [45] Y. Kitamura, and R. Mizoguchi, “An ontology of functional
Figure 1. The methodology for automated negotiation on value-based decision
Figure 2. FAST of the roof system
Figure 3. Decision hierarchies for roof system selection
Figure 4. Weighting factors of each criterion for each decision maker on roof system selection 0.00
0.05 0.10 0.15 0.20 0.25 0.30 0.35 0.40 0.45 0.50
c1 c2 c3 f1 f2 f3 f4 f5
Criteria
W
e
ig
h
ti
n
g
f
a
c
to
r
Architect Facility Manager Project Manager Roof
Function Cost of technical solution
Support to life cycle of building
Work function
(F2): Maintenance cost
(F3): Replacement cost (F1): Initial cost
(F4): Support system
(F5): Usability period
(F6): Functional performance
(F7): Reliability
(F8): Image
How
Why
FAST and LCC
MCDM using AHP
[35] and satisfying options on value
criteria [3]
Value analysis V=F/C
‘Value-based’ Process
Decision hierarchy
Judgment and synthesis
Satisfying options on value criteria ‘Multi-Criteria
Decision’ Process
‘Negotiation base
Coalition’ process Determining the Optimal Solution
Determining the Fitness Factor of a Solution
Solution
Best fit options for group Stageone
Stage two
Stage three
Level 1
Decision goal
Level 2
Criteria
Level 3
Options Select the best value of technical solution for roof system on an office
building (G)
Functional performance
(f3) Usability
period (f2) Support
system (f1) Replacement
(c3) Maintenance
(c2) Initial
(c1)
Space frame (a5) Reinforced
concrete (a4) Timber system
(a3) Pre-cast system
(a2) Steel structure
(a1)
Image
(f5) Reliability
(f4)
Cost (LCC) (c)
Figure 5. Weighting factor for each roof system option to each criteria
Figure 6. Cross-plot of basic value of roof system solutions Figure7. Cross-plot of Architect’s value of roof system solutions
Figure 8. Cross-plot of Facility Manager’s value of roof system solutions
Figure 9. Cross-plot of PM Client’s value of roof system solutions
Figure 10. Process of fitness factor (Adapted from [26, 42-44]) 0.00 0.10 0.20 0.30 0.40 0.50 0.60
c1 c2 c3 f 1 f 2 f 3 f 4 f 5
Criteria We ig h ti n g f a ct o r
a1 (steel) a2 (precast) a3 (timber) a4 (RC) a5 (Space f rame)
Basic Value of Technical Solution
a1 (steel) a2 (precast) a3 (timber) a4 (RC) a5 (space frame) Value=F/C=1 0 0.05 0.1 0.15 0.2 0.25 0.3 0.35
0 0.1 0.2 0.3 0.4
Cost (Pr) F u n c tio n ( P s )
Value of SH1 (Architect) Preference
a1 (steel) a2 (precast) a3 (timber) a4 (RC) a5 (Space frame) Value=F/C=1 0 0.05 0.1 0.15 0.2 0.25 0.3 0.35
0 0.1 0.2 0.3 0.4
Cost (Pr) F u n c tio n ( P s )
Value of SH2 (Facility Manager) Preference
a1 (steel) a2 (precast) a3 (timber) a4 (RC) a5 (Space frame) Value=F/C=1 0 0.05 0.1 0.15 0.2 0.25 0.3 0.35
0 0.1 0.2 0.3 0.4
Cost (Pr) F u n c tio n ( P s )
Value of SH 3 (Project Manager) Preference
a1 (steel) a2 (precast) a3 (timber) a4 (RC) a5 (space frame) Value=F/C=1 0 0.05 0.1 0.15 0.2 0.25 0.3 0.35
0 0.1 0.2 0.3 0.4
Cost (Pr) F u n c tio n ( P s ) i iaj
ij
0
2 1 2
N ij Q i j i 2 1 2
N ij Q i j i and
j jj j
G
,
Fitness factor: Payoff for stakeholder i for each alternative
Q+ for Xij ≥ 0
Q- for X
TABLE 1. LCC OF ROOF SYSTEM Cost
category
Present Worth (1000USD)
a1 a2 a3 a4 a5
Initial 2600 1800 2500 3300 1500
Maintenance 235 625 120 760 370
Replacement 1115 3200 1600 4000 2100
Total Cost 3950 5625 4220 8060 3970
TABLE 2.
PAIR-WISE COMPARISON OF ARCHITECT: JUDGMENT INPUT
Criteria c1 c2 c3 f1 f2 f3 f4 f5
(c1) initial cost 1 0.33 0.33 0.33 0.2 0.2 0.2 0.11
(c2) maintenance cost 3 1 2 0.33 0.2 0.2 0.25 0.2
(c3) replacement cost 3 0.5 1 0.33 0.33 0.33 0.25 0.2
(f1) support system 3 3 3 1 0.33 0.33 0.33 0.25
(f2) usability period 5 5 3 3 1 0.5 4 0.5
(f3) functional performance 5 5 3 3 2 1 5 0.5
(f4) reliability 5 4 4 3 0.25 0.2 1 0.33
(f5) image 9 5 5 4 2 2 3 1
∑ 34 23.83 21.33 15 6.32 4.77 14.03 3.09
TABLE 3.
PAIR-WISE COMPARISON OF ARCHITECT: NORMALIZATION
Criteria c1 c2 c3 f1 f2 f3 f4 f5 ∑ weight
(c1) initial cost 0.03 0.01 0.02 0.02 0.03 0.04 0.01 0.04 0.21 0.03
(c2) maintenance cost 0.09 0.04 0.09 0.02 0.03 0.04 0.02 0.06 0.40 0.05
(c3) replacement cost 0.09 0.02 0.05 0.02 0.05 0.07 0.02 0.06 0.38 0.05
(f1) support system 0.09 0.13 0.14 0.07 0.05 0.07 0.02 0.08 0.65 0.08
(f2) usability period 0.15 0.21 0.14 0.20 0.16 0.10 0.29 0.16 1.41 0.18
(f3) functional performance 0.15 0.21 0.14 0.20 0.32 0.21 0.36 0.16 1.74 0.22
(f4) reliability 0.15 0.17 0.19 0.20 0.04 0.04 0.07 0.11 0.96 0.12
(f5) image 0.26 0.21 0.23 0.27 0.32 0.42 0.21 0.32 2.25 0.28
TABLE 4.
PAIR-WISE COMPARISON OF ARCHITECT: CONSISTENCY
Criteria c1 c2 c3 f1 f2 f3 f4 f5 ∑
(c1) initial cost 0.03 0.02 0.02 0.03 0.04 0.04 0.02 0.03 0.22 8.56
(c2) maintenance cost 0.08 0.05 0.10 0.03 0.04 0.04 0.03 0.06 0.42 8.26
(c3) replacement cost 0.08 0.03 0.05 0.03 0.06 0.07 0.03 0.06 0.39 8.23
(f1) support system 0.08 0.15 0.14 0.08 0.06 0.07 0.04 0.07 0.69 8.56
(f2) usability period 0.13 0.25 0.14 0.24 0.18 0.11 0.48 0.14 1.67 9.51
(f3) functional performance 0.13 0.25 0.14 0.24 0.35 0.22 0.60 0.14 2.08 9.55
(f4) reliability 0.13 0.20 0.19 0.24 0.04 0.04 0.12 0.09 1.07 8.85
(f5) image 0.23 0.25 0.24 0.32 0.35 0.44 0.36 0.28 2.48 8.81
∑ 70.33
CR 0.08 CI 0.11 λ 8.79
TABLE 5.
WEIGHTING FACTOR OF EACH CRITERION FOR EACH DECISION MAKER
Stakeholders Cost Function
c1 c2 c3 f1 f2 f3 f4 f5
Architect and Design Team
(λ=8.79, CI=0.11, CR=0.08) 0.0256 0.0503 0.0479 0.0811 0.1205 0.2177 0.1204 0.2811
Facility Manager
(λ=8.65, CI=0.09, CR=0.06) 0.0236 0.2189 0.2338 0.2010 0.1205 0.0989 0.0544 0.0489
Project Manager (PM) Client
(λ=8.74, CI=0.11, CR=0.07) 0.4338 0.0815 0.0702 0.1225 0.0797 0.1539 0.0323 0.0261
TABLE 6.
PAIR-WISE COMPARISON FOR TECHNICAL SOLUTIONS: JUDGEMENT INPUT
(c1) initial cost a1 a2 a3 a4 a5
a1 (steel) 1 3 1 0.333333 5
a2 (pre-cast) 0.333333 1 0.333333 0.166667 2
a3 (timber) 1 3 1 0.333333 5
a4 (RC) 3 6 3 1 7
a5 (Space frame) 0.2 0.5 0.2 0.142857 1
TABLE 7.
PAIR-WISE COMPARISON FOR TECHNICAL SOLUTIONS: NORMALIZATION
(c1) initial cost a1 a2 a3 a4 a5 ∑ weight
a1 (steel) 0.1807 0.2222 0.1807 0.1687 0.2500 1.0023 0.2005
a2 (pre-cast) 0.0602 0.0741 0.0602 0.0843 0.1000 0.3789 0.0758
a3 (timber) 0.1807 0.2222 0.1807 0.1687 0.2500 1.0023 0.2005
a4 (RC) 0.5422 0.4444 0.5422 0.5060 0.3500 2.3848 0.4770
a5 (Space frame) 0.0361 0.0370 0.0361 0.0723 0.0500 0.2316 0.0463
TABLE 8.
PAIR-WISE COMPARISON FOR TECHNICAL SOLUTIONS: CONSISTENCY
(c1) initial cost a1 a2 a3 a4 a5 ∑
a1 (steel) 0.2005 0.2273 0.2005 0.1590 0.2316 1.0189 5.0825
a2 (pre-cast) 0.0668 0.0758 0.0668 0.0795 0.0926 0.3816 5.0352
a3 (timber) 0.2005 0.2273 0.2005 0.1590 0.2316 1.0189 5.0825
a4 (RC) 0.6014 0.4547 0.6014 0.4770 0.3243 2.4587 5.1549
a5 (Space frame) 0.0401 0.0379 0.0401 0.0681 0.0463 0.2325 5.0199
25.3750
CR = 0.0167 CI= 0.0188 λ =5.0750
TABLE 9.
JUDGMENT SYNTHESIS AND RANKING OF ROOF SYSTEM SOLUTIONS FOR EACH DECISION MAKER
Architect
Weighting factor each option to each criteria for Architect
c1 c2 c3 f1 f2 f3 f4 f5
Weight Rank
(0.026) (0.050) (0.048) (0.081) (0.176) (0.218) (0.120) (0.281)
a1 (steel) 0.005 0.004 0.003 0.021 0.036 0.089 0.044 0.038 0.240 2nd
a2 (pre-cast) 0.002 0.014 0.014 0.005 0.042 0.026 0.028 0.064 0.196 4th
a3 (timber) 0.005 0.003 0.005 0.011 0.012 0.034 0.018 0.022 0.110 5th
a4 (RC) 0.012 0.024 0.019 0.003 0.066 0.016 0.017 0.049 0.206 3rd
a5 (Space frame) 0.001 0.006 0.007 0.041 0.019 0.052 0.013 0.108 0.248 1st
Facility Manager
Weighting factor each option to each criteria for Facility Manager
c1 c2 c3 f1 f2 f3 f4 f5
Weight Rank
(0.024) (0.219) (0.234) (0.201) (0.121) (0.099) (0.054) (0.049)
a1 (steel) 0.005 0.017 0.015 0.053 0.025 0.041 0.020 0.007 0.180 4th
a2 (pre-cast) 0.002 0.061 0.067 0.012 0.029 0.012 0.013 0.011 0.207 3rd
a3 (timber) 0.005 0.011 0.025 0.027 0.008 0.016 0.008 0.004 0.103 5th
a4 (RC) 0.011 0.104 0.092 0.007 0.045 0.007 0.008 0.009 0.283 1st
a5 (Space frame) 0.001 0.026 0.036 0.101 0.013 0.024 0.006 0.019 0.226 2nd
Project Manager Client
Weighting factor each option to each criteria for PM Client
c1 c2 c3 f1 f2 f3 f4 f5 Weight Rank
(0.434) (0.081) (0.070) (0.122) (0.080) (0.154) (0.032) (0.026)
a1 (steel) 0.087 0.006 0.004 0.032 0.016 0.063 0.012 0.004 0.224 2nd
a2 (pre-cast) 0.033 0.023 0.020 0.007 0.019 0.018 0.008 0.006 0.134 5th
a3 (timber) 0.087 0.004 0.007 0.017 0.005 0.024 0.005 0.002 0.152 4th
a4 (RC) 0.207 0.039 0.028 0.005 0.030 0.011 0.005 0.005 0.328 1st
a5 (Space frame) 0.020 0.010 0.011 0.062 0.009 0.037 0.004 0.010 0.162 3rd
TABLE 10.
BASIC VALUE OF ROOF SYSTEM OPTIONS
Cost Function Normalization
c1 c2 c3 Σ Loss f1 f2 f3 f4 f5
Cost
(Pr) Function (Ps)
a1 0.200 0.077 0.062 0.340 1.324 0.262 0.204 0.410 0.364 0.135 0.249 0.275
a2 0.076 0.278 0.286 0.641 1.023 0.060 0.241 0.120 0.233 0.229 0.192 0.177
a3 0.200 0.050 0.106 0.356 1.307 0.136 0.068 0.158 0.149 0.078 0.246 0.118
a4 0.477 0.474 0.393 1.344 0.320 0.037 0.376 0.074 0.144 0.174 0.060 0.161
TABLE 11.
COST PAYOFF OPTIMUM FOR THE OF EACH STAKEHOLDER IN EACH COALITION
Coalition Alternatives Payoff Optimum
0iSH1+2+3 a1 a2 a3 a4 a5 (max-min) Optimum
SH1 0.261 0.177 0.257 0.057 0.248 0.204 0.261
SH2 0.280 0.153 0.274 0.049 0.243 0.231 0.280
SH3 0.220 0.242 0.219 0.041 0.278 0.236 0.229
∑ 0.761 0.572 0.750 0.147 0.769
SH1+2 a1 a2 a3 a4 a5 (max-min) Optimum
SH1 0.261 0.177 0.257 0.057 0.248 0.204 0.261
SH2 0.280 0.153 0.274 0.049 0.243 0.231 0.280
∑ 0.541 0.330 0.532 0.106 0.492
SH1+3 a1 a2 a3 a4 a5 (max-min) Optimum
SH1 0.261 0.177 0.257 0.057 0.248 0.204 0.261
SH3 0.220 0.242 0.219 0.041 0.278 0.236 0.265
∑ 0.481 0.419 0.476 0.098 0.526
SH2+3 a1 a2 a3 a4 a5 (max-min) Optimum
SH2 0.280 0.153 0.274 0.049 0.243 0.231 0.280
SH3 0.220 0.242 0.219 0.041 0.278 0.236 0.241
∑ 0.500 0.395 0.493 0.090 0.521
TABLE 12.
PARETO (PAYOFF) OPTIMUM FOR THE FUNCTION OF EACH STAKEHOLDER IN EACH COALITION
Coalition Alternatives Pareto Optimum
0iSH1+2+3 a1 a2 a3 a4 a5 (max-min) Optimum
SH1 0.264 0.186 0.114 0.159 0.277 0.163 0.277
SH2 0.275 0.147 0.120 0.146 0.312 0.191 0.298
SH3 0.306 0.141 0.128 0.133 0.292 0.178 0.306
∑ 0.845 0.474 0.362 0.438 0.880
SH1+2 a1 a2 a3 a4 a5 (max-min) Optimum
SH1 0.264 0.186 0.114 0.159 0.277 0.163 0.277
SH2 0.275 0.147 0.120 0.146 0.312 0.191 0.312
∑ 0.540 0.333 0.234 0.305 0.588
SH1+3 a1 a2 a3 a4 a5 (max-min) Optimum
SH1 0.264 0.186 0.114 0.159 0.277 0.163 0.277
SH3 0.306 0.141 0.128 0.133 0.292 0.178 0.293
∑ 0.570 0.327 0.242 0.292 0.569
SH2+3 a1 a2 a3 a4 a5 (max-min) Optimum
SH2 0.275 0.147 0.120 0.146 0.312 0.191 0.298
SH3 0.306 0.141 0.128 0.133 0.292 0.178 0.306
∑ 0.581 0.288 0.248 0.279 0.603
TABLE 13.
BEST TECHNICAL SOLUTION OPTIONS (ALTERNATIVE) FOR EACH COALITION
Coalition
Technical Solution Options (Alternative)
a1 a2 a3 a4 a5
f c f C F c f c f c
Grand w- 14.75 5.20 139.02 87.91 172.80 319.91 151.34 208.12 8.08 22.46
w+ 0.00 0.00 0.00 8.08 0.00 0.00 0.00 0.00 8.08 28.29
Ranking 2nd 1st 3rd 3rd 5th 5th 4th 4th 1st 2nd
SH1+2 w- 117.03 0.00 133.24 107.67 177.55 5.10 144.01 217.92 0.00 27.50
w+ 0.00 0.00 0.00 0.00 0.00 0.00 0.00 0.00 0.00 0.00
Ranking 2nd 1st 3rd 4th 5th 2nd 4th 5th 1st 3rd
SH1+3 w- 9.19 32.53 125.27 61.58 164.00 32.65 140.58 214.23 0.71 8.49
w+ 9.19 0.00 0.00 0.00 0.00 0.00 0.00 0.00 0.00 8.49
Ranking 2nd 2nd 3rd 4th 5th 3rd 4th 5th 1st 1st
SH2+3 w- 15.56 14.85 157.63 89.80 177.50 16.12 162.84 216.06 9.90 26.16
w+ 0.00 0.00 0.00 0.71 0.00 0.00 0.00 0.00 9.90 26.16
Ranking 2nd 1st 3rd 4th 5th 2nd 4th 5th 1st 3rd
SH1 0.264 0.261 0.186 0.177 0.114 0.257 0.146 0.057 0.277 0.243
Ranking 2nd 5th 3rd 2nd 5th 4th 4th 1st 1st 3rd
SH2 0.275 0.280 0.147 0.280 0.120 0.274 0.146 0.049 0.312 0.243
Ranking 2nd 5th 3rd 4th 5th 3rd 4th 1st 1st 2nd
SH3 0.306 0.220 0.141 0.242 0.128 0.219 0.133 0.041 0.292 0.278
Ranking 1st 3rd 4th 4th 5th 2nd 3rd 1st 2nd 4th