270
ROMANIAN BALANCE FOR PEAS IN INTERNATIONAL CONTEXT
(2011-2013)
MEDELETE D.M., PÂNZARU R.L.
Faculty of Agronomy, University of Craiova
Key words: production, import, export, stocks, available total domestic, human consumption, seeds,
fodder consumption, losses, total consumption
ABSTRACT
Peas are constituted in a beneficial plant for human nutrition, fodder consumption, as a raw material used in the food industry, from agrotechnical - technological standpoint due to its morphological and physiological peculiarities.
I considered it interesting to show how to set up the total domestic availability of peas, as well as what its possibilities for use are, ranging from the varied possibilities of use, especially in terms of balancing Human consumption through the intake of protein of a vegetable nature.
For the world balance is noted its somewhat balanced character (deficit of 7.39 thousand T). In the case of the European Union, the balanced nature of the balance is highlighted, which is also true for Romania.
INTRODUCTION
The pea is grown for green beans rich in protein, carbohydrates, vitamins and mineral salts. It is consumed in fresh state, early spring and preserved, all year round. Due to its high protein content, pea grains have therapeutic properties and are recommended in the nutrition of children and people who are undergoing special physical efforts.
Pea is cultivated well in the country, the areas of Western Plain, Transylvania Plain, Mureş Valley and Târnavelor, Sibiu Depression, Bârsei Country are preferred. Green stems are a valuable feed for animal feed or can be used as a green fertilizer that enriches the soil with nitrogen.
The economic importance of the crop is due to the simple technology that can be fully mechanized, the low production costs and the low consumption of labor force.
METHOD AND MATERIAL
In order to carry out the work, a system of indicators, specific for establishing the balance of some agricultural products, was used, a system used and recommended by the United
Nations Food and Agriculture Organization - FAO.
The constitution of the total domestic availability considers the following component elements: total production, imports, stocks and exports (expressed in natural units of measurement - thousands tones or tones). Establishing the level of total domestic availability - according to FAO regulations, takes into account the sum of the production level with the level of imports, ± stocks, from which the volume of exports decreases.
To determine the total consumption, the following component elements are considered: feed consumption, seeds or planting material, food consumption, processed raw materials, other uses, losses (expressed in thousands of tones or tones). According to FAO methodology, the total consumption level is determined by summing the above-mentioned elements.
3
balance may be found between the two elements - basic - constituents.
In the case of total internal availability and total consumption, taking into account their component elements and their mode of participation in establishing the general level of the two indicators, a percentage structure was established, distinct for both the total internal availability and the total consumption.
The analysis method used was the comparison in time and space.
The Romanian realities are presented in the world context and of the European Union, for their anchorage as appropriate in the phenomena manifested internationally.
RESULTS AND DISCUSSIONS
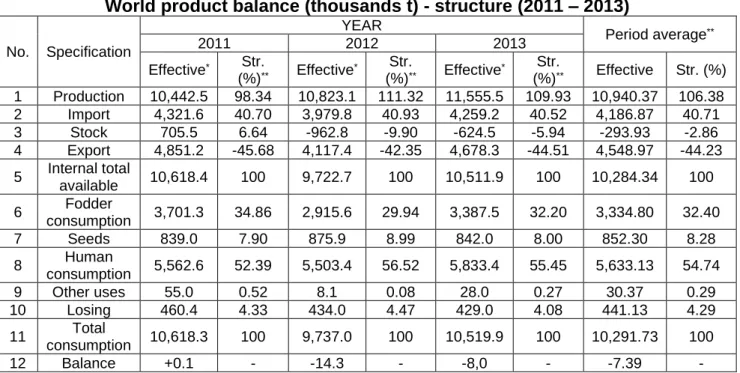
Table 1 presents the world balance for peas.
Table 1.
World product balance (thousands t) - structure (2011 – 2013)
No. Specification
YEAR
Period average**
2011 2012 2013
Effective* Str.
(%)** Effective*
Str.
(%)** Effective*
Str.
(%)** Effective Str. (%)
1 Production 10,442.5 98.34 10,823.1 111.32 11,555.5 109.93 10,940.37 106.38 2 Import 4,321.6 40.70 3,979.8 40.93 4,259.2 40.52 4,186.87 40.71 3 Stock 705.5 6.64 -962.8 -9.90 -624.5 -5.94 -293.93 -2.86 4 Export 4,851.2 -45.68 4,117.4 -42.35 4,678.3 -44.51 4,548.97 -44.23
5 Internal total
available 10,618.4 100 9,722.7 100 10,511.9 100 10,284.34 100
6 Fodder
consumption 3,701.3 34.86 2,915.6 29.94 3,387.5 32.20 3,334.80 32.40 7 Seeds 839.0 7.90 875.9 8.99 842.0 8.00 852.30 8.28
8 Human
consumption 5,562.6 52.39 5,503.4 56.52 5,833.4 55.45 5,633.13 54.74 9 Other uses 55.0 0.52 8.1 0.08 28.0 0.27 30.37 0.29 10 Losing 460.4 4.33 434.0 4.47 429.0 4.08 441.13 4.29
11 Total
consumption 10,618.3 100 9,737.0 100 10,519.9 100 10,291.73 100
12 Balance +0.1 - -14.3 - -8,0 - -7.39
-*http://www.fao.org/faostat/fr/#data/BC (28.11.2018) **my calculation
In the first instance, it should be noted that if for all the constituent elements of the total available there is statistical data, while at the level of total consumption there is no data for the processed raw materials.
In 2011, the total domestic availability was 10,618.4 thousand t, constituting as follows: 10,442.5 thousand t total production (98.34%), 4,321.6 thousand t import (40.70%), 705.5 thousand t stocks (6.64%), 4,851.2 thousand t exports (-45.68%). For the total consumption reached a level of 10,618.3 thousand t, to which they contributed: feed consumption with 3701.3 thousand t (34.86%), seeds with
839.0 thousand t (7.90%), human consumption with 5,562.6 thousand t (52.39%), others use with 55.0 thousand t (0.52%), losses with 460.4 t (4.33%). Following these aspects, it can be concluded that, for that year, the balance was surplus: +0.1 thousand t.
3
4,117.4 thousand t. , the component parts were the following: 56.52% human consumption - 5,503.4 thousand t, 29.94% feed consumption - 2,915.6 thousand t, 8.99% seeds - 875.90 thousand t, 4.47% losses - 434.0 thousand t, 0.08% other uses - 8.1 thousand t.
If we take into account the situation of 2013, we can find a level of 10,511.9 thousand t for the total domestic available, 10,519.9 thousand t for the total consumption and a deficit of the balance of 8.0 thousand t. The total availability is based on: 11,555.5 thousand t total production (109.93%), 4,259.2 thousand t imports (40.52%), -624.5 thousand t stocks (-5.94%), 4,678.3 thousand t exports (-44.51%). At the level of total consumption the components were: 28.0 thousand t other uses (0.27%), 429.0 thousand t losses (4.08%), 842.0 thousand t seeds (8.0%), 3,387.5 thousand t fodder consumption
(32.20%), 5,833.4 thousand t consumption human (55.45%).
Based on the sequential values, specific for 2011, 2012 and 2013, the average period was determined. At the average level, the total available was 10,284.34 thousand t, this having the following structure: 106.38% total production (10,940.37 thousand t); 40.71% import (4,186.87 thousand t); 2.86% stocks (293.93 thousand t); -44.23% export (4,548.97 t).
For the total consumption a quota of 10,291.73 thousand t was reached, quota based on percentage contributions, as follows: 0.29% other uses (30.37 thousand t); 4.29% losses (441.13 thousand t); 8.28% seeds (852.30 thousand t); 32.40% feed consumption (3,334.80 thousand t); 54.74% human consumption (5,633.13 thousand t).
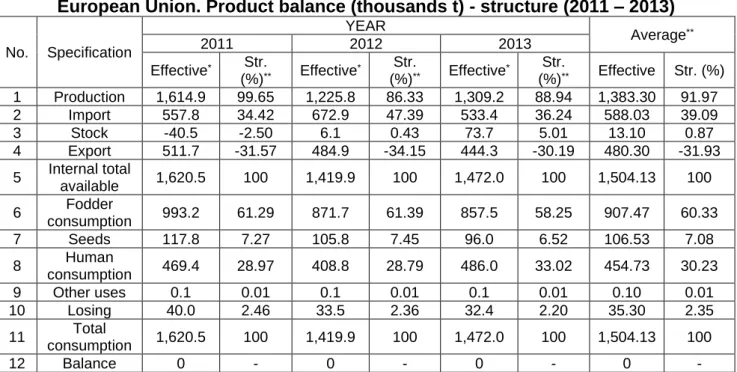
Regarding the European Union balance for peas, this is highlighted by the information contained in table 2.
Table 2.
European Union. Product balance (thousands t) - structure (2011 – 2013)
No. Specification
YEAR
Average**
2011 2012 2013
Effective* Str.
(%)** Effective*
Str.
(%)** Effective*
Str.
(%)** Effective Str. (%)
1 Production 1,614.9 99.65 1,225.8 86.33 1,309.2 88.94 1,383.30 91.97 2 Import 557.8 34.42 672.9 47.39 533.4 36.24 588.03 39.09 3 Stock -40.5 -2.50 6.1 0.43 73.7 5.01 13.10 0.87 4 Export 511.7 -31.57 484.9 -34.15 444.3 -30.19 480.30 -31.93
5 Internal total
available 1,620.5 100 1,419.9 100 1,472.0 100 1,504.13 100
6 Fodder
consumption 993.2 61.29 871.7 61.39 857.5 58.25 907.47 60.33 7 Seeds 117.8 7.27 105.8 7.45 96.0 6.52 106.53 7.08
8 Human
consumption 469.4 28.97 408.8 28.79 486.0 33.02 454.73 30.23 9 Other uses 0.1 0.01 0.1 0.01 0.1 0.01 0.10 0.01 10 Losing 40.0 2.46 33.5 2.36 32.4 2.20 35.30 2.35
11 Total
consumption 1,620.5 100 1,419.9 100 1,472.0 100 1,504.13 100
12 Balance 0 - 0 - 0 - 0
-*http://www.fao.org/faostat/fr/#data/BC (28.11.2018)
**my calculation
In 2011, the total domestic availability was 1,620.5 thousand t, at which level the following factors contributed differentially: 99.65%
3
which was based on the following contributions: 993.2 thousand t feed consumption - 61.29%, 469.4 thousand t human consumption - 28.97%, 117.8 thousand t seeds - 7.27%, 40.0 thousand t losses - 2.46%, 0.1 thousand t other uses - 0.01%.
For 2012, we can see a level of 1,419.9 thousand t of the total domestic available, level that has as component parts the following quantities: 6.1 thousand t stocks - 0.43%, 484.9 thousand t exports - -34.15%, 672.9 thousand t imports - 47.39 %, 1,225.8 thousand t production - 86.33%. Total consumption reached 1,419.9 thousand t, the quota based on the following components: 871.7 thousand t feed consumption - 61.39%, 408.8 thousand t human consumption - 28.79%, 105.8 thousand t seeds - 7.45%, 33.5 thousand t losses - 2.36%, 0.1 thousand t other uses - 0.01%.
At the level of 2013, the U. E. is characterized by a total domestic available of 1,472.0 thousand t and by a total consumption identical to that of the available one. The components of the total available were: production - 1,309.2 thousand t (88.94%), import - 533.4 thousand t (36.24%), stocks - 73.7
thousand t (5.01%), export - 444.3 thousand t (-30.19%). For total consumption, the components were: other uses 0.1 thousand t (0.01%), losses - 32.4 thousand t (2.20%), seeds - 96.0 thousand t (6.52%), human consumption - 486.0 thousand t (33.02%) and consumption fodder - 857.5 thousand t (58.25%).
The average of the period is characterized by an internal total available of 1,504.13 thousand t, whose structure is the following: 91.97% production (1,383.30 thousand t); 39.09% import (588.03 thousand t); 0.87% of stocks (13.10 thousand t); -31.93% export (480.30 thousand t).
From the point of view of the total consumption - 1,504.13 thousand t, it is found the existence of the following component parts: 0.01% other uses (0.10 thousand t); 2.35% losses (35.30 thousand t); 7.08% seeds (106.53 thousand t); 30.23% human consumption (454.73 thousand t); 60.33% feed consumption (907.47 thousand t).
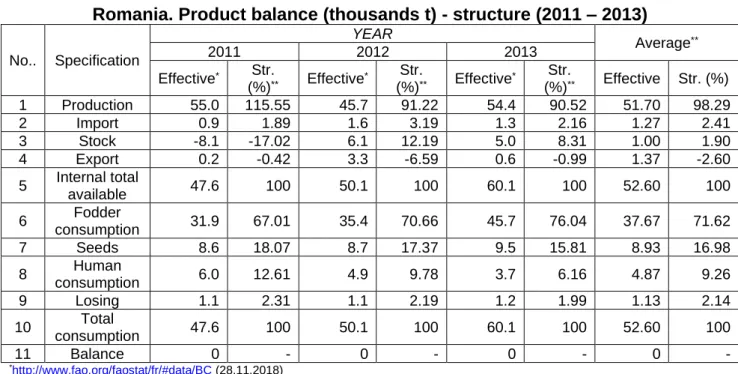
Table 3 presents the component elements of the national pea balance. It can be seen that the components of total consumption are missing the raw materials processed and other uses.
Table 3.
Romania. Product balance (thousands t) - structure (2011 – 2013)
No.. Specification
YEAR
Average**
2011 2012 2013
Effective* Str.
(%)** Effective*
Str.
(%)** Effective*
Str.
(%)** Effective Str. (%)
1 Production 55.0 115.55 45.7 91.22 54.4 90.52 51.70 98.29
2 Import 0.9 1.89 1.6 3.19 1.3 2.16 1.27 2.41
3 Stock -8.1 -17.02 6.1 12.19 5.0 8.31 1.00 1.90 4 Export 0.2 -0.42 3.3 -6.59 0.6 -0.99 1.37 -2.60
5 Internal total
available 47.6 100 50.1 100 60.1 100 52.60 100
6 Fodder
consumption 31.9 67.01 35.4 70.66 45.7 76.04 37.67 71.62 7 Seeds 8.6 18.07 8.7 17.37 9.5 15.81 8.93 16.98
8 Human
consumption 6.0 12.61 4.9 9.78 3.7 6.16 4.87 9.26
9 Losing 1.1 2.31 1.1 2.19 1.2 1.99 1.13 2.14
10 Total
consumption 47.6 100 50.1 100 60.1 100 52.60 100
11 Balance 0 - 0 - 0 - 0
3
**my calculation
For 2011, it can be observed that the balance was a balanced one, the availability being equal to the level indicated for consumption - 47.6 thousand t. The available is based on the following component elements: 55.0 thousand t production (115.55%), 0.9 thousand t imports (1.89 %), 0.2 thousand t exports (-0.42%), -8.1 thousand t stocks (-17.02%). The total consumption contributed to the losses: 1.1 thousand t (2.31%), human consumption - 6.0 thousand t (12.61%), seeds - 8.6 thousand t (18.07%) and feed consumption - 31.9 thousand t (67.01%).
At the level of 2012, the total domestic available was 50.1 thousand t, level at which the component elements had the following percentage participation rates: 91.22% production (45.7 thousand t), 3.19% imports (1.6 thousand t), 12.19% stocks (6.1 thousand t), -6.59% exports (3.3 thousand t). The total consumption was equal to the existing availability, presenting as components the following elements: feed consumption - 70.66% (35.4 thousand t), seeds - 17.37% (8.7 thousand t), human consumption - 9.78% (4.9 thousand t) and losses - 2.19% (1.1 thousand t).
In the case of 2013, there is a balance between available and consumption, each indicator reaching the level of 60.1 thousand t. - 5.0 thousand t (8.31%) and exports - 0.6 thousand t (-0.99%). The formation of total consumption is based on variable quantities of product used as follows: 1.2 thousand t losses (1.99%), 3.7 thousand t human consumption (6.16%), 9.5 thousand t seeds (15.81%), and 45.7 thousand t fodder consumption (76.04 %).
By determining the average of the period analyzed, a unitary balance is established. This situation starts from a total available of 52.60 thousand t, which had the following structure: 98.29% production (51.70 thousand t); 2.41%
imports (1.27 thousand t); 1.90% of stocks (1.0 thousand t); -2.60% exports (1.37 thousand t).
The total consumption reached 52.60 thousand t, its structure being as follows: 2.14% losses (1.13 thousand t); 9.26% human consumption (4.87 thousand t); 16.98% seeds (8.93 thousand t); 71.62% feed consumption (37.67 thousand t).
CONCLUSIONS
At the global level, the following aspects are observed: for the world balance its somewhat balanced character (deficit of 7.39 thousand t) is noted. Out of the available components, production predominates (94.68%), and in the case of consumption, human consumption and feed consumption predominate (54.74 and 32.40% respectively); the evolution, over time, of the constituent elements of the balance is uneven, with the exception of production (upward trend).
In the case of the European Union, the essential aspects of the balance relate to: the character of the balance is a balanced one, the total domestic availability being equal to the total consumption. The European Union depends on its own production (91.97% in the available structure). At the level of total consumption, feed consumption is predominant (60.33%) followed by human consumption (30.23%) - the order of the two components changes with respect to the world situation; the components of the balance evolve fluctuating for six components (production, import, total availability, human consumption and total consumption), then we note the upward evolutions (four components - exports, feed consumption, seeds and losses), and in other uses the evolution is constant.
3
different from the world one, but similar to the regional one (European Union). Production is available within the available range (98.29%); total consumption is predominated, as in the case of the regional situation, by feed consumption (71.62%), followed by significant consumption of seeds and human consumption (16.98 and 9.26% respectively); some elements of the balance have uneven evolutions (production, import, export), others have ascending trends (total availability, feed consumption, seed consumption and total consumption), human consumption evolves strictly downward, and at the level of losses the evolution is constant-ascending; the total domestic availability represents 0.51% of the global level of the indicator and 3.49% of the Community level. For total consumption, the weights are equal to those presented previously; for Romania, it would be worth noting the need to make better use of the existing potential for pea cultivation, given the possibilities of increasing the productive potential - especially if the cultivated areas would be resized..
BIBLIOGRAPHY
1. Barbu C., R.L. Pânzaru, 2000, Agrarian Economy, Hyperion Publishing House, Craiova.
2. Constantin M., et al., 2009, Marketing of Agro-Food Production, Agro Tehnica Publishing House, Bucharest.
3. Constantin M., 2017, Marketing of Agro-Food Production, Publishing house of the Romanian Academy of Scientists, Bucharest.
4. Constantin M., 2018, Explanatory dictionary of agro-marketing, Publishing. Economic Tribune, Bucharest
5. Manole. V. et al., 2002, Marketing diagnosis on the agricultural product chain, EvenimentulRomânesc Publishing House, Bucharest
6. Pânzaru R.L., Medelete D.M., 2005,
Agrarian Economy - Applications, Universitaria Publishing House, Craiova,
7. Pânzaru R. L., M. D. Medelete, G. Ștefan, 2009, Economics of vegetable production, University Publishing House, Craiova
8. Ștefan G., D. Bodescu, A. D. Toma, R. L. Pânzaru, 2007, The economy and the branch of agro-food production, Alfa Publishing House, Iasi.