Disorder-driven electronic localization and phase separation in superconducting Fe
1+yTe
0.5Se
0.5single crystals
S. Rößler,1,
*
Dona Cherian,2S. Harikrishnan,2H. L. Bhat,2,3Suja Elizabeth,2 J. A. Mydosh,4L. H. Tjeng,1F. Steglich,1and S. Wirth1
1Max Planck Institute for Chemical Physics of Solids, Nöthnitzer Straße 40, 01187 Dresden, Germany 2Department of Physics, Indian Institute of Science, C.V. Raman Avenue, Bangalore 560012, India
3Centre for Liquid Crystal Research, Jalahalli, Bangalore 560013, India
4Kamerlingh Onnes Laboratory, Leiden University, P.O. Box 9504, 2300 RA Leiden, The Netherlands
共Received 14 July 2010; revised manuscript received 30 September 2010; published 22 October 2010兲
We have investigated the influence of Fe excess on the electrical transport and magnetism of Fe1+yTe0.5Se0.5
共y= 0.04 and 0.09兲 single crystals. Both compositions exhibit resistively determined superconducting transi-tions共Tc兲with an onset temperature of about 15 K. From the width of the superconducting transition and the magnitude of the lower critical field Hc1, it is inferred that excess of Fe suppresses superconductivity. The linear and nonlinear responses of the ac susceptibility show that the superconducting state for these composi-tions is inhomogeneous. A possible origin of this phase separation is a magnetic coupling between Fe excess occupying interstitial sites in the chalcogen planes and those in the Fe-square lattice. The temperature deriva-tive of the resistivityd/dTin the temperature rangeTc⬍T⬍TawithTabeing the temperature of a magnetic anomaly, changes from positive to negative with increasing Fe. A log 1/Tdivergence of the resistivity above Tcin the sample with higher amount of Fe suggests a disorder-driven electronic localization.
DOI:10.1103/PhysRevB.82.144523 PACS number共s兲: 74.70.Xa, 81.10.⫺h
I. INTRODUCTION
The discovery of superconductivity in theLnFeAsO 共Ln = La, Ce, Pr, Sm兲family of compounds with critical tem-peratures 共Tc兲 up to 56 K 共Refs. 1–3兲 promoted an intense
search for novel Fe-based superconductors with similar crys-tal structure. Within a few months, several new supercon-ducting phases were discovered. Among them, tetragonal FeSe has the nominally simplest crystal structure. It has no charge reservoir layer separating the Fe2Se2 layers and,
hence, is considered as parent compound to all the Fe-based pnictide and chalcogenide superconductors.4 The supercon-ducting transition temperature共Tc兲 is found to be extremely
sensitive to the Fe:Se ratio, and the highest Tc⬃8.5 K at
ambient pressure is observed when the compound is closest to the stoichiometric composition.5Nevertheless, application of pressure to FeSe raisesTcas high as⬃37 K.6–8By
sub-stituting Te for Se,Tcis enhanced to⬃15 K for about 50%
Te doping.9,10The end member Fe
1+yTe is
nonsuperconduct-ing and exhibits an incommensurate antiferromagnetic 共AFM兲order, coupled to a structural distortion near 67 K.11 The incommensurability␦in Fe1+yTe can be easily tuned by
the value ofyand the AFM order becomes commensurate for the samples close to the stoichiometric composition 共i.e., y ⯝0兲.12In mixed Fe
1+yTe1−xSex, the magnetic order is found
to survive as short-range correlations for the samples with 0.25ⱕxⱕ0.49 even in the superconducting state.12–15 More recently, pressure-induced static magnetic order is observed in superconducting FeSe.16 Density-functional theory共DFT兲 calculations17 on the stoichiometric end members FeSe and FeTe indicate Fermi surface 共FS兲 structures very similar to those in Fe pnictides, where a spin-density-wave 共SDW兲 ground state is obtained due to FS nesting. In contrast to the DFT predictions, recent neutron-diffraction studies demon-strate a composition-tunable 共␦,␦兲 AFM order, which
propagates along the diagonal direction of the Fe-square lat-tice in the ab plane.11,12 This is unlike Fe pnictides, where the propagation vector of the SDW-type AFM order is along the共, 0兲edge of the Fe-square lattice.18In fact, a SDW gap was not observed in Fe1+yTe,19,20and FS nesting is not
con-sidered as the origin of magnetic order. Alternatively, a fluctuating-local-moment scenario has been invoked in order to explain the unusual magnetic properties of Fe1+yTe.21–23
At this point, it is worthwhile to mention that the phase diagram of the Fe chalcogenides is extremely complex. In the case of FeSe, nonsuperconducting phases such as Fe3Se4,
Fe7Se8, and hexagonal FeSe form in close proximity in the
temperature-composition phase diagram.24Hence, the tetrag-onal superconducting phase might contain these secondary phases in small quantities. Further, the synthesis procedure is prone to oxygen contamination and thus producing unwanted phases such as Fe2O3 and Fe3O4. All these phases are mag-netic and detrimental to superconductivity. Another crucial issue in the case of FeSe superconductors is the role played by excess of Fe. It is exceedingly difficult to obtain perfectly stoichiometric Fe chalcogenides and excess of Fe appears to be always present in synthesized compounds.4,5,9,10,12 The excess Fe ions randomly occupy interstitial sites关designated as Fe共2兲 sites兴 in the chalcogenide layer.11,12,25 DFT calculations26focusing on Fe
1+yTe indicate that the excess of
Fe occurs in the +1 valence state with each Fe+ donating approximately one carrier to the FeTe layer. Further, Fe+ is
found to be strongly magnetic with a local moment of 2.4 B. These moments can be expected to couple with the
magnetism of the FeTe sublattice resulting in a more com-plex magnetic order. It is predicted that, when FeTe is doped with Se, magnetism of interstitial Fe persists and results in a pair-breaking effect in the superconducting state.26 Indeed, recent experimental results clearly show suppression of superconductivity5,25,27 and localization effects25,28 induced by excess Fe.
Here we present resistivity, magnetization, and linear and nonlinear responses of the ac susceptibility of nominal Fe1+yTe0.5Se0.5single crystals for two different values of y.
The results clearly demonstrate that Fe excess causes a broadening of the superconducting transition, a phase sepa-ration in the superconducting state, and a localization of the charge carrier in the normal state.
II. EXPERIMENTAL
The single crystals used for the present investigation were grown using a horizontal Bridgman setup. Appropriate quan-tities of iron共purity 99.9%兲, selenium共99.999%兲, and tellu-rium 共99.999%兲 were mixed in a quartz ampoule in pow-dered form, evacuated to 10−6 mbar, sealed and kept in a
secondary quartz ampoule which is also evacuated and sealed. The ampoules were kept inside the Bridgman setup and the precursors were melted together at 950 ° C. Homog-enization was done for 48 h by rotation of the melt in alter-nating clockwise and anticlockwise directions. After homog-enization the furnace was translated at a rate of 9.2 mm/h so that a temperature gradient of 60 ° C/cm swept through the ampoule. Finally, the ampoule was cooled to room tempera-ture at a rate of 25 ° C/h. Plateletlike single crystals of typi-cal size of 5⫻4 mm2 with a thickness of 0.5–1 mm were
obtained. The as-grown crystals can easily be cleaved along the ab plane. Composition and elemental mapping along a certain direction was conducted by energy-dispersive x-ray analysis 共EDX兲. The EDX compositions of the single crys-tals corresponding to different starting compositions are listed in TableI.
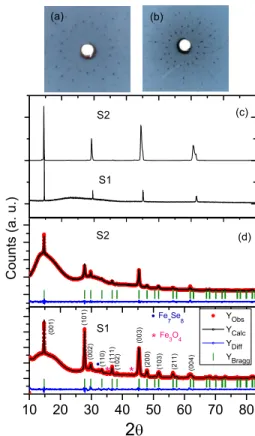
The Laue photographs in Figs. 1共a兲 and 1共b兲 indicate a good quality of the single crystals. The single-crystal x-ray diffraction 共XRD兲 data taken using CuK␣ radiation show, Fig.1共c兲, the harmonic peaks corresponding to the共00l兲 re-flection and are comparable with those published by Yadav and Paulose.29In addition, we have conducted powder XRD on our samples, the results of which are presented in Fig.
1共d兲. As is obvious from the comparison of Figs. 1共c兲 and
1共d兲the single crystals can be much better characterized by powder XRD. This, however, requires crushing the single crystals and can, therefore, only be conducted once all other measurements are completed. As identified in the Fig. 1共d兲,
sample S1 contains tiny peaks corresponding to small amounts of共ⱕ1%, see below兲Fe3O4and Fe7Se8phases. But
these peaks are not detected in the XRD pattern of sample S2. 共Sample S2 might also contain these secondary phases
below the detection limit of our powder XRD.兲The structure refinement was performed by Rietveld method using the FULLPROF code.30 The samples have a tetragonal structure and belong to theP4/nmmspace group. The lattice constants obtained from the refinement are a= 3.7982共1兲, c = 5.9990共4兲 Å for sample S1 and a= 3.7975共2兲, c = 6.0031共5兲 Å for sample S2. These parameters are close to those reported by Sales et al.31for single crystals of similar composition. Transport and ac-susceptibility measurements were performed with a Quantum Design physical property measurement system. Magnetization measurements were car-ried out by means of a superconducting quantum interference device magnetometer共Quantum Design兲. The measurements were conducted with current and field applied within theab plane.
III. RESULTS AND DISCUSSION
The influence of Fe excess on the electrical transport is immediately obvious in Fig. 2, where the normalized resis-tance as a function of temperature for the two samples is plotted. The room-temperature resistivity of samples S1 and S2 is about 0.9 m⍀cm and 0.6 m⍀cm, respectively. Both the samples show an onset of the superconducting transitions at around Tc⬃15 K, marked by the dotted vertical line in
Further, in the normal state, sample S2 displays a metallic behavior 共d/dT⬎0兲 whereas a⬀log 1/T divergence was observed for S1 below a temperatureTa⬃130 K. A similar
divergence is also reported by Liuet al.for Fe1.11Te0.64Se0.36
below 50 K.25They also found a kink in resistivity at 120 K. The authors associated this kink with the magnetic anomaly observed earlier in polycrystalline samples.10 On the other hand, Janaki et al.27 attributed a similar anomaly observed around 125 K in the magnetization measurement of their polycrystalline samples to the Verwey transition of a Fe3O4
spurious phase within the grain boundaries. In the present case, however, a −logT divergence in 共T兲 appears below Ta, where an anomaly in the magnetization is observed共see
Fig. 3兲. This suggests that the electrical transport is ex-tremely sensitive to the disorder caused by unwanted second-ary phases. We note that a similar −logT divergence was observed in the case of cuprates32–34and 1111 Fe arsenides.35 This is ascribed to the onset of insulating behavior via disorder-driven electron localization when superconductivity is suppressed by an external magnetic field.
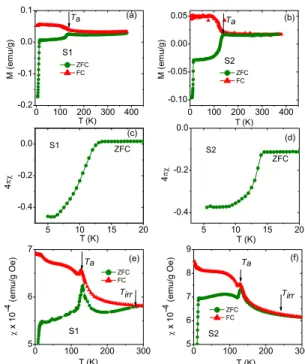
Now we turn to the results of dc magnetization and the ac susceptibility, performed with the goal of establishing some evidence for the existence of local moments. Figures 3共a兲
and3共b兲 show the zero-field-cooled 共ZFC兲 and field-cooled 共FC兲magnetization for the samples S1 and S2 measured in a magnetic field of 30 Oe and in the temperature range 2–380 K. Although the ZFC magnetization is negative below the superconducting transition, positive values of FC magnetiza-tion are consistent with magnetic impurities. Figures3共c兲and
3共d兲 present the ZFC dc-susceptibility curve below 20 K. Clearly, the superconducting transition for S2 is sharper in comparison to that of S1. However, the fraction of the vol-ume that is screened by superconducting currents estimated from the dimensionless dc susceptibility is slightly less for sample S2, see Figs. 3共c兲and3共d兲. The full screening value
is 4= −1. The dc susceptibilities measured in both FC and ZFC protocols with a field of 1 kOe are shown in Figs.3共e兲
and 3共f兲. Here, an irreversibility is clearly observed below
Tirrof about 280 K for S1 and 260 K for S2 in the ZFC and
FC susceptibilities. In addition to the superconducting
tran-sition, we observe an anomaly around Ta⬃130 K in both
samples. Comparing with Fig.2, it can be noted that in the temperature dependence of the resistance, the poorer sample S1 obeys the characteristic −logTdivergence only belowTa
whereas the better sample S2 displays a broad maximum aroundTa. There is no significant influence of the amount of
Fe on the value ofTa. The change in the magnetization⌬M
measured in a field of 1 kOe at Ta for sample S1 is 1.6
⫻10−3
B/f.u. and that for sample S2 is 1.0⫻10−3 B/f.u.
⌬M for Fe3O4 at the Verwey transition amounts to 0.25 B/f.u.36If we attribute⌬MatTain our measurements
entirely due to the Verwey transition of the secondary phase, then the estimated amount of Fe3O4in sample S1 is⬃0.6%
and that in sample S2 is⬃0.4%. Note that similar anomalies have earlier been observed in polycrystalline Fe共Se1−xTex兲0.82, where the value of Ta varied with the
amount of doping x.10 Neutron-scattering studies on these samples did not reveal any magnetic or structural transition at this temperature.12 However, a pronounced short-range quasielastic magnetic scattering at an incommensurate wave vector with a correlation length of 4 Å has been observed in a Fe1.08Te0.67Se0.33 sample with optimal composition and
highest Tc⬃15 K. The short-range quasielastic magnetic
scattering was observed in both the normal and the supercon-ducting states at the incommensurate wave vector共0.438, 0,
1
2兲.12 Alternatively, neutron-diffraction studies on
FeSe0.5Te0.5 reported by Horigane et al.37 showed that the
width of the共200兲peak changes below 125 K, suggesting a possible structural transition. In order to unambiguously de-cide whether the anomaly atTais associated with the Verwey
FIG. 2. 共Color online兲 Normalized in-plane resistance R共T兲/R共300兲as a function of temperature for Fe1+yTe1−xSexsingle crystals on a semilogarithmic plot. For exact compositions, see Table I. Note, for sample S1 R共T兲/R共300兲 displays −logT diver-gence belowTa⬃130 K. This figure is highly similar to Fig. 1b in Ref.25.
transition of the Fe3O4 or whether it is an intrinsic property
of the tetragonal Fe共SeTe兲, experiments which probe the sample properties on a more local scale are required. In an attempt to extract the effective moments, the dc-susceptibility in the FC protocol is fitted to =0+C/共T
−兲 in the temperature range 180–300 K. Here, 0 is the
temperature-independent susceptibility arising from netic core, paramagnetic van Vleck contributions, diamag-netic Landau orbital, and paramagdiamag-netic Pauli spin suscepti-bilities from conduction electrons.38,39Cstands for the Curie constant and is the Weiss temperature. It is known that in Fe-containing samples, data analysis is often hampered by the contribution of a ferromagnetic impurity,38,40and the in-verse susceptibility in the paramagnetic regime can thus be field dependent, see Fig.4. Therefore, we utilized the Honda-Owen method41 to eliminate the impurity contribution with the assumption that the magnetization of the ferromagnetic impurity saturates below 1 T. In this method, the magnetic-susceptibilityM/His plotted against 1/Hfor each tempera-ture. A Curie-Weiss law can be fitted to the extrapolated values of the magnetic susceptibilities in the limit 1/H→0 共Fig. 4兲. From the fit, we obtain 0= 0.0019 emu/g Oe, an
effective moment ofeff= 1.49 Band= −50 K for sample
S1. A similar approach for sample S2 provided 0
= 0.0017 emu/g Oe,eff= 1.49 B, but= −88 K. A
Curie-type behavior in Fe1+yTe1−xSex has been reported by other
research groups28,38,42 as well and is attributed to Fe excess with localized moments.
In order to further probe the superconducting state, we performed linear and nonlinear ac-susceptibility measure-ments. As this method gives more extensive information in the zero-field limit compared to the dc magnetization and because frequency can be used as an additional tuning pa-rameter, the method can provide insight into the nature of the transition not available with the aforementioned techniques.43 Further, the measurement of higher-harmonic susceptibility is even more useful because it only probes the nonlinear magnetization. The fundamental 共linear兲 and higher-harmonic 共nonlinear兲 ac-susceptibility technique has extensively been used for characterizing the inhomogeneities in various superconductors including the high-Tc
cuprates.44,45The technique is particularly useful in the case of Fe-based superconductors, where a phase separation of magnetic and superconducting entities is expected.12–14 In Figs.5共a兲–5共d兲, the real and imaginary parts of both the fun-damental共1兲and third-harmonic共3兲 are presented for the
samples S1 and S2. When a homogeneous sample goes through the superconducting transition, the real part of the linear susceptibility1
⬘
always changes monotonically to the full screening value of = −1/4. On the other hand, the imaginary part 1⬙
in a homogeneous superconductor either changes monotonically or displays a peak and goes from its normal state value to substantially zero in the superconduct-ing state. Also, the magnitude of the third harmonics 兩3兩=共3
⬘
2+3⬙
2兲1/2 is taken to be proportional to 1⬙
共T兲 共Ref. 46兲and forms a peak in the temperature region of the supercon-ducting transition. In our samples, 1
⬘
共T兲does not show full diamagnetic screening, Fig.5共a兲, and1⬙
共T兲displays a shoul-der in Fig. 5共b兲 rather than a peak below Tc. Instead of asingle sharp peak,3
⬘
共T兲and3⬙
共T兲have double structures as shown in Figs. 5共c兲 and 5共d兲, respectively. These are clearindications of a phase separation in the superconducting state.47,48The phase separation into magnetic and supercon-ducting phases is further revealed in the field dependence of magnetization共M-H兲loops measured at 2 K, see Figs.6共a兲
and 6共b兲. It is interesting to note that sample S1 contains a
larger ferromagnetic component than sample S2, probably due to larger amounts of excess Fe. As a result, the minimum in the initial magnetization curve which is related to the lower critical field Hc1, increases from⬃0.175 kOe for S1
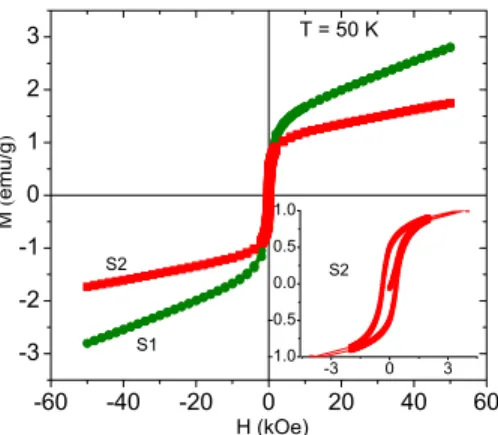
关Fig. 6共c兲兴 to ⬃1.75 kOe for S2 关Fig. 6共d兲兴. This clearly indicates that the Fe excess suppresses the superconductivity. Consequently, the mixed 共vortex兲 state appears at a lower magnetic field in sample S1 with larger Fe excess. TheM-H loops at 50 K in the normal state, Fig.7, displays a knee at low fields. The corresponding net moment estimated from the extrapolation ofMfrom the high fields toH→0 are 1.38 emu/g 共0.046 B/f.u.兲 and 1.12 emu/g共0.032 B/f.u.兲, for
samples S1 and S2, respectively. Further, a small hysteresis FIG. 4. 共Color online兲Inverse magnetic susceptibility H/M共T兲
of sample S1 for different external magnetic fields and extrapolated values 1/H→0, according to the Honda-Owen method. Line rep-resents the Curie-Weiss fit.
is seen even in S2 with lesser amount of excess Fe as shown in the inset of Fig. 7. This indicates a ferromagnetic cou-pling, possibly originating from Fe excess. In fact, ferromag-netic behavior was earlier reported in FeSe thin films,49,50 before superconductivity was discovered in these systems.
IV. CONCLUSIONS
We investigated the influence of Fe excess on the magne-tism and superconductivity in Fe-chalcogenide supercon-ductors. A “metal”-“insulator” transition is observed when the amount of Fe excess is increased from y= 0.04 to 0.09. The insulating state is characterized by a log 1/Tdivergence, which suggests a magnetic impurity and/or disorder-driven electronic localization by the presence of Fe excess. This
result is in accord with a scenario suggested by Liu et al.25 Evidence for a phase separation is provided by the nonlinear ac susceptibility for the compositions studied. Our results clearly demonstrate that the physical properties of tetragonal Fe chalcogenide are extremely sensitive to disorder and im-purities. Also, more experimental and theoretical studies are necessary to understand the nature of the couplings between interstitial Fe and the Fe in the Fe-square lattice.
ACKNOWLEDGMENTS
The authors thank L. Craco, C. Geibel, and T. V. Ra-makrishnan, for stimulating discussions. U. Burkhardt, C. Koz, and C. Shivakumara are gratefully thanked for their help in sample characterization. This work is partially sup-ported by the German Academic Exchange Service共DAAD under Grant No. ID 50726385兲and the Department of Sci-ence and Technology 共DST-India兲.
1Y. Kamihara, T. Watanabe, M. Hirano, and H. Hosono, J. Am.
Chem. Soc. 130, 3296共2008兲.
2G. F. Chen, Z. Li, D. Wu, G. Li, W. Z. Hu, J. Dong, P. Zheng, J.
L. Luo, and N. L. Wang,Phys. Rev. Lett. 100, 247002共2008兲. 3Z. A. Renet al.,EPL 83, 17002共2008兲.
4F. C. Hsu et al., Proc. Natl. Acad. Sci. U.S.A. 105, 14262 共2008兲.
5T. M. McQueenet al.,Phys. Rev. B 79, 014522共2009兲. 6Y. Mizuguchi, F. Tomioka, S. Tsuda, T. Yamaguchi, and Y.
Ta-kano,Appl. Phys. Lett. 93, 152505共2008兲. 7S. Medvedevet al.,Nature Mater. 8, 630共2009兲.
8S. Margadonna, Y. Takabayashi, Y. Ohishi, Y. Mizuguchi, Y.
Takano, T. Kagayama, T. Nakagawa, M. Takata, and K. Pras-sides,Phys. Rev. B 80, 064506共2009兲.
9K. W. Yehet al.,EPL 84, 37002共2008兲.
10M. H. Fang, H. M. Pham, B. Qian, T. J. Liu, E. K. Vehstedt, Y.
Liu, L. Spinu, and Z. Q. Mao,Phys. Rev. B 78, 224503共2008兲. 11S. Liet al.,Phys. Rev. B 79, 054503共2009兲.
12W. Baoet al.,Phys. Rev. Lett. 102, 247001共2009兲.
13J. Wen, G. Xu, Z. Xu, Z. W. Lin, Q. Li, W. Ratcliff, G. Gu, and
J. M. Tranquada,Phys. Rev. B 80, 104506共2009兲. 14R. Khasanovet al.,Phys. Rev. B 80, 140511共R兲 共2009兲. 15M. Lumsdenet al.,Nat. Phys. 6, 182共2010兲.
16M. Bendele, A. Amato, K. Conder, M. Elender, H. Keller, H. H.
Klauss, H. Luetkens, E. Pomjakushina, A. Raselli, and R. Khasanov,Phys. Rev. Lett. 104, 087003共2010兲.
17A. Subedi, L. Zhang, D. J. Singh, and M. H. Du,Phys. Rev. B
78, 134514共2008兲.
18C. de la Cruzet al.,Nature共London兲 453, 899共2008兲. 19G. F. Chen, Z. G. Chen, J. Dong, W. Z. Hu, G. Li, X. D. Zhang,
P. Zheng, J. L. Luo, and N. L. Wang,Phys. Rev. B 79, 140509 共2009兲.
20Y. Xia, D. Qian, L. Wray, D. Hsieh, G. F. Chen, J. L. Luo, N. L.
Wang, and M. Z. Hasan,Phys. Rev. Lett. 103, 037002共2009兲. 21F. Ma, W. Ji, J. Hu, Z. Y. Lu, and T. Xiang,Phys. Rev. Lett. 102,
177003共2009兲.
22A. M. Turner, F. Wang, and A. Vishwanath,Phys. Rev. B 80,
224504共2009兲.
23M. D. Johannes and I. I. Mazin, Phys. Rev. B 79, 220510 共2009兲.
24W. Schuster, H. Mikler, and K. Komarek,Monatsch. Chem. 110, FIG. 6. 共Color online兲 Magnetization as a function of applied
magnetic field at 2 K for samples共a兲S1 and共b兲S2. Panels共c兲and
共d兲display the low-field initial magnetization curves for samples S1 and S2, respectively. The minima are marked by arrows共see text兲.
共 兲 32Y. Ando, G. S. Boebinger, A. Passner, T. Kimura, and K. Kishio,
Phys. Rev. Lett. 75, 4662共1995兲.
33G. S. Boebinger, Y. Ando, A. Passner, T. Kimura, M. Okuya, J.
Shimoyama, K. Kishio, K. Tamasaku, N. Ichikawa, and S. Uchida,Phys. Rev. Lett. 77, 5417共1996兲.
34S. Ono, Y. Ando, T. Murayama, F. F. Balakirev, J. B. Betts, and
G. S. Boebinger,Phys. Rev. Lett. 85, 638共2000兲. 35S. Riggset al.,Phys. Rev. B 79, 212510共2009兲. 36K. Paul,Cent. Eur. J. Phys. 3, 115共2005兲.
共
York, 1992兲.
45T. Ishida and R. B. Goldfarb,Phys. Rev. B 41, 8937共1990兲. 46T. Ishida and H. Mazaki,J. Appl. Phys. 52, 6798共1981兲. 47H. Clauset al.,Physica C 200, 271共1992兲.
48H. Asaoka, T. Ishida, Y. Kazumata, K. Okuda, K. Noda, and H.
Takei,Jpn. J. Appl. Phys., Part 1 33, 6537共1994兲.
49Q. Feng, D. Shen, J. Zhang, B. Li, B. Li, Y. Lu, X. Fan, and H.