The Structural Hierarchy and Mechanical Properties of Fibrin Described with a Multi-scale Model
Nathan E. Hudson
A dissertation submitted to the faculty of the University of North Carolina at Chapel Hill in partial fulfillment of the requirements for the degree of Doctor of Philosophy in the
Department of Physics and Astronomy
Chapel Hill 2011
iii Abstract
Nathan E. Hudson: The Structural Hierarchy and Mechanical Properties of Fibrin Described with a Multi-scale Model
iv
v
Acknowledgements
This work was made possible through the dedication of many individuals who poured parts of their lives into my own to make me the person and scientist that I am today. I am indebted to Professor Michael Falvo for his guidance and patience as I learned to think independently as a scientist. Mike always has his door open, and I used that access liberally. I am grateful to Professor Rich Superfine for pushing me to stretch myself and explore areas beyond my current level of comfort. Professor E. Timothy O’brien provided my first training in biological sample preparation and has provided invaluable insight throughout this process. Professor Susan Lord has been a wonderful collaborator and has shown great patience in dealing with us physics types as we try to understand the complexity of biochemistry and fibrin in particular. I’ve had the pleasure of working with many others in the fibrinogen research group on campus including Barbara Cardinali, Lihong Huang, Lifang Ping, Kellie Beicker, and John Houser who have assisted with experiments and helped me in my understanding. A special thanks goes to Professor Oleg Gorkun who has provided many avenues of research to pursue and reviewed this document at the last second, and to Laurel Averett for allowing me to use her dissertation as a template.
vi
Professor Nikolay Dokholyan, Professor Feng Ding and Pradeep Kota all provided their time and expertise in helping me perform the DMD simulations. Without their help chapter 4 would not have happened.
My colleagues in CISMM have provided a wonderful and thought provoking work environment. I am grateful for every time each of them has answered one of my ignorant questions with patience and clarity. The community in the group is rare, I believe, for a science lab; and much credit goes to Rich Superfine for the collaborative environment he created. I am also grateful to my computer science colleagues, especially Professor Russell Taylor for making our lives much easier with automated software.
I am grateful to the NIH and NSF for continued funding throughout my time at UNC. I also would like to thank the NIH/NCRR for funding the Biomedical Analysis and Simulation Supercomputer (BASS) which was used for all simulations described in the text. I also owe a debt of gratitude to Hilary Hicks and Photometrics for their generous loan of the Evolve 128 camera which enabled the analysis of the fiber recoil dynamics
vii Preface
Many parts of this work were done in collaboration with other talented scientists. Chapter 2 represents a publication for which I was one of two co-first authors. My friend and collaborator John Houser developed the worm-like chain based model and performed the in-situ stiffening measurements described in the paper. The paper was published previous to writing this thesis with the following citation:
Houser, J.R.*, Hudson, N.E.,* Ping, L., O’Brien III, E.T., Superfine, R., Lord, S.T., Falvo, M.R. Evidence that the αC Region is Origin of Low Modulus, High Extensibility, and Strain Stiffening in Fibrin Fibers. Biophys J. 2010 November; 99(9): 3038–3047
Permission to include the article in its entirety in a PhD dissertation was retained from Elsevier Limited (publisher of BPJ).
Chapter 5 of this work represents a publication for which I was the primary first author. The paper was published previous to writing this thesis with the following citation:
Hudson, N.E., Houser, J.R., O'Brien III, E.T., Taylor II, R.M., Superfine, R., Lord, S.T., and Falvo, M.R. Stiffening of Individual Fibrin Fibers Equitably Distributes Strain and Strengthens Networks. Biophys J. 2010 April; 98(8): 1632– 1640
Permission to include the article in its entirety in a PhD dissertation was retained from Elsevier Limited (publisher of BPJ).
viii
Table of Contents
List of Tables ... xiv
List of Figures ...xv
List of Abbreviations and Symbols... xviii
Chapter 1. Introduction ...1
1.1 Fibrinogen and Fibrin: Structure and Polymerization ... 1
1.1.1 Fibrin(ogen) Molecular Structure ...3
1.1.2 The Fibrin Fiber Structure ...11
1.2 The Mechanical Properties of Fibrin ... 15
1.3 Mechanical Models for the Extension of Fibrin Fibers within a Network ... 17
1.4 Significance and Goals of this project ... 23
Chapter 2. Evidence that the αC Region is the Origin of the Low Modulus, High Extensibility, and Strain Stiffening in Fibrin fibers ...27
2.1 An Introduction to Fibrin Fiber Mechanics ... 27
2.2 Methods ... 28
2.2.1 Structured Surface Preparation ...28
2.2.2 Fibrinogen Preparation ...29
2.2.3 Optical Microscopy ...30
2.2.4 AFM ...31
2.2.5 In-situ measurement of fiber Stiffening ...32
ix
2.3.1 Single Fiber Stress vs. Strain ...34
2.3.2 In situ measurements ...35
2.3.3 The αC Stretching Model ...37
2.3.4 Enthalpic backbone stiffness of the fibrin fiber ...44
2.3.5 Does the αC connector region mediate fibrin’s initial extensibility? ...46
2.3.6 Analysis of the Coiled-Coil (CC) unfolding model ...48
2.3.7 Force per Monomer ...55
2.3.8 Fibrin as Elastomeric Protein ...58
2.4 Conclusions ... 59
Chapter 3. Fibrin Fiber Recoil Dynamics ...61
3.1 Introduction ... 61
3.2 Materials and Methods ... 63
3.2.1 Optical microscopy ...63
3.2.2 Discrete Molecular Dynamics ...63
3.2.3 Fibrin Polymerization ...64
3.3 Experimental Results ... 64
3.4 An α-helix to β-sheet transition ... 67
3.5 Conclusions ... 70
Chapter 4. Unfolding Energy Barriers of the Coiled coil, γ-γ and αC region of the Fibrin Molecule ...73
4.1 Beyond the αC region ... 73
4.2 Developing a Structural Model for the αC Region of the Fibrin Molecule ... 74
x
4.2.2 A computationally Identified β helix structure of the fibrin αC
region ...76
4.2.3 Thermal unfolding of the αC region indicates the relative stability of the β helix ...79
4.2.4 Comparing properties of the αC computational structure with known experimental data ...80
4.2.5 Conclusions ...87
4.3 The Unfolding Energy Barrier of the αC Domain ... 88
4.3.1 Methods ...88
4.3.2 Patterns in Unfolding the αC domain...89
4.3.3 Calculating the Unfolding Energy Barrier of the αC Region ...90
4.4 The Unfolding Energy Barrier of the Coiled Coil Region Probed by DMD ... 91
4.4.1 Methods ...92
4.4.2 Results ...93
4.5 Unfolding of the γ Regions of the Fibrin Molecule ... 97
4.5.1 Methods for SDMD simulations of the fibrin γ-γ interface ...98
4.5.2 Methods for SDMD simulations of the fibrin γ-C terminus unfolding ...100
4.5.3 γ-C and γ-γ unfolding energy barriers ...101
4.6 The SLαCK Molecular Model for Fibrin Extension ... 107
Chapter 5. Stiffening of Individual Fibrin Fibers Equitably Distributes Strain and Strengthens Networks ...113
5.1 The Mechanical Properties of Fibrin in the Context of Biopolymer Networks ... 113
5.2 Materials and Methods ... 115
5.2.1 Fluorescent Microscopy Applied to Fibrin Fibers ...115
xi
5.2.3 Growing Fibrin Networks on Structured Surfaces ...116
5.2.4 Stretching Networks with an AFM ...117
5.2.5 Network Strain measurements ...119
5.2.6 Using Webslinger to Simulate Network Stretching ...120
5.3 Results and Discussion ... 121
5.3.1 Results from Stretching Fibrin Networks ...121
5.3.2 Network Modeling ...123
5.3.3 Network Strain Distribution Narrowing ...128
5.3.4 Discussion ...135
5.4 Conclusion ... 140
Chapter 6. Summary and Future Directions ...142
6.1 Conclusions and Physiological Relevance ... 142
6.1.1 The Material Properties of Fibrin ...142
6.1.2 Physiological Relevance ...146
6.2 Future Directions ... 148
6.2.1 Measuring the mechanical properties of recombinant fibrinogen variants ...148
6.2.2 Cryo-Electron Microscopy of Fibrin Fibers and Fibrin variants ...151
6.2.3 FIONA/FRET Studies of Single Molecules within Fibrin Fibers ...155
6.2.4 Single Molecule AFM Studies of Fibrin(ogen) Dynamics ...158
6.2.5 Developing a Coarse-Grained Model for the Fibrin Fiber ...160
6.2.6 Measuring the effects of other blood coagulation factors on Fibrin’s mechanical properties ...162
xii
Appendix A: An Overview of Molecular Dynamics Methods ...165
A.1 Molecular Dynamics: A Primer ... 165
A.1.1 An Brief History to Molecular Dynamics ...165
A.1.2 The Basic Molecular Dynamics Mechanism ...166
A.1.3 Potential Energy or Force Field calculations in MD ...167
A.2 The foundation of the MD method: statistical mechanics ... 171
A.2.1 A review of statistical ensembles ...171
A.2.2 The ergodic hypothesis ...174
A.2.3 Statistical ensembles in MD ...176
A.3 Generating a Canonical Ensemble ... 177
A.3.1Woodcock Thermostat ...177
A.3.2 Anderson Thermostat ...178
A.3.3 Berendsen Thermostat ...178
A.3.4 Nose-Hoover Thermostat ...179
A.3.5 Langevin dynamics ...180
A.4 Molecular Dynamics of “Large” Systems ... 181
A.5 All Atom Discrete Molecular Dynamics (AADMD) ... 183
A.5.1 DMD Equations of Motion ...183
A.5.2 AADMD Potential Energy Terms ...185
A.6 Calculating free energies from MD simulations ... 188
A.6.1 The Weighted Histogram Analysis Method (WHAM) ...188
xiii
xiv List of Tables
Table 1.1 A comparison of the potential models for fibrin mechanical properties...……25 Table 5.2 A comparison of network properties of 18 networks stretched in
these experiments………... ………...144 Table 6.2 A comparison of the potential models for fibrin mechanical
xv List of Figures
Figure 1.1 The Fibrin Hierarchy ... 3
Figure 1.2 The Fibrinogen molecule ... 7
Figure 1.3 Fibrin knob:hole interactions and Protofibril Formation... 10
Figure 1.4 Fibrin Fiber Banding ... 14
Figure 1.5 Coiled-coil (CC) extension model ... 18
Figure 1.6 The Transverse Cross-linking (TCL) Extension Model ... 19
Figure 1.7 The αC extension model ... 21
Figure 2.1 Set up for single fiber and network stretching experiments ... 29
Figure 2.2 Stress vs. Strain plots of individual fibrin fibers. ... 35
Figure 2.3 Average tangent modulus at discrete strains for ligated (N=14) and un-ligated (N=14) fibers. ...35
Figure 2.4 Left: Western blot of fibrin showing Right: In-situ fiber stiffness measurements. Fiber stiffness before (blue) and after (red) FXIII ligation. ...37
Figure 2.5 Fibrin structure and corresponding mechanical model ... 39
Figure 2.6 Force vs. Strain data ... 43
Figure 2.7 Several representative experimentally obtained force curves ... 46
Figure 2.8 Single fiber force strain plot for coiled-coil model. ... 51
Figure 2.9 Fitting Single Fiber force vs. extension data with the Coiled-coil model. ... 54
Figure 2.10 Force per molecule (FPM) plots for one fiber with three different packing assumptions. ...57
Figure 2.11 Force per monomer as a function of fiber strain ... 58
Figure 3.1 Fibrin Fiber Recoil Models Based on the Mechanism of Extension ... 63
xvi
Figure 3.3 Fibrin Recoil Dynamics Captured with High Speed
Fluorescence Microscopy ...66
Figure 3.4 β-sheet Relaxation ... 70
Figure 4.1 Structure of the fibrin αC region ... 78
Figure 4.2 Specific Heat of the αC Structure ... 80
Figure 4.3 β-hairpin vs. β-helix ... 82
Figure 4.4 Unfolding the αC region at 25pN. ... 90
Figure 4.5 The Structure and Force Attachment Points for the DMD Simulations ... 93
Figure 4.6 Unfolding Energy Barrier ... 94
Figure 4.7 Coiled coil unfolded distance vs. Force ... 96
Figure 4.8 α-helix to β-sheet transition ... 97
Figure 4.9 Unhinging of th γ-γ connection under force ... 102
Figure 4.10 Step Heights between γ-C unfolding events ... 103
Figure 4.11 Forced Unfolding of the γ-C domain ... 106
Figure 4.12 The SLαCK model for Fibrin Fiber Extension ... 112
Figure 5.1 Experimental setup ... 119
Figure 5.2 Network Strain Measurements. ... 123
Figure 5.3 Experiment vs. Simulations ... 125
Figure 5.4 Single fibrin fiber force curve ... 127
Figure 5.5 Ligated network strain distributions ... 130
Figure 5.6 Linear springs with different stiffness ... 133
Figure 5.7 Unligated network strain distributions ... 135
Figure 5.8 The Network Strengthening Mechanism of Strain Stiffening ... 137
xvii
Figure 6.1 Segmenting protofibrils within a Cryo-EM fibrin fiber section ... 154
Figure 6.2 Successive Levels of Coarse Graining ... 161
Figure 6.3 Fiber Tension Loss ... 163
Figure A.1 DMD Potential Energy Terms ... 188
Figure B.1 Epifluorescence vs. Transmission Illumination ... 199
Figure B.2 Snell’s Law ... 204
Figure C.1 Basic AFM Setup ... 207
xviii
List of Abbreviations and Symbols
~ approximately
> greater than
< less than
% percentages
- negative
+ positive
± statistical uncertainty
2-D two dimensions
α fibrin alpha chain after fibrinopetide A cleavage αC C-terminal region of the fibrino(ogen) α chain α-helix alpha-helix, a type of coiled protein structure β fibrin beta chain after fibrinopeptide B cleavage β-sheet beta-sheet, a type of folded protein structure β-C or β-nodule C-terminal region of the fibrino(ogen) β chain
γ fibrin(ogen) gamma chain
γ-C or γ-nodule C-terminal region of the fibrino(ogen) γ chain
γ-γ interface between the γ-nodules of two adjacent fibrin molecules
ΔF change in Force
ΔGB unfolding energy barrier
Δl or ΔL change in length
Δt change in time
xix
ε strain
θC Critical angle
θI Incident angle
θT Transmitted angle
κ effective spring constant
λ wavelength
η Relaxation time constant
ηB Unfolding Time
ηo escape attempt frequency
μm micrometer
μs microsecond
Å angstrom
A cross-sectional area
AADMD All Atom Discrete Molecular Dynamics
Aα fibrinogen α-chain before fibrinopetide A cleavage Aα251 recombinant fibrinogen truncated at α-chain residue 251
A:a fibrin knob A bound to hole a
AFM Atomic Force Microscope
AP Attachment Point
ASA Accessible Surface Area
Bβ fibrinogen β-chain before fibrinopeptide B cleavage
B:b fibrin knob B bound to hole b
xx
BPTI Bovine Pancreatic Trypsin Inhibitor
Ca2+ Calcium Ion
CaCl2 Calcium Chloride
CC Coiled-coil extension model
CCD charge-coupled device
CD Circular Dichroism
CHO Chinese Hamster Ovary
Cryo-EM Cryogenic Electron Microscopy
Cv specific heat
Cys amino acid Cystein
Dfib fiber diameter
dE incremental change in Energy
Dmol fibrin molecule diameter
Dmoleff effective molecule diameter
DH Donor Hydrogen
DMD Discrete Molecular Dynamics
DNA DeoxyriboNucleic Acid
do distance from lens to sample
dR incremental change in length
E Young’s Modulus or energy
EDTA ethylenediaminetetraacetic acid
EM Electron Microscope
xxi
Eqn equation
F Force
Fc critical force
FEP Fixed End Point
Ffib Force on the fiber
FIONA Fluorescence Imaging with One-Nanometer Accuracy
FpA fibrinopeptide A
FpB fibrinopeptide B
FPM Force Per Molecule
fps frames per second, a camera frame rate
fo focal length
FRET Fluorescence Resonance Energy Transfer FXIII fibrin stabilizing factor thirteen
FXIIIa activated fibrin stabilizing factor thirteen
G Shear Modulus
GB Generalized Born
Gln amino acid Glutamine
Gly amino acid Glycine
GPa GigaPascal, A measure of Stress
GHRP a ligand of the sequence Glycine, Histidine, Arginine and Proline GPRP a ligand of the sequence Glycine, Proline, Arginine and Proline GPRV a ligand of the sequence Glycine, Histidine, Arginine, and Valine
H Helmholtz Free Energy
xxii
HBS HEPES Buffered Saline
HC Human-Chicken hybrid fibrinogen
HEPES 4-(2-hydroxyethyl)-1-piperazineethanesulfonic acid
His amino acid Histidine
HPLC High Performance Liquid Chromatography
Hz Hertz, a measure of frequency
I-TASSER Iterative Threading ASSembly Refinement
K Kelvin
k spring constant
kBT Boltzmann’s constant times Temperature, a measure of energy
kDa kiloDalton, a measure of mass
Ko protein backbone stiffness
L Length
LJ Leonard Jones
Lo Initial Length
Lc or lc Contour Length
Lf folded length
Lp persistence Length
Lu unfolded length
Lys amino acid Lysine
MARTINI a coarse grained MD force field
MD Molecular Dynamics
mg milligram
mL milliLiter
xxiii
MPa MegaPascal, a measure of stress
ms millisecond
N Number of trials or alternatively Number of Proteins
NA Numerical Aperture
NaCl Sodium Chloride
NALMS NAnometer-Localized Multiple Single-molecule
NHT Nose-Hoover Thermostat
NIH National Institutes of Health
nm nanometer, a measure of length
NMR Nuclear Magnetic Resonance
Nmol number of molecules
nN nanoNewtons
ns nanoseconds
OLS Optical Lever Sensitivity
PDB Protein Database
PDMS Poly Di-Methyl Siloxane
pH a measure of acidity
pM picoMolar
PMF Potential of Mean Force
pN piconewtons, a measure of force
PP Pull Point
PSF Point Spread Function
Pro amino acid Proline
QPD Quadrant Photo Diode
xxiv
REXMD Replica Exchange Molecular Dynamics
s seconds
s-1 a shear rate or alternatively a strain rate
S Entropy
SAXS Small Angle X-ray Scattering
SDMD Steered Discrete Molecular Dynamics
SDS Sodium Dodecyl Sulfate
SDS-PAGE Sodium Dodecyl Sulfate PolyAcrylamide Gel Electrophoresis
SEM Scanning Electron Microscope
SLαCK a model for fibrin fiber extension
SMD Steered Molecular Dynamics
SL-R Left-Right Sensitivity
SS Structured Surface
ST-B Top-Bottom Sensitivity
T Temperature
TEM Transmission Electron Microscopy
TCL Transverse Cross-Linking extension model
TIRF Total Internal Reflection
Tm melting temperature
tPa tissue Plasminogen Activator
U Unit
UV Ultra Violet
v velocity
xxv
WHAM Weighted Histogram Analysis Method
WLC Worm-Like Chain, a polymer physics model
xu unfolding length
Chapter 1. Introduction 1.1 Fibrinogen and Fibrin: Structure and Polymerization
The cardiovascular system consists of a network of arteries, capillaries and veins (the vasculature) designed to distribute oxygen and nutrients throughout the body. The vasculature can be a very dynamic environment with the heart pumping blood at 1Hz, and shear rates ranging from close to 0s-1 in near static conditions up to 100,000s-1 in areas of stenosis.(1) In spite of the wide range of environmental conditions, the body must have a functioning wound healing system that can withstand the high shear rates, without plugging the vasculature at low shear rates. The physiological ability to accommodate this dynamic range of behaviors is achieved in large part through the properties of the blood protein fibrinogen and its activated counterpart fibrin.
2
process called fibrinolysis and dissolve the fibrin network, allowing blood to circulate freely again.(9, 10) Proper wound healing requires that the clot polymerize properly, withstand any shear stresses without failing, and dissolve rapidly after the healing is complete.
3
Figure 1.1 The Fibrin Hierarchy: Fibrin, as a protein based biopolymer, has a structural hierarchy spanning many orders of spatial magnitude. The lowest level is a chain of amino acids; these fold into secondary structures such as helical turns. These secondary structures form tertiary structures containing α-helices and β-sheets. Finally these structures combine to form the whole molecule. These molecules then polymerize into protofibrils, fibers and eventually networks. A complete model of the fibrin hierarchy, will be able to predict how a mutation in a particular amino acid will affect the mechanics of fibrin networks.
1.1.1 Fibrin(ogen) Molecular Structure
4
(C-terminus). Within the fibrinogen molecule, all six chains are oriented so that their N-termini are located in the central region (historically called the E region) of the molecule, and their C-termini are located in the periphery (See Figure 1.2). From both sides of the central nodule, three chains extend into coiled-coils that terminate in the two distal nodules. The C-terminal segments of the B and chains fold independently to form the compact, globular - and -nodules, respectively (the last part of the coiled-coil combined with the β-nodule and γ-nodule are referred to as the D region). The C-terminal segment of the A chain goes through the D region, and folds back to form a brief fourth α-helix, but beyond this fourth coil the structure of the C-terminus of the A
chain (the αC region) is not visible in the X-ray structure indicating an inhering flexibility in this region.(12) The αC region is often grouped into two sub regions, the αC connector (221-391) and the αC domain (392-610). The αC connector region is thought to be unstructured while there exists some debate about the structure of the αC domain.(13, 14)
5
7
8
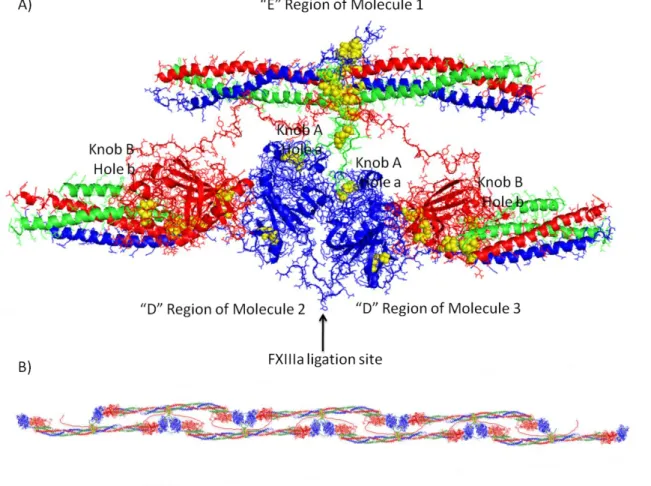
Fibrinogen is converted into the insoluble fibrin when the enzyme thrombin cleaves fibrinogen at 4 sites: after residue 16 in each A chain releasing fibrinopeptide A (FpA), and after residue 14 in the B chain releasing fibrinopeptide B (FpB).(6) After FpA and FpB release, the fibrin chains are known simply as α, β, and γ, and exposed binding sites known respectively as knob A and knob B are active. Knob A consists of the α17-19 Gly-Pro-Arg residues, while knob B consists of β15-17 Gly-His-Arg residues.(20) The A and B knobs bind to complimentary “holes” (hole a and hole b respectively) in the peripheral D domains of nearby fibrin molecules; forming A:a and B:b interactions mediated primarily through electrostatic salt bridges and hydrogen bond interactions.(19, 21) These knob-hole interactions, allow for the formation of a half-staggered fibrin molecule arrangement in which the knobs in the E region of one molecule, bind to holes in two nearby molecules. (See Figure 1.3a) The half-staggered polymerization allows additional molecules to continuously bind to the unbound knobs at the end of the overlapping molecule. As this occurs, the chain extends longitudinally into a double-stranded fibrin polymer that has been termed a protofibril (Figure 1.3b).(22) Finally, the protofibrils bundle together laterally to form fibers. This process may be mediated by the B:b interactions, which are believed to form after the A:a interactions, or by the fibrin αC region.(23-26)
9
and note the nomenclature, the interface between two adjacent γ-nodules will be referred to as the γ-γ interface).(27) These interactions, serve to strengthen the protofibrils. It has been proposed that rather than γ-γ dimers, FXIIIa serves to cross-link latitudinally, (See Figure 1.6) but that is the minority view and seems to conflict with mechanical data.(28) Additionally, FXIIIa, can form bonds and between αC regions of several fibrin molecules, forming networks termed α polymers. (29, 30)
10
11 1.1.2 The Fibrin Fiber Structure
In order to understand the mechanical properties of fibrin fibers, one first must understand how the fibrin molecules are packed within the fibers. This is crucial because a fiber where protofibrils span the entire length of the fiber and are packed tightly in parallel across the width of the fiber has the potential to behave much differently than a fiber consisting of short protofibrils packed loosely within the fiber and held together by tethers such as the αC region.
12
13
diffraction peaks, one at 22.7nm and one at 18.4nm which they claimed agrees with the unit cell model of Yang(48). The Yang model is currently the generally accepted model for the packing of the fibrin fiber, however, it should be noted that the model does not account for the inherent flexibility of the fibrin molecule due to its crystalline basis.
In spite of this progress, there are still many unresolved questions about the fibrin structure including: 1) What is the length of the protofibrils in fibers? 2) Where does the water fit into the structure? 3) How structurally do larger molecules like FXIIIa fit into to fiber, while still allowing for lateral registry? 4) Where do the αC domains reside within the structure? 5) What is the native persistence length of a protofibril within the fiber 6) Where are the locations of the native contacts between protofibrils? 7) Some fibers do not readily exhibit banding in EM images, are these fibers structurally different? 8) If the fibers are crystalline, how is this broken at branch points?
14
molecule assembly and “profibrils” by end to end oligomerization.(33, 51) In this work, we have assumed the “standard” polymerization model with double stranded protofibrils, but given fibrin’s ability to form sheets, future models may need to include additional molecular interactions or polymerization morphologies not present in the standard model.
15 1.2 The Mechanical Properties of Fibrin
Because fibrin networks provide the structural support for blood clots that must withstand the shear rates of up to 100,000s-1in the vasculature, they perform an inherently mechanical and dynamical function.(1) The emergent mechanical properties of a fibrin network are a function of the mechanical properties of the components of each hierarchical level – protein monomer, protofibril, fiber, and network – and the architectural transitions between one level and the next – monomer-monomer interactions, lateral aggregation, and branching. In order to have an understanding of the emergent properties of the network, the mechanical properties and architecture of the lower levels of the heirarchy must be fully characterized.
The macroscopic mechanical properties of the highest rung in this structural hierarchy, fibrin gels, have been studied for decades going back to the pioneering work of John Ferry (52-54) and others (55-57). These studies showed that fibrin networks exhibit highly non-linear elasticity manifested in strain stiffening behavior (58-60) and negative normal stress (61). Macroscopic studies have also long established the importance of FXIIIa-induced ligation in stabilizing clots (5). Ligated clots show a much higher storage modulus, lower loss modulus and are more resistant to lysis by plasmin (5, 62). Additional rheological studies of whole clots and networks have focused on the correlation between clot structure (i.e., thickness of fibers, branch point density, and porosity) and viscoelastic dynamics and mechanics.(53, 54, 63)
16
fibrin fibers within a clot.(64) They reported that unligated fibrin fibers have an elastic modulus of 1-3MPa, while FXIIIa ligated fibers had an elastic modulus of 10-20MPa. AFM measurements on fibrin fibers suspended between microchannels indicated that fibrin fibers are among the most extensible in nature, with uncross-linked fibers being able to extend up to 3.3x their original length before failing, ligated fibers extending to 4.3x their original length before failure, and in both cases much of the extension was reversible.(65, 66) A recent paper by Liu et al. indicated that fully ligated (γ-γ and αC-αC) fibers are in fact less extensible and less elastic than unligated fibers, while partially ligated (only γ-γ cross-links) fibers are more extensible than unligated fibers.(67)
To understand the underlying mechanism behind these single fiber behaviors, several experiments have measured the mechanical properties of various parts of the fibrin molecule. Two groups have claimed to measure the stretching of the fibrinogen coiled-coil region. Brown et al. linked fibrinogen molecules end to end with FXIIIa to form fibrinogen oligomers. They reported a saw-tooth like unfolding pattern with an average force of 94pN and an average extension of 23nm. Lim et al. pulled on individual fibrinogen molecules, and measured a plateau in the force extension trace of 15nm at a force of 60pN and inferred that this indicated coiled coil unfolding. Additionally they pulled on fibrin protofibrils, showing a stepwise unfolding at forces around 1000pN, and a partial refolding of the protofibrils on the timescales of a few seconds.(68)
17
before failing.(70) This work was followed up in a beautiful study by Averett et al. showing that the A:a unbinding is actually a multi-step process, with a characteristic profile of four force peaks with two distinct populations of specific forces: 110 ± 34pN and 224 ± 31pN. The four force peaks, seem to correspond to three unfolding events, corresponding to extension of the fibrin γ-C domain by extensions of 11nm, 9nm, and 18nm, before the final unbinding of the A-knob at the fourth peak.(71, 72)
Finally, the non-ligation-mediated interactions between the αC regions were studied using laser tweezers.(73) The authors used three α-chain fragments in the study: the “αC region” corresponding to Aα221-610, the “αC connector” corresponding to Aα221-391, and the “αC domain” corresponding to Aα392-610. The authors found that αC region and αC region interact with each other with a higher frequency than other αC interaction and exhibit three distinct force thresholds of 19±3pN, 36± 2pN, and 48±2pN. The αC region and αC-domain interact with three distinct force thresholds of 17±5pN, 36± 2pN, and 49±2pN. The αC region and αC connector interact with each other less regularly and exhibit one force thresholds of 31±6pN. And finally the αC domain and αC connector exhibit one force threshold at 25± 3pN. Combining the results indicates that the αC domain part of the αC region can bind to other αC domains to withstand forces of up to 50pN, while the αC domain can interact with the αC connector with much lower specificity and at lower forces ~25pN.(73)
1.3 Mechanical Models for the Extension of Fibrin Fibers within a Network
18
alternative mechanism of cross-linking, and another which we proposed and is developed in more detail in Chapter 2, based upon the extension of the αC regions between sliding protofibrils. In this section, I will briefly describe each model, followed by a discussion of a few pros and cons of each.
Figure 1.5 Coiled-coil (CC) extension model: In the coiled-coil extension model, the fibrin monomer can be thought of as two springs fixed between rigid beads (See panel “C” for the schematic version). The coiled coil in the fibrin molecule act as two state springs that can either be unstretched (folded) or stretched (unfolded). The fiber is composed of many springs in series and parallel down and across the fiber. When force is applied to the fiber, the coils unfold in a zipper-like manner. Protofibrils are assumed to span the entire length of the fiber, and little shear between protofibrils is assumed.
19
that they cannot slide. In the model, the fibrin extension comes from a zipper-like unfolding of the coils as the fiber is stretched.
This model is discussed in some detail in Chapter 2, briefly, the CC model is attractive in that it can account for fiber strains of 100%, and it explains the lack loss of 23nm signal in SAXS measurements of fibrin networks unfolding. The 23nm signal is attributed to the coiled coil structure of the molecules in the fiber.(74) However, there are several concerns with the coiled-coil unfolding model. The expected forces required to unfold the coiled-coil seem too high to explain the stretching of the fibrin fiber (this is discussed in great detail in section 2.3.6). In addition, while extensions of 100% strain are impressive, it is well established now that fibrin fibers can reversibly recover from strains of over 180%, and the coiled coil cannot account for all of this extension.(66)
20
and intraprotofibril sliding of the fibrin molecules. Elastic recovery could occur for cross-linked fibers, but it is not clear how this model would account for un-cross-linked fibers. (Reprinted from Mosesson, M.W. “Cross-linked γ-Chains in fibrin fibrils bridge transversely between strands: yes” Journal of Thrombosis and Haemostasis, 2, 388-393. Used with Permission from John Wiley and Sons © 2004)
A second model for fibrin fiber extension was proposed by Mosesson in a discussion on the orientation of the γ cross-links between fibrin molecules within the fibrin.(32) In this proposal, the cross-links actually act transversely as seen in Figure 1.6. If the fiber was then stretched, and the A:a and B:b interactions were broken, the fiber would then be able to stretch up to 1.8 times its original length according to the authors.(32)
21
Figure 1.7: The αC extension model: This model is laid out in detail in Chapter 2. Briefly, the model considers the fibrin fiber as a series of stiff and soft springs in parallel and series down the fiber. The stiff springs represent the protofibrils consisting mainly of the coiled-coil, and the soft springs represent the αC regions linking the protofibrils. Stretching comes from sliding of the protofibrils.
22
To be complete, a hybrid model involving an α-helical to β-strand conversion of the coiled-coil region followed by an extension of the aC-region, followed by a partial unfolding of the γ-C domain was proposed by Guthold and Liu.(65, 67) While this model is more comprehensive than any of the other models as far as regions of the fibrin molecule involved, it is more abstract in nature, and not specific in details.
Thus, there are several models proposed to explain the mechanics of the fibrin fiber. Each model focuses on one part of the molecule (coiled-coil or αC region) or on a particular aspect of polymerization (transverse ligation mode) without accounting for other regions of the fibrin molecule. This, in part, is due to the fact that the structure of the αC domain, and the stability of the γ-C domains, and even the structure and topology of interactions within the fibrin fiber itself all have some level of uncertainty associated with them. In order to construct a full scale model of the fibrin fiber, these issues must be addressed. In chapter 4 of this paper we extend our original αC model into the fuller SLαCK model based on the results of our molecular dynamics simulations. We believe that the SLαCK model contains enough molecular detail to account for the full range of single fiber properties.
23
model treated the fiber as a loosely bundled network of semi-flexible protofibrils linked by flexible cross-links (corresponding the the αC domains).(82) All of these models treated the fiber as either a rigid or semi-flexible polymer between network branch points, but were not able to originate the network behavior on the molecular level.
A molecular level model was employed by Brown et al. in their paper on fibrin networks under tensile stress.(83) The model implemented the CC stretching model within a model for biomacromolecular networks containing domains that unfold under force.(84) The model is elegant and generates fits that account for fibrin network behavior; however as discussed in 2.3.6 Analysis of the Coiled-Coil (CC) unfolding model, the molecular parameters needed to fit the network level behavior are non-physical. In chapter 5, we present a model for fibrin network stretching based our αC stretching model for the single fiber. While the model is simple in form, it was able to predict the network response to the strain stiffening of individual fibers. At the network level, the CC model predicts the same strain stiffening behavior as the αC model; however the origins of the behavior are different, and the expected force levels differ by at least an order of magnitude.(85)
1.4 Significance and Goals of this project
24
fibrin(ogen) in the blood coagulation cascade are now generally understood and accepted.(6) In addition, a series of measurements on the network, fiber, and molecular level have begun characterizing the mechanical properties of fibrin.(71, 83, 89) In spite of these advances, the complexity of the polymerization process and the hierarchical design of fibrin have proved to be difficult hurdles in the development of a complete multi-scale mechanical model of the fibrin network.
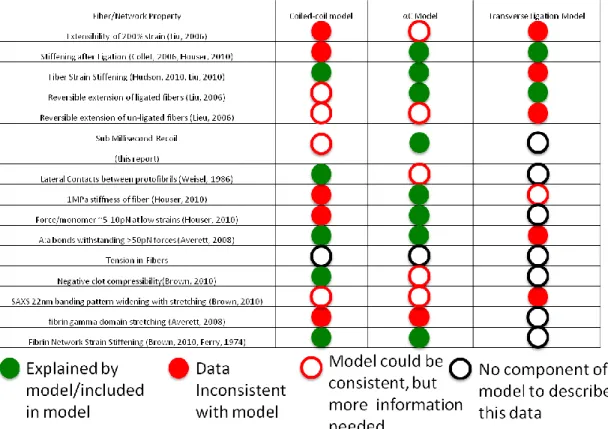
Table 1.1 A comparison of the potential models for fibrin mechanical properties: A green circle represents a molecular, fiber level, or network level property that is explained by the model, a red filled circle represents a property that is not explained by the model, a red open circle represents a property that may be explained by the model but needs more investigation and a black open circle represents a property not addressed by the model.
25
implications stemming from the mechanical properties of the molecule. The results of these projects will serve as a template to construct a model of fibrin mechanics and dynamics that bridges all levels of the fibrin hierarchy. In so doing, we will be able to provide a complete view of the mechanical role of fibrin in the process of Hemostasis.
26
Chapter 2. Evidence that the αC Region is the Origin of the Low Modulus, High Extensibility, and Strain Stiffening in Fibrin fibers
2.1 An Introduction to Fibrin Fiber Mechanics
We recently reported that individual fibrin fibers exhibit extraordinary extensibility with an elastic regime in excess of a strain of 1.0, and strains at breaking of up to 3.0 (strain is defined here as fiber extension divided by original fiber length. A strain of 1.0 is a doubling of the fiber length) (65, 66). Several important and related questions emerge from that work: What are the full force extension characteristics of the fibrin fiber? Is fibrin an elastomeric fiber? What are the molecular origins of extensibility? How does FXIIIa ligation affect stiffness and extensibility? Along with very high extensibility, fibrin has a relatively low modulus (1-10 MPa range) and exhibits strain stiffening behavior above strains of 100% as we have recently reported (90) and as Liu et al. showed in their recent evaluation of the viscoelastic properties of fibrin fibers (91). These properties place fibrin squarely in the category of biomaterials such as elastin, resilin and spider silk (92, 93). This result is somewhat surprising given fibrin is predominantly a structured globular protein which polymerizes into ordered semi-crystalline arrangements in fibers (44). In contrast, elastomeric protein structures consist primarily of disordered networks of natively unfolded polypeptides with randomly distributed covalent crosslinks (94).
28
indicate a doubling in stiffness in the fiber after ligation. Based on the elastomeric nature of the fibrin fiber, along with previous measurements indicating that fibrin elasticity is tied to the length of the αC connector region, we present a mechanical model (henceforth called the αC model) of the fibrin fiber consisting of an ordered network of worm-like chain segments.(95) The success of this model in fitting our force vs. extension data suggests that fibrin’s elasticity is entropic in origin, and that the observed stiffness and extensibility have their origins in unstructured regions of the protein.
2.2 Methods
For our measurements, we used an Explorer atomic force microscope (Explorer, Veeco Instruments, Woodbury, NY) resting on the manipulation stage of the optical epifluorescence (described in the next section) microscope enabling simultaneous AFM manipulation and optical data acquisition. For brief introductions to fluorescence microscopy and atomic force microscopy, the reader is referred to Appendices B and C respectively.
2.2.1 Structured Surface Preparation
29
Figure 2.1 Set up for single fiber and network stretching experiments. Suspended fibrin fibers are labeled with fluorescent beads and then stretched with the AFM tip Movies of the stretching are taken from below with epifluorescence imaging.
2.2.2 Fibrinogen Preparation
30
plasma fibrinogen in nearly all aspects. We assessed purity and homogeneity of this material through polyacrylamide gel electrophoresis (SDS-PAGE) and immunoblot analyses. Fibrinogen function was assessed through thrombin-catalyzed fibrinopeptide release monitored by High Performance Liquid Chromatography (HPLC), polymerization monitored by turbidity, and FXIII-catalyzed ligation monitored by SDS-PAGE, and blot analysis as described.
To form unligated fibrin fibers, fibrinogen was diluted in HBS (20 mM HEPES, 150 mM NaCl, pH 7.4) to 0.04 mg/ml and deposited onto the SS. Human thrombin (Enzyme Research Laboratories; final concentration 1 NIH U/ml in HBS with 10 mM CaCl2) was added to the surface at the same volume as the fibrinogen (usually 8-10μL) and pipetted up and down to mix. The sample was incubated at 37oC for two hours in a water-saturated atmosphere, rinsed and stored in HBS. Fibers were fluorescently labeled by adding a 1/10,000 suspension of 24 nm volume-labeled red fluorescent carboxyl-coated microspheres (Invitrogen- Molecular Probes) in Ca-free HBS to the SS, incubated 5minutes and washed with buffer. To form fibers that were ligated during polymerization, we mixed FXIII (Enzyme Research Laboratories; final concentration: 0.5 mg/ml) with thrombin at 1 NIH U/mL in HBS with 10mM CaCl2 to activate it into its active FXIIIa form and immediately added it to the SS containing 0.04 mg/mL fibrinogen. The samples were incubated for two hours at 37oC and then gently rinsed via buffer substitution. .
2.2.3 Optical Microscopy
31
200, Southern Micro Instruments, Atlanta, GA), and imaged using a rhodamine HQ filter set (Chroma Technology, Rockingham, VT) and a 1.3 or 1.4 na 100X oil objective. Images were recorded using a high speed Cooke PCO 1600 camera with C-link and recorded with CamWare (Cooke Corp., Romulus, MI). All single fiber and network data was acquired as described previously (65, 66). For a full discussion of illumination techniques, see appendix B.
2.2.4 AFM
32
AFM tip (< 1 micron from end)). For the stress vs. strain data depicted in Figure C.2 and Figure 2.2, force data was converted to stress by taking the calibrated force data and dividing by cross sectional area of the fibrin fiber as determined by AFM imaging (AFM measured fiber diameter which was converted to area assuming circular cross section). This was accomplished by imaging the fibrin fiber on the ridge immediately adjacent to the portion of the fiber suspended over the channel. Strain was determined by taking the extension (change in length, L) of the fiber segments and dividing by the original length, L0 (Strain : = L/ L0). . The twisting mode optical sensitivity in deflection units can be determined using the specific geometry (length, tip length) of the cantilever:
t B T R L
l
L
S
S
3
2
(2.1)Force can then be obtained using equations B.2 and B.4
R L L S R L k F
( ) (2.2)
The lateral cantilever spring constant (kL)was calculated from cantilever/geometry and SiN materials constants, as described in Equation C.7. Figure 2.1 depicts a diagram of the setup.
2.2.5 In-situ measurement of fiber Stiffening
33
34 2.3 Results & Discussion
2.3.1 Single Fiber Stress vs. Strain
35
Figure 2.2 Stress vs. Strain plots of individual fibrin fibers. (A-D) AFM manipulation of a fibrin fiber suspended over micro patterned channel. The AFM tip (not visible) was brought in contact with a suspended fiber and stretched (B-C) to the point of failure (D). Scale bar = 10 µm. (E) Representative stress vs. strain data of individual fibers with and without FXIII ligation. Both fibers show relatively linear behavior up to strain just above 1.0 followed by significant stiffening. (F) Tangent modulus illustrating the strain dependent stiffness. These traces were found by numerically differentiating the traces in (E).
Figure 2.3 Average tangent modulus at discrete strains for ligated (N=14) and un-ligated (N=14) fibers. At 0.25 strain, the ligated fibers have an elastic modulus of 2.1 ± 0.3 MPa while the un-ligated have a modulus of 1.1 ± 0.2 MPa (P < 0.003). The average modulus rises to 9.8 ± 1.2 MPa for ligated and 6.9 ± 1.3 MPa for un-ligated fibers (P < 0.05).
2.3.2 In situ measurements
36
is equivalent to the suspended fiber diameter, and that the diameter is constant over the suspended length. A comparison of the full stress vs. strain behavior from one experiment to another also requires comparing data from different AFM tips and force calibrations which adds additional uncertainties.
37
Figure 2.4 Left: Western blot of fibrin showing , and bands without FXIIIa (A) and , and dimer following ligation with FXIIIa (B). Right: In-situ fiber stiffness measurements. Fiber stiffness before (blue) and after (red) FXIII ligation.
2.3.3 The αC Stretching Model
38
39
40
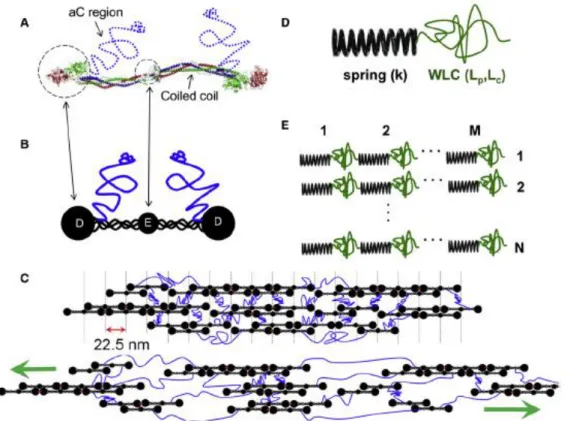
Figure 2.5C depicts fibrin fiber structure in cartoon form, and a candidate model for fibrin extension. The model depicts protofibrils laterally aggregated through C interactions. The C domains (blue) accommodate the majority of the fiber strain and are represented in the mechanical model (Figure 2.5D&E) by the WLC. As the cartoon of the strain fiber indicates, the aC regions can accommodate tensile strain and act as spring in series within this proposed model despite acting as lateral tethers between protofibrils. As the fiber is strained, these tethers align along the fiber axis and act as series connections between the stiffer protofibrils. The distribution of protofibril lengths depicted within this cartoon is consistent with published studies of protofibril lengths.(40, 99)
A WLC model has successfully described the force-extension behavior of DNA, intrinsically unstructured polypeptides, and force-unfolded proteins (98, 100-104). The WLC is an idealized non-self-interacting flexible chain undergoing thermal fluctuations along its contour. The force of extension of the WLC is mediated entirely by entropic elasticity. Though this model has primarily been used to describe single molecule force spectroscopy data, we apply it here, in scaled form, to a full fibrin fiber. The form of the force vs. extension for a WLC in the Marko-Siggia form (104) is as follows.
c c p B l l l l l T k l F 4 1 1 4 1 ) ( 2 (2.3)
Where, l is extension (L- L0), kB is the Boltzmann constant, T is temperature, lp
is persistence length, and lc is the contour length. We note our use of l in Eqn. 2.3,
41
structured portions of the monomer; the unstructured portion only contributes appreciable length to the fiber as it extends. In reality, the unstructured domains may contribute a small percentage to the unstretched fiber length, but we assume this contribution is negligible.
We model the force-extension behavior of the fundamental mechanical unit (Fig D) as a WLC (Eqn (1)). The whole fibrin fiber is modeled by M identical fundamental units in series and N of these chains in parallel (Figure 2.5E). A chain with M, identical, WLCs linked in series behaves as a WLC with a contour length equal to M times the contour length of the primitive unit:
Lc= Mlc (2.4)
Substituting Eqn. 2.4 into Eqn. 2.3, yields the force extension relation for a series of MWLC’s c c p B M l M L l M L l T k L F * 4 1 * 1 4 1 ) ( 2 1 , (2.5)
where L is the extension of the entire fiber. The force of N WLC’s in parallel is N times the force of the individual WLCs.
0 2 0 1 , , / ) * ( 4 1 / ) * ( 1 4 1 * * ) ( L l M L l M l T k N F N F c c p B M N M
(2.6)
where here we normalize the extension, L, and contour length, M*lc , to the original
fiber segment length, Lo, to produced force as a function of strain (= L/L0). Because of
the ordered arrangement of monomers within our fibrin fiber model, the force extension relation for the full fiber (Eqn. 2.6) is a scaled version of the single WLC relation with the persistence length lp and contour length lc replaced with lp/N and Mlcrespectively.
42
parameters obtained are the scaled persistence length (lp/N) and the scaled contour length (Mlc/ L0). Both parameters provide insight into the molecular origins of fibrin’s strain accommodation. To tease out the molecular parameters lpand lc, an estimate is made for
43
Figure 2.6 Force vs. Strain data (black circles) for un-ligated fiber (above) and ligated fiber below (5% of data points shown for clarity). The red curve is the fit of Eqn 2.6.
44
could easily account for this additional length. An unfolded portion of the D region of the protein could also account for this additional length. Unfolding and completely extending both coiled coil regions leads to 46 nm extra length (75) accounting for less than half of the extension. We found no statistically significant difference between FXIIIa ligated and un-ligated fibers in either the persistence length (p > 0.20) or contour length (p > 0.05) parameters.
2.3.4 Enthalpic backbone stiffness of the fibrin fiber
The WLC model fitting to the force extension data described above (Eqn. 2.6) and Figure 2.6) takes into account entropic elasticity only, ignoring the effects arising from enthalpic effects (stretching of chemical or physical bonds). Following Wang et. al. (107) we can add enthalpic contributions to the extension of a WLC, which in the case of fibrin could result from stretching of the coiled coil or other structured regions. We modify the WLC by making the following substitution for Eqn 2.3:
0 K
F l
l l
l
c c
(2.7)
45 0 2 0 4 1 1 4 1 K F l l K F l l l T k F c c p B (2.8)
46
Figure 2.7 Several representative experimentally obtained force curves in addition to the two in the main text. These where fit using the WLC model. The green lines show the fitted values, the blue points are the experimentally observed data for un-ligated fibrin fibers, and the red points are the experimentally observed data for fibers ligated by FXIII.
2.3.5 Does the αC connector region mediate fibrin’s initial extensibility?
47
most, as compared to the whole fiber which is tens of microns long - the inter-protofibril connections must be crucial to supporting tensile forces. The C regions are therefore likely to play a role as “springs in series” with the stiffer protofibrils (See Figure 2.5E). This view is consistent with our WLC in series model for fibrin extension and is generally consistent with the observed low modulus and high extensibility. However, this model strongly argues that the series C connections give rise to a significant fraction of the total extension of the fiber.
48
the contour length fitting parameter, though we did observe stiffening of fibrin fibers with FXIIIa ligation. This could be due to incomplete ligation of the C chains by FXIIIa in our reaction. Recent work by Liu et. al. showed that full C ligation reduces the extensibility of the fiber, reducing the contour length (91). Further refinement in the force vs. extension data as well as the WLC-in-series model may be required to tease out subtle changes in the effective contour length of the C upon FXIIIa ligation.
2.3.6 Analysis of the Coiled-Coil (CC) unfolding model
49
gamma-gamma contacts within the protofibrils with the coiled-coils acting as “springs in series”. However, the coiled-coil mediated extensibility model has difficulty accounting for the full stress-strain behavior of the fibrin fiber presented here and in other publications (90, 91).
We will now apply the two -state model recently proposed by Brown et al. to our single fiber data. In the model, the coiled-coils can be in two states: (a) the folded state where their stress-strain behavior is linear, and (b) the unfolded state where the coil is unfolded and behaves like a worm-like chain at high extensions (The Marko-Siggia worm-like chain also includes a linear region at low extensions which is not part of this two state model). (111) This model for individual fiber elasticity was then used in the 8-chain polymer physics model to represent the behavior of a fibrin network under tensile deformation. (84) The 8-chain model was fit to the network data using thermodynamic properties (the alpha-helix unfolding energy barrier and the alpha-helix unfolded extension length) as fitting parameters. While the authors were able to use the coiled-coil single fiber model to fit their network data, the single fiber force extension model embedded within the network model was not compared to single fiber force extension data.
The force curve given in the Brown paper is defined as the following (74):
F l TN k L L F n EA F F n L x p B f u u f f 2 1 ) ( 1 ) (
(2.9)50
T
k
N
z
F
G
n
B B fexp
1
1
(2.10) f u nn 1 (2.11)
and x is the fiber extension, F is the force exerted on the fiber, N is the number of monomers/fiber cross-section, Lu is the unfolded coil contour length, Lf is the folded coil length, Δπ is the unfolding energy barrier, Δz is the distance between the folded and unfolded lengths and lp is the WLC persistence length.
51
Figure 2.8 Single fiber force strain plot for coiled-coil model. The plot represents the extension-force curve arising from the assumptions and fitting parameters (Δπ = 16.5kT and Δz=19.2nm) from the coil-coil network fit .
52
low strain modulus (a few MPa), but in these cases low stiffness is attributed to the unstructured elastomeric protein matrix connected in series with the stiffer coiled coils. Thus, experimental, theoretical, and computational studies yield elastic modulus values for coiled-coil that are 3-4 orders of magnitude higher than that for the overall fiber measured in this study and others. The volume fraction of protein material within the fiber is one possible explanation for the discrepancy. However, estimates put the water fraction within the fiber at 70% which would provide a factor of 3 or 4 to work with, well short of the factor of 1000 to 10,000 needed to reconcile fibrin fiber stiffness and expected coil-coil stiffness.
53
not converge. Plots A and B in Figure 2.9 were performed using the starting parameters GB= 5kT; Δz=3nm; Lc/Lo=2.5; Lp = 0.8nm, while Plot C was formed using : ΔGB = 0.3kT; Δz =0.3nm; Lc/Lo =2.5; Lp = 0.2nm.
Plot A in Figure 2.9 fits the data fairly well (R2=0.99), but it assumes a coil-coiled modulus of 2 MPa, much lower than the measured modulus of a coiled coil. In addition, some of the fitting parameters do not make physical sense: ΔGB = 4.1kT; Δz =0.08nm; Lc/Lo =3.66; Lp = 0.008nm. While the ΔGB value can be reconciled with theoretical coiled-coil unfolding barriers, Δz =0.08nm and Lp = 0.008nm do not make sense physically. (121) The known Lp for unraveled or natively unstructured proteins is 0.2-0.9nm, (98, 100, 101) two orders of magnitude higher than the fits to our model, while the same experiments and molecular dynamics simulations show that coils unfold at 3-15% strain, (103, 112-114) the fitting parameter Δz =0.08 corresponds to 0.1% strain, much lower than the known values.
54
Figure 2.9 Fitting Single Fiber force vs. extension data with the Coiled-coil model. Plot A shows data assuming a coiled-coil modulus of 2MPa while plots B and C assume a coil modulus of 0.8GPa.
The SAXS data presented in the Brown et al. study are compelling, and do suggest coiled-coil unfolding may be occurring, however the data may also be explained by protofibril sliding within the fiber, causing the protofibrils to lose registry and thereby widen the 23nm signal. Interestingly the authors note that the fact the peak stays at 23nm indicates that a portion of the molecules stay folded giving rise to the 23nm signal, even though the width of the signal has widened.(74) It is not obvious how FXIII ligation would affect this signal. There are known ligation sites both in the C domains and -domains of the fibrin monomer. (30, 109) - ligation has been shown longitudinally within protofibrils, but to our knowledge, not laterally between protofibrils. C-C and
55 2.3.7 Force per Monomer
AFM force spectroscopy studies over the past decade have established the range of forces required to unfold secondary and tertiary protein structure. (98, 101, 122). For protein unfolding to occur within strained fibrin fibers, the resolved forces (per monomer) would have to exceed these thresholds. To address this issue, we present estimates of force per monomer at all strains of fibrin fiber.
56
of monomers in parallel were calculated as Nmol=0.2*(Dfib/Dmol)2 (This makes the effective diameter per monomer, Dmoleff =10nm). This second model assumes that the entire monomer as a space filling cylinder into which no water can penetrate. In actuality, the fibrin molecule is dumbbell shaped with 4.5nm diameter end domains, 2nm diameter coiled-coils, and a 4nm central domain (12). Based on these dimensions, we estimate that nearly 50% of the volume occupied by a fibrin protofibril consists of water. Thus, although most of the fiber is occupied by water, the majority of this water can fit within close-packed monomers. One can estimate an effective monomer diameter required to account for the other 20-30% of water occupying the fiber structure by assuming the cross-sectional area of a protofibril is roughly an ellipse, and estimating the effective area of the ellipse required to allow for 80% water volume. This ratio of areas can then be converted into an (upper end) effective monomer diameter by assuming that each monomer within the protofibril has the cross-sectional area of a circle. We estimate that an effective fibrin monomer diameter of 6.9 nm will account for the rest of the space needed for water within the fiber. Thus our third model is an “intermediate packing” model where the number of monomers in parallel is calculated by Nmol= (Dfib/Dmoleff)2 , where Dmoleff = 6.9 nm. In each model, the force per monomer can then be calculated as Ffib/Nmol.
57
75). (See Figure 2.11) Note that even in the loose-packed case, these forces (the lower end of the range) are not reached until the fiber is strained beyond 0.50. For the intermediate and close packed models, this threshold is reached at strains of 1.0 and beyond. For the intermediate packing case, the fiber strain at which the 100pN coiled-coil unfolding threshold is reached is 113±23% for ligated fibers and 108±15% for unligated fibers. At 50% fiber strain, in the linear fiber regime, the average FPM value was 27 ± 8 pN for ligated fibers and 18 ± 4 pN for unligated fibers, suggesting that coiled-coil unfolding is not a prominent process in the linear strain regime. While coils have been seen to unfold at forces as low as 50pN, on average it seems that most fibers do not have much coil unfolding until after 100% strain.
Figure 2.10 Force per molecule (FPM) plots for one fiber with three different packing assumptions. Frame [A] corresponds to a close-packed model fiber (Dmol = 4.5 nm), frame [B] corresponds to the loose-packed model (Dmoleff = 10nm), and frame [C] corresponds to the effectively close-packed model (Dmoleff = 6.9nm).
58
One counter-argument to this analysis that could be made is for concentrated forces within the fiber. Concentrated forces will make the FPM much higher locally than the average, inducing unfolding and then propagating across the fiber in a zipper like manner. While this may be occurring, there is no known structural data to support this model. We do point out that even if fibrin fiber diameter shrinking is occurring as indicated by other studies(74) , the number of monomers connected in parallel, down the fiber will remain constant and thus FPM=Ffib/Nmol should remain the same at all points along the fiber. Additionally, some have claimed that the strain rates of the single molecule work were different than that in our whole fiber measurements, leading to inflated unfolding forces, however, we note that in our measurements the local strain rate – which is known to affect measured unfolding forces - is comparable to typical single molecule force spectroscopy measurements. (124)
Figure 2.11 Force per monomer as a function of fiber strain: Assuming the loose-packed model, the force per monomer can be calculated over the entire fiber extension. The red line indicates the experimentally observed critical force for coiled-coil unfolding.(75)
2.3.8 Fibrin as Elastomeric Protein