Contents
Investment accounts 1
Learning objectives 1
NaviPlan planning stages 1
Capture lifestyle assets 3
Lifestyle Asset Details dialog box – Details section 4
Property Taxes details 5
Return Rates details Return Rates details 6
Capture liabilities 7
Liability Details dialog box – Details section 7
Calculation Options details 9
Other Options tab 10
Debt Modification tab 11
Liability Schedule report 12
Verify data using reports 13
Net Worth reports 13
Multi-Year Net Worth Summary report 14
Net Worth Summary: End of Year report 15
Asset Summary report 16
Examine the net worth and cash flow implications of selling a home 17
Enter sale information 17
Direct After Tax Proceeds To list 18
Account Details dialog box 19
Asset Class Weightings list 24
Return Rates tab 24
Beneficiaries tab 25
Account Fee Setup tab 27
Model savings to investment accounts 28
Enter a savings strategy 28
Using keywords for start and end dates 29
Using keywords to maximize contributions 30
Model a fixed annuity 31
Annuities page 31
Annuity types 32
Annuity Details dialog box 33
Analyze clients’ investment accounts using reports 34
Reports 34
Account Summary report 35
Multi-Year Net Worth Summary report 36
Single Asset Summary report 36
NaviPlan Premium resources 38
Conclusion 39
Investment accounts
Investment accounts
This module assumes that you have completed theStart planninglearning guide and that you already know how to create a client file. This guide is based on a Level 2 Plan, but you can also enter investment accounts in Asset Allocation Assessments and in Level 1 Plans. This guide was created using the Average Tax method.
This guide will show you how to capture your clients’ investment accounts and how to verify the data that was entered using reports.
Learning objectives
Upon successful completion of this module, you will be able to l Capture lifestyle assets.
l Capture liabilities.
l Verify data using reports.
l Examine the net worth and cash flow implications of selling a home. l Model investment accounts with holdings.
l Classify holdings to establish a rate of return. l Model savings to investment accounts.
l Analyze your clients’ investment accounts using related reports. Note:Each learning objective is identified with a puzzle piece icon.
NaviPlan planning stages
The following diagram shows the planning stages you can follow in NaviPlan® Select, from creating a client file to presenting results. The learning objectives in this module are part of the following stage:Enter financial data.
Figure 1: Net Worth Detailed: End of Year report (Reports menu – Net Worth – Detailed – Net Worth Detailed: End of Year)
Note:This learning guide is based on using the Ibbotson Asset Allocation option, using actual Ibbotson return rates with NaviPlan calculations.
Capture lifestyle assets
Capture lifestyle assets
On theEnter Financial Datasection –Net Worthcategory – Assets/Liabilitiespage, you can enter the clients’ lifestyle assets and income-producing real estate assets. Under
Lifestyle Assets, enter assets such as residences, vehicles, and other personal property. UnderReal Estate, only enter real estate assets that produce income. When using the Detailed Tax method and theDetailed Cash Flowmodule, you can also enter business entities.
You can enter summary data on theAssets/Liabilitiespage or you can click theDetails
button to enter more detailed data, such as property taxes, sale information, and return rates.
Figure 2: Enter Financial Data section – Net Worth category – Assets/Liabilities page – Details button – Lifestyle Asset Details dialog box
Lifestyle Asset Details dialog box – Details section
Figure 3: Lifestyle Asset Details dialog box – Details section (showing the Purchase Date field)
Key points
l To ensure that assets are reflected as of the plan date, use a purchase date prior to the current plan year. The default purchase date is December 31 of the previous year.
l Entering a current/future year purchase date will result in a current/future year cash outflow.
Capture lifestyle assets
Property Taxes details
Figure 4: Lifestyle Asset Details dialog box – Property Taxes details
Key points
l Property tax details only appear in theLifestyle Asset Detailsdialog box when
Residenceis selected as the asset type.
l Property taxes are included in cash outflows and are calculated as a separate expense.
l If the asset is linked to a liability, theTax Deductiblecheck box is selected by default.
Return Rates details Return Rates details
Figure 5: Lifestyle Asset Details dialog box – Return Rates details
Key points
l To use a growth rate for this asset other than the default return rate of 2%, select theOverridecheck box, and then enter return rates.
l To show depreciation in value, enter negative growth rates using a minus sign before the value, e.g., vehicle.
l If you selected theClient(s) are already retiredcheck box when you created the plan, the row ofPre-Retirementfields underReturn Rateswill be hidden.
To go to the next or previous lifestyle asset in the list
l ClickNext EntryorPrevious Entry.
Capture liabilities
Capture liabilities
On theAssets/Liabilitiespage underLiabilities, you can enter both secured and non-secured liabilities. For non-secured liabilities, such as mortgages, you can link the liability to an asset, such as a home. When the linked asset is sold, NaviPlan automatically uses the proceeds of the asset sale to pay off the liability.
You can enter summary data on theAssets/Liabilitiespage. ClickingDetailsopens the
Liability Detailsdialog box where you can enter liability details, such as payment, balance, and amortization.
Figure 6: Enter Financial Data section – Net Worth category – Assets/Liabilities page – Details button – Liability Details dialog box
The clients’ mortgage payments are $2700/month; remaining amortization is 15 years.
Liability Details dialog box – Details section
Figure 7: Liability Details dialog box – Details section (showing the Link to Asset list)
Key points
l UnderDetails, you can enter the loan details, such as payment type, interest rate, and payment frequency.
l To have NaviPlan automatically pay off the loan when the asset is sold, link the liability to an asset by selecting the asset underLink to Asset.
l An asset can be linked to more than one liability, but a liability can only be linked to one asset.
l When using the Detailed Tax method, you can link a liability to a life insurance policy to model a life insurance policy loan.
Capture liabilities
Calculation Options details
Figure 8: Liability Details dialog box – Calculation Options details
Key points
l UnderCalculation Options, you can solve unknown liability variables, such as payment, balance, or amortization.
l From theField to Calculatelist, you can select the field you want to calculate. For example, you can use it when clients know their monthly payment amount and the original loan value but do not know the amortization period. l TheBalanceand thePaymentamounts will appear in theCash FlowandNet
Worthreports.
To determine the missing variable
1. From theField to Calculatelist, select the variable you want to solve.
2. Enter the other information. The missing variable field(s) update automatically.
For example, to determine the amortization period, from theField to Calculatelist, selectAmortization, and then enter the loan balance and payment amounts. The fields underRemaining Amortizationwill update automatically.
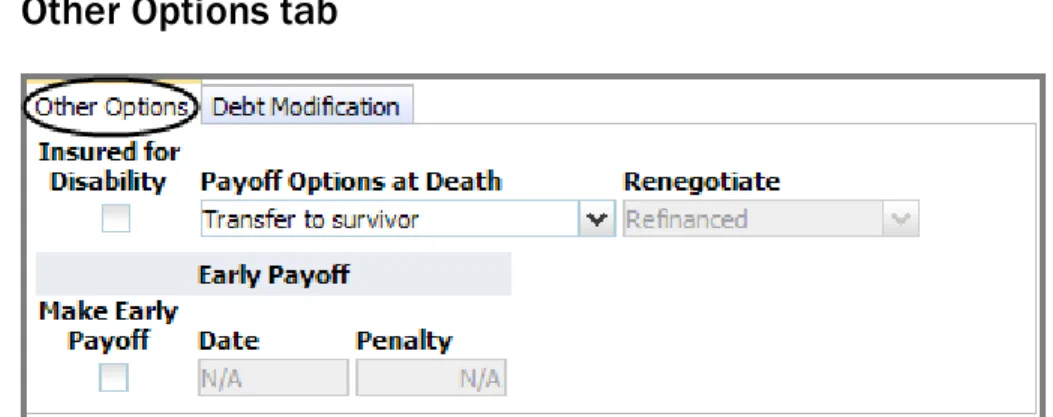
Other Options tab
Figure 9: Liability Details dialog box – Other Options tab
Key points
l When modeling a future liability (a liability with a loan date after January 1 of the plan year), you can use theRenegotiatelist to model refinancing or
consolidation of existing loans.
o Bring into cash flow– The liability principal is added to cash flow to offset
the purchase of an asset. The proceeds appear in the cash flow reports for the year in which the liability is established.
o Refinanced– The liability principal does not enter into cash flow. Use this
option when the loan does not offset the purchase of an asset, for example, a loan for wedding expenses.
l UnderEarly Payoff, you can enter penalties applied for early repayment of loans.
Note:TheOther Optionstab is not available in Level 1 Plans.
Capture liabilities
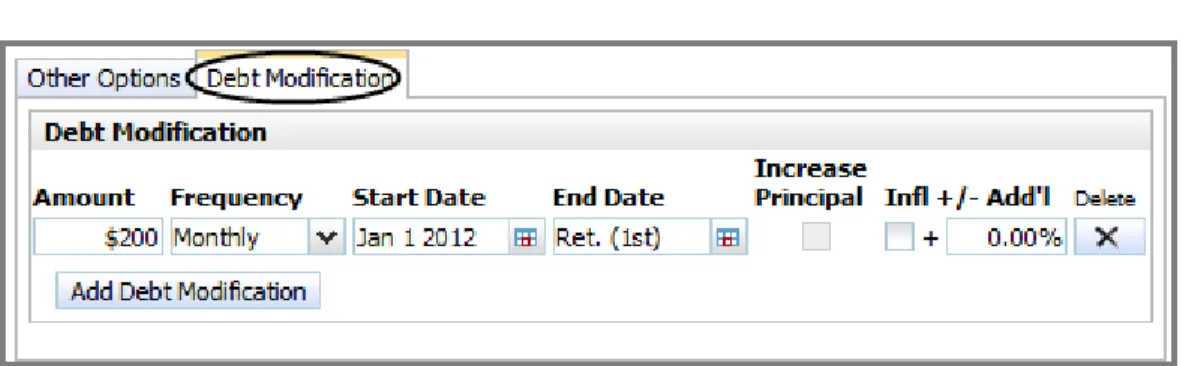
Debt Modification tab
Figure 10: Liability Details dialog box – Debt Modification tab
Key points
l On this tab, you can create debt modification strategies that allow you to increase or pay down principal on a liability in addition to regular payments modeled underDetailsin theLiability Detailsdialog box.
l Some examples of debt modification strategies you can enter include
o Decreasing debt when clients receive a bonus, inheritance, or income tax
refund.
o Increasing debt when clients decide to make a major purchase after
receiving a credit limit increase on a credit card or line of credit. Note:TheDebt Modificationtab is not available in Level 1 Plans.
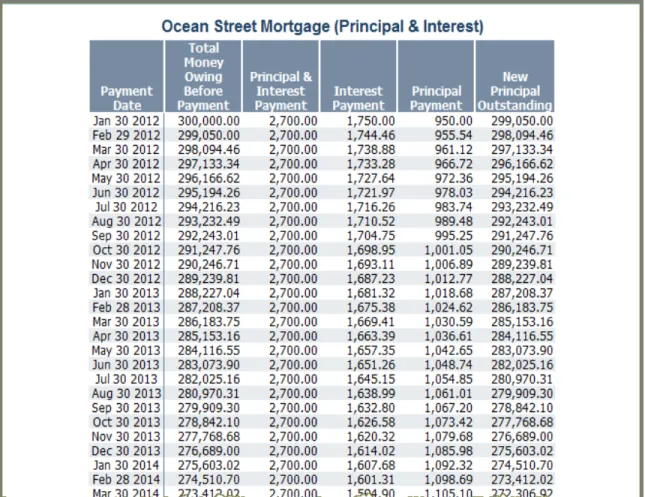
Liability Schedule report
Clicking theReportbutton next to a liability on theAssets/Liabilitiespage generates theLiability Schedulereport.
Figure 11: Liability Schedule report (Enter Financial Data section – Net Worth category – Assets/Liabilities page – Report button beside applicable liability)
Verify data using reports
Verify data using reports
Once your clients’ assets and liabilities have been entered, you can verify the data and analyze your clients’ net worth position using related reports.
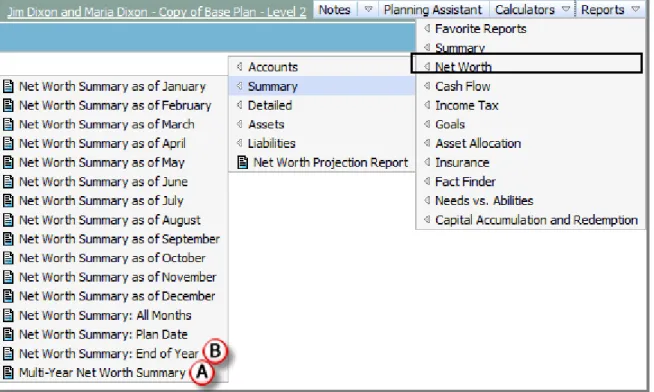
Net Worth reports
There are many NaviPlan reports related to net worth.
Figure 12: Reports menu – Net Worth – Summary (showing list of available reports)
In the next few pages, we will examine the following reports:
A. Multi-Year Net Worth Summaryreport
Multi-Year Net Worth Summary report
Figure 13: Multi-Year Net Worth Summary report (Reports menu – Net Worth – Summary – Multi-Year Net Worth Summary)
Key points
l This report displays the clients’ projected end-of-year net worth values for assets and liabilities over time.
l To reconcile net worth inaccuracies, this report can help you to identify
whether the inaccuracy occurs in all years and, if not, help you to identify the year or years which may be affected.
l Look for asset or liability values that are smaller or larger than anticipated.
Verify data using reports
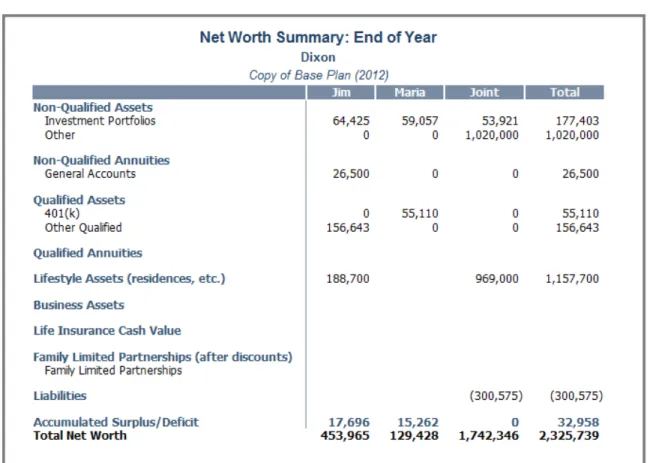
Net Worth Summary: End of Year report
Figure 14: – Net Worth Summary: End of Year report (Reports menu – Net Worth – Summary – Net Worth Summary: End of Year)
Key points
l This report will give you the big picture of the clients’ net worth for a year. l You can change the report year if you wish, before generating the report. l You can get more detailed information about specific transactions occurring
on the asset or liability, such as buys or interest payments, by generating the
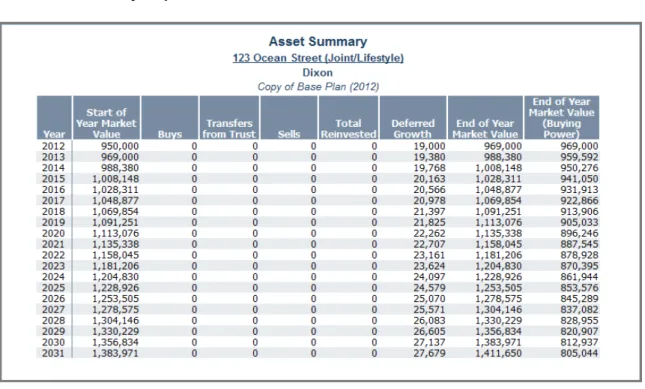
Asset Summary report
Figure 15: Asset Summary report (Reports menu – Net Worth – Assets – Single Asset Summary)
Key points
l This report isolates the annual transactions occurring for an asset, such as buys, transfers, and sells, that you select before generating the report.
l To obtain a monthly breakdown of transactions for an asset, you can generate theSingle Asset Detailsreport.
Examine the net worth and cash flow implications of selling a home
Examine the net worth and cash flow
implications of selling a home
Your clients are planning to sell their home and want to know how this sale will affect their net worth and cash flow. You will need the following information:
l The probable sale date.
l Whether the liability is going to be paid off. l What will happen to the remaining proceeds.
Sale details for a lifestyle asset are entered in theLifestyle Asset Detailsdialog box underSale Information.
Direct After Tax Proceeds To list
Figure 17: Lifestyle Asset Details dialog box – Sale Information details (showing Direct After Tax Proceeds To list)
Key points
l From theDirect After Tax Proceeds Tolist, you can direct the proceeds of the sale of the lifestyle asset to an investment account.
l The proceeds of the sale can be directed to
o The clients’ cash flow.
o An existing non-qualified asset.
o A new system-generated non-qualified asset (titledProceeds of <name of
lifestyle asset>).
l If proceeds are directed to an existing qualified account or a new non-qualified account, clicking theAccount Detailsbutton opens theAccount Detailsdialog box where you can modify or review the account details. l When using the Detailed Tax method, you can edit the exclusion amount for
the asset.
The clients plan to sell their house in 2017. They would like the proceeds directed to a new non-qualified account.
Examine the net worth and cash flow implications of selling a home
Account Details dialog box
Figure 18: Account Details dialog box (showing newly created asset from sale of house)
Key points
l If the proceeds of the asset sale are directed to a new non-qualified account, theAccount Detailsdialog box opens automatically where you can enter the account details.
l Clicking theAccount Detailsbutton in theLifestyle Asset Detailsdialog box after an account has been selected also opens theAccount Detailsdialog box. l Modify the new or existing account details as required.
l All non-qualified accounts are allocated to the estate by default, and a new non-qualified account set up for the proceeds of the asset sale is no different. To allocate the asset sale funds to a goal, you must select a goal from theGoal Fundinglist (or specify where the funds will go on theGoal Fundingpage).
Review the asset sale using Net Worth and Cash Flow
reports
There are numerous NaviPlan reports that you can review to see how the sale of an asset may affect the clients’ net worth and cash flow. We will just take a look at a couple of examples.
TheAsset Activityreport shows the gross sale amount and the after-tax buy into the new account.
Figure 19: Asset Activity report (Reports menu – Net Worth – Assets – Asset Activity)
TheCash Flow Detailsreport illustrates how the sale affects the clients’ cash flow.
Figure 20: Cash Flow Details report
(Reports menu – Cash Flow – Details – Cash Flow Details)
If the clients sell their house in the year 2017 for the predicted amount, they would have a lump sum of approximately $800,000 to invest into their retirement goal and/or to buy an apartment condominium.
Model investment accounts with holdings
Model investment accounts with holdings
For streamlined data entry, you can enter summary account data on theAccounts
page. Clicking theDetailsbutton opens theAccount Detailsdialog box where you can enter more detailed account information, such as holdings, savings strategies, and return rates.
Accounts page
Figure 21: Enter Financial Data section – Net Worth category – Accounts page (showing the Account Details dialog box)
Account Details dialog box
Figure 22: Enter Financial Data section – Net Worth category – Accounts page – Details button – Account Details dialog box
Key points
l From theAccount Typelist, you can select from various types of accounts with differing tax treatments, for example,Non-Qualified,IRA,
and401(k).
l From theGoal Fundinglist, you can select which goal the account will fund.
o If a single goal is selected, 100% of the account will fund that goal. o If you selectMultiple Goals, theGoal Fundingdialog box opens where
you can allocate the account to multiple goals. By default, non-qualified accounts are allocated to the estate. By default, 100% of qualified
accounts fund retirement, but they can also fund education or major purchase goals.
l On theHoldingstab, you can model multiple holdings within an account, and each holding can have different asset class weightings.
l If you have the Ibbotson Asset Allocation option and you know the symbol for the asset, you can have NaviPlan classify the asset class weightings for the holding automatically by entering the symbol in theSymbolfield, and then clickingClassify.
l In theHold %/$field, you can enter the percentage or dollar amount of the asset that should be held for asset reallocation purposes.
Model investment accounts with holdings
Previously Incurred Investment Activity dialog box
Figure 23: Enter Financial Data section – Net Worth category – Accounts page – Previously Incurred Investment Activity button – Previously Incurred Investment Activity dialog box
Key points
l Clicking thePreviously Incurred Investment Activitybutton on theAccounts page opens thePreviously Incurred Investment Activitydialog box where you can capture a partial year’s growth for non-qualified accounts that have a valuation date other than January 1.
l NaviPlan calculates the accrued investment income of all non-qualified accounts using each account’s rate of return to estimate the investment income earned from the start of the year to the month before the valuation date. These amounts are used to calculate start-of-year market values for tax purposes.
l If the amounts displayed in thePreviously Incurred Investment Activitydialog box do not accurately reflect the investment income earned before the
Previous Roth Conversions dialog box
Figure 24: Enter Financial Data section – Net Worth category – Accounts page – Previous Roth Conversions button – Previous Roth Conversions dialog box
Key points
l If the Roth conversion occurred before the plan date, you can enter the 2010 taxable conversion amount in this dialog box to have NaviPlan split the taxable amount between 2011 (50%) and 2012 (50%).
l When using the Detailed Tax method, thePay Taxes Fromlist includes an option to pay taxes for the conversion fromCash Flow, with deficit coverage. l Roth conversions that occur after the plan date are modeled on theResults
section –Analyze Goalscategory –Scenariospage – Edit Recommended Plan
button –Scenario Managerdialog box –Retirementlink –Transferstab.
Classify holdings to establish a rate of return
Classify holdings to establish a rate of return
In NaviPlan, you can model multiple holdings within an account, with each holding having different asset class weightings information.
If you are using NaviPlan with the Ibbotson Asset Allocation option, asset classes are already set up for you and cannot be edited.
This guides uses the Ibbotson Asset Allocation option.
Holdings
Each holding within an account can be unique. Holdings are defined on theAccount Detailsdialog box –Holdingstab. Using theAsset Class Weightingslist, you can assign asset class weightings to the holding.
If necessary, the combined return rates for all the holdings within the account can be overridden on theReturn Ratestab.
Figure 25: Enter Financial Data section – Net Worth category – Accounts page – Details button – Account Details dialog box – Holdings tab
In the next few pages, we will examine the following:
A. Asset Class Weightingslist
B. Return Ratestab
C. Beneficiariestab
Asset Class Weightings list
Figure 26: Account Details dialog box – Holdings tab (showing options in the Asset Class Weightings list)
Key points
l Using theAsset Class Weightingslist, you can assign asset class weightings to the holding in three ways:
o Select an asset class to allocate 100% of the holding to one asset class. o SelectSearchto automatically classify an asset using the Ibbotson
database. You can search by description, symbol, type, or asset class (this feature is only available if you have purchased the Ibbotson Asset
Allocation option).
o SelectManual Classificationto manually adjust weightings.
l If theAsset Allocationmodule is included in the plan, NaviPlan reallocates assets for you automatically. You can hold a percentage or dollar amount of the holding outside of asset reallocation by entering a percentage or dollar value in theHold %/$field.
l The combined value of holdings equals the market value of the account.
To search for an asset in the Ibbotson database
1. From theAsset Class Weightingslist, selectSearch. TheAsset Class Weightings Detailsdialog box opens.
2. UnderSearch, enter the search criteria, and then clickSearch. For wildcard searches, insert an asterisk (*). For example, to search for assets that start with br, enterbr*in theTicker Symbolfield.
3. UnderResults, select the appropriate asset, and then clickOK. TheAsset Class Weightings Detailsdialog box closes.
Classify holdings to establish a rate of return
Return Rates tab
Figure 27: Account Details dialog box – Return Rates tab
Key points
l Return rates are based on a weighted average of all holdings in the account. l NaviPlan calculates taxes on return rates as follows:
o Interest– The earnings on investments other than dividends or capital
gains such as deposit accounts, GICs, and bonds.
o Dividends– Taxed annually as per TIPRA 2006.
o Capital Gains– Mutual funds are taxed annually as long-term gains. All
other assets are taxed annually as short-term gains.
o Deferred Growth– (If held less than 13 months, taxed as short-term gains.
Beneficiaries tab
Figure 28: Account Details dialog box – Beneficiaries tab
Key point
l You can assign primary and contingent beneficiaries for the account in the event of the account owner’s death.
Classify holdings to establish a rate of return
Account Fee Setup tab
Figure 29: Account Details dialog box – Account Fee Setup tab
Key point
l The default annual account fee for all new plans is set on theUser
Preferences–Plan Settingsdialog box –Generaltab. You can override this default account fee for individual accounts on theAccount Fee Setuptab.
Model savings to investment accounts
In NaviPlan, you can enter multiple savings strategies to reflect changes to savings amounts over time.
Enter a savings strategy
Savings strategies can be modeled on theAccount Detailsdialog box –Savings Strategytab or, in Level 2 Plans only, on theEnter Financial Datasection –Strategies
category –Savingspage.
To add a new savings strategy, click theAdd Savings Strategybutton. Additional data-entry fields appear. ThePre-tax, Post-tax, andEmployerfields only appear for qualified accounts.
You can use event keywords, such asretirementordeath, to define when the savings strategy starts and ends. The keywordmaxcan be used to maximize contributions.
Figure 30: Enter Financial Data section – Net Worth category – Accounts page – Details button – Account Details dialog box – Savings Strategy tab (showing details for a qualified account)
In the next few pages, we will examine the following:
A. Using keywords for start and end dates
B. Using keywords to maximize contributions
Model savings to investment accounts
Using keywords for start and end dates
Figure 31: Account Details dialog box – Savings Strategy tab (for a non-qualified account)
Key points
l In date fields, clicking theEvent Calendarshows possible events and event types that can be used to define the date. For some event types, offset fields may be available to add or subtract years.
l You can use theEvent Calendaror enter actual dates or event keywords, such asretirementordeath, in date fields. One benefit of using event keywords is that if the event date changes, the strategy is updated.
l You can enter the keywordnowto use the current date.
l You may want the strategy to end a number of years before or after the event. You can indicate this by adding or subtracting a number of years, for
example,retirement +5ordeath -1.
l The defaultEnd Datefor savings strategies is the event ofRetirement. If you selected theClient(s) are already retiredcheck box when you created the plan and are entering savings strategies for your clients, be sure to adjust the defaultEnd Dateaccordingly.
For example, if you currently save $500 monthly towards Jim’s 403(b) account, you could enter the keywordnowin theStart Datefield and the keywordretirementin the
Using keywords to maximize contributions
Figure 32: Account Details dialog box – Savings Strategy tab (for a qualified account)
Key points
l To maximize contributions to a qualified account, enter the keywordmaxin thePre-taxfield underAmount ($ or % of Salary).
o If the client owns multiple qualified accounts of the same type, for
example 403(b)s, NaviPlan prorates the contribution amounts automatically and recognizes catch-up provisions.
o NaviPlan does not prorate contributions between different qualified
account types. For example, if contributions to both a 403(b) account and a 401(k) account are maximized, overcontributions may occur.
l NaviPlan’sPlanning Assistant™ provides a report that will help you to keep track of contributions.
To review client contributions
1. Click thePlanning Assistantbutton. ThePlanning Assistantdialog box opens.
2. Click theReportstab.
3. From theSelect a reportlist, selectQualified Contribution Limits. The report generates and appears within the dialog box.
Model a fixed annuity
Model a fixed annuity
This learning objective outlines the various types of annuities that can be entered in NaviPlan, but it will focus mainly on entering a fixed annuity (an annuity with fixed interest rates).
Annuities page
Basic annuity information can be entered on theAnnuitiespage. Clicking theAdd Deferred Annuitybutton allows you to select between a fixed or a variable annuity. Clicking theDetailsbutton opens theAnnuity Details dialog box where you can further define the annuity details.
Figure 33: Enter Financial Data section – Net Worth category – Annuities page
In the next few pages, we will examine the following:
A. Annuity types
Annuity types
Figure 34: Enter Financial Data section – Net Worth category – Annuities page
Key points
l On theAnnuitiespage, you can enter fixed, variable, and annuitized annuities. The annuity types are defined as follows:
l Fixed– Annuities with fixed interest rates; these annuities have one general account only.
l Variable– Annuities with return rates that vary depending on how the annuity funds (holdings) are invested. These annuities have a general account and subaccounts; payments from the general account and from the subaccounts may vary from year to year.
l Annuitized– Annuities that have matured and are distributing payments to the clients.
To enter a fixed annuity
1. On theAnnuitiespage, click besideAdd Deferred Annuity, and then selectFixed Annuityfrom the list. TheAnnuity Detailsdialog box opens.
2. Enter all the applicable annuity information.
3. On thePayout Optionstab, define how the annuity will be paid out.
4. Go to theSavings Strategytab, clickAdd Savings Strategy, and then define any savings strategies for this annuity.
5. ClickOK.
Model a fixed annuity
Annuity Details dialog box
Figure 35: Enter Financial Data section – Net Worth category – Annuities page – Details button – Annuity Details dialog box
Key points
l The fields in theAnnuity Detailsdialog box vary depending on the type of annuity.
l From theIncome Optionlist, the following methods for receiving annuity payments are available:
o Amount Certain– Years are calculated based on the payment amount
specified.
o Term Certain– Pays a given dollar amount per $1,000 of the annuity’s
market value until the specified term has ended.
o Life Income– Pays a given dollar amount per $1,000 until death (the
annuity becomes a permanent income stream). Payouts over the life of the annuitant are calculated based on the annuitant’s life expectancy.
Analyze clients’ investment accounts using
reports
There are numerous NaviPlan reports that you can review to analyze your clients’ investment accounts. This learning objective takes a look at a few of those reports.
Reports
There are many NaviPlan reports related to investment accounts.
Figure 36: Reports menu – Net Worth – Accounts
In the next few pages, we will examine the following reports:
A. Account Summaryreport
B. Multi-Year Net Worth Summaryreport
C. Single Asset Summaryreport
Analyze clients’ investment accounts using reports
Account Summary report
Figure 37: Account Summary report (Reports menu – Net Worth – Accounts – Accounts Summary)
Key points
l This report illustrates the clients’ progress and the growth of their net worth. l It is useful for tracking the progress of new clients over time and should be
Multi-Year Net Worth Summary report
Figure 38: Multi-Year Net Worth Summary report (Reports menu – Net Worth – Summary – Multi-Year Net Worth Summary)
Key points
l This report displays the clients’ projected end-of-year net worth values based on asset type. It gives you a big picture of your clients’ net worth over time. l Note that the asterisk (*) highlights the year of retirement, for clients who are
not yet retired.
l Use this report to look for any net worth oddities that occur in the plan, such as a spike in income in a particular year.
Analyze clients’ investment accounts using reports
Single Asset Summary report
Figure 39: Asset Summary report (Reports menu – Net Worth – Assets – Single Asset Summary)
Key points
l This report breaks down the annual transactions for an asset.
l Use theBuys,Total Reinvested, andDeferred Growthcolumns to verify savings strategies and return rates.
l For a monthly breakdown of transactions, generate theSingle Asset Details report (Reportsmenu –Net Worth–Assets–Single Asset Details).
Conclusion
Upon successful completion of this module, you are now able to l Capture lifestyle assets.
l Capture liabilities.
l Verify data using reports.
l Examine the net worth and cash flow implications of selling a home. l Model investment accounts with holdings.
l Classify holdings to establish a rate of return. l Model savings to investment accounts. l Model a fixed annuity.
l Analyze your clients’ investment accounts using related reports.