EFFECTS OF RESTRICTED POPULATION SIZE AND INCREASE IN MUTATION RATE ON THE GENETIC VARIATION
O F QUANTITATIVE CHARACTERS
MASATOSHI NE1 AND YOKO IMAIZUMI
Division of Genetics, National Institute of Radiological Sciences, Chiba, Japan
Received April 12, 1966
genetic variation of quantitativ; characters in an equilibrium population T E p e n d s on the size of the population, and it is expected to be larger in a large population than in a small population. Introducing the concept of gene frequency distribution, WRIGHT (1931) was able to obtain a simple formula for the relationship between genetic variation and population size when the genes controlling quantitative characters are maintained by reversible mutations or a special kind of genic selection. Recently, ROBERTSON (1962) studied an important case of heterozygote advantage in terms of the frequency of heterozygotes and found that the genetic variation in small populations is highly dependent on the equilibrium gene frequency in an infinitely large population. Much more study is needed, however, in order to clarify further the general relationship between genetic variation and population size.
The mechanism through which the genetic variation of quantitative characters is maintained in natural populations is not well understood at present. There are four major hypotheses for the mechanism, i.e. (1) reversible mutation, (2) bal- ance between mutation and selection, (3) overdominance or heterozygote ad- vantage, and (4) optimizing selection. So far none of these hypotheses have been subjected to critical experimental test. If, however, these hypotheses lead to differ- ent relationships between the amount of genetic variation and the population size, then it would be possible experimentally to determine which mechanism is most important. We, therefore, examined the relationship theoretically with special reference to the first three hypotheses. There are several possible types of opti- mizing selection and this generally creates a difficulty in the mathematical treatment, especially such a model as proposed by KIMURA (1965). Note, how- ever, that if genes are maintained by overdominance and their effects on a quantitative character are additive, an optimizing selection results (ROBERTSON 1956).
For the experimental test of the hypotheses it would also be helpful to know the relationship between the population size and the mean value of the character or the changes in mean value and genetic variation due to an increase in muta- tion rate. Mutation rate can easily be increased experimentally by the use of
This In\estigation was supported In part by a grant from the Scientific Research Fund of the Ministry of Education,
radiation or other mutagenic agencies. Further, the relation between the popula- tion size and the changes in mean and variance would give useful information concerning the genetic effect of radiation on quantitative characters in man or other organisms.
MATHEMATICAL FORMULATION
Mean and genetic variance: Let us assume that a large number of loci, each with two alleles, are responsible for a quantitative character and that they act independently of each other both f o r the quantitative character and fitness. Thus, there are three possible genotypes for a locus, i.e. AA, Aa, and aa, where A and a refer to the alleles with positive and negative effects on the quantiative character. W e denote the relative fitnesses and effects on the quantitative character of the three genotypes as follows:
Genotype Frequency Fitness Quantitative
character
A A Aa aa
92 9 4 - 9 1 (1-9)2
1 I-h 1 --s
a d -a
Here q represents the gene frequency of A . The contributions of this locus to the mean and additive genetic and dominance variances of the quantitative character are given by
Mean
Additive variance Dominance variance
Y = (%--l)a
+
2 9 ( 1 - 9 ) dU, = Q ( l - 9 ) [a
+
( 1 - - 2 9 ) 4 2ud = 49’( 1-9) ‘d’
We now assume that the values of h, s, a and d are the same f o r all relevant loci. The probability distribution of gene frequency in an equilibrium population of finite size is then given by
(1)
9
( 4 ) = Ce-4X7~ - 2 N s (1-q) * q 4 N U - 1 ( 1 -q) 4 N V - 1where
N
is the effective population size, and U and U are the mutation rates ofa + A and A+a, respectively (WRIGHT 1937). Thus, the mean of the quantita- tive character is given by
= G
+
n [- a + 2 ( a + d ) ~ ~ ’ ~ - 2 d ~ ~ ’ ~ ] ( 2 )where G and n stand for the background effect and the number of loci concerned, respectively, and p’l and , J L ’ ~ are the first and second moments of the gene fre-
quency distribution, namely
=
1:
q‘+
( 9 ) d q (3)In the same way the additive and dominance variances become
GENETIC VARIATION A N D POPULATION SIZE 765
V o = 4nd2( p’2 - 2p’3
+
p r q ) ( 5 )respectively.
It is generally difficult to obtain the moments of gene frequency distribution analytically. However, in the case of neutral genes, which are maintained by reversible mutations, the moments are easily obtained and given by the beta functions as follows:
where
U
= 4 N u and V = 4Nv. Thus, for example, the additive variance in the case of no dominance ( d = 0) becomes8nuva2N
( U
+
U ) ( U+
v
+
1)V*
=which is equivalent to the formula obtained by WRIGHT (1931). I n the case of genic selection ( h = 1/s) the moments are given by
( 7 ) r ( U + V ) r ( U
+
r ) l F 1 ( V , U+
V+
r, -2Ns)r ( U ) r ( U
+
V+
r ) l F l ( V , U+
V , +2Ns) P’r =where lFl denotes the confluent hypergeometric function. are obtained in the same way and become
Skewness and kurtosis: The skewness and kurtosis of a quantitative character
respectively.
(8) and (9) reduce to
When the genetic variation is maintained by reversible mutations, formulas
(10)
( 1 1 ) ( U
+
U ) ( U + U+
1 / ( 4 N ) ) U - - U4
2nuu U+
U+
2 / ( 4 N )Y1-
( U
+
U ) ( U+
U+
1/(4N)) - ~ U Vrespectively. Formula (1 1 ) shows that in small populations the distribution of a quantitative character becomes leptokurtic unless n is very large. Further, if U differs extremely from U , the distribution shows a considerable skewness in large populations.
The skewness and kurtosis when there is dominance ( d
>
0) or when the genes are subject to natural selection can be obtained in the same way or numerically, and it can be shown that the distribution is again leptokurtic when N is small. Genetic load associated with quantitative characters: If the genes controlling a quantitative character are maintained by selection, they necessarily create a genetic load to the population. The magnitude of this genetic load can be obtainedy , = 3 +
M. NE1 A N D Y. IMAIZUMI
by the same method as that used by KIMURA, MARUYAMA and CROW (1963), who studied the genetic load arising from deleterious mutations. For example, the segregational genetic load for a n overdominant loci is given by
If N s is small (2 Ns
<
5 ) , this can be approximated byL8 = -h f S(1 - p'a) - 2 ( S - h ) ( ~ ' 1 - p'z) ( 112)
(s - h )
-
h ( u / u ) eZN81
+
( u / u ) ezNsL, =
. , I
Effects of a n increase
in
mutation rate: When the mutation rate is increased artificially in a generation, the mean, genetic variance, and genetic load in the next generation may change through the change of gene frequency. If the muta- tion rate from a to A increases by ml and from A to a by m2 in a generation, then the gene frequency of A increases as follows:Aq = ml - ( m ,
+
m z ) qIf m, = mz = m, as is generally believed with the bristle characters of Drosophila melanogaster (cf. TOBARI and NEI 1965), Aq becomes ( 1 - 2 q )m. Neglecting the effect of the higher orders of Aq, the change of mean is given by
5'
dYAY =
-
Aq+(q)&O dq
(14) =2n [ ( a + d ) m , - {urn,+ ( a + d ) ( m l + m Z ) } p ' 1 + 2 d ( m l ~ m z ) p ' ~ 1
I n the same way the changes in genetic variance and genetic load can be obtained.
NUMERICAL COMPUTATIONS
Methods of computation: As shown in the preceding section, the mean, genetic variance or other quantities in a population of finite size can be expressed as a function of the moments of the gene frequency distribution. The evaluation of the moments, however, usually necessitates a numerical integration, since they are not generally expressible in terms of elementary functions. If the right side of ( 1 ) with C omitted is denoted by P ( q )
,
the moments are obtained byI n the computation of the values of integrals in the above formula we used Simp- son's method. When the population size is small, the value of P ( q ) may become
+CO both at q = 0 and 1, so that Simpson's method is not directly applicable. In
GENETIC V A R I A T I O N A N D POPULATION SIZE 767 approximately. (ii) When the effective population size is extremely large, P'~ is given by
4'.
(iii) In the case of neutral genes the moments are obtained directly from ( 6 ) . (iv) In the special case ofU
= V = 1 and h =i/z,
a direct integration is possible; in this case the moments are also obtainable from (7). (v) In the case of U = V = 1 a n d h = 0,where C is d 2 N s / ~ / e r f ( 2 v ' x ) , e r f ( x ) being ( : l / d z e - t a / z d t .
In the numerical computation we chose the values of s and h so as to give three different levels of the equilibrium gene frequency at N = C O , namely 0.5, 0.7,
and 0.9 (see Table 1 )
.
Note that, when s and h are small, the equilibrium gene frequency at N = cc is affected by both the forward and backward mutations.In all cases U = loa5 was used, ,while for the reverse mutation U = (3/7) x was used in the cases of ( 4 ) , (14), and (15), and U = (1/9) x in the cases of (9)
,
( 1 6),
and ( 1 7 ) . In all other cases we assigned 1 0-5 to U . It may be noted that cases ( l ) , ( 4 ) ) and (9) represent neutral genes, and cases (8), (12), and (13) genes maintained by a balance between mutation and selection. The other cases all relate to genes showing heterozygote advantage or overdominance. The selection coefficients in (14)) (15), (16), and (17) are almost equal to those in ( 5 ) , (6), ( l o ) , and ( 1 1 ) respectively, though the mutation rates are not the same. The latter group of cases was set up just to see the effect of spontaneous mutation rate in small populations.I I 1 I I
10 102 103 104 105
POPULATION SIZE -0.li
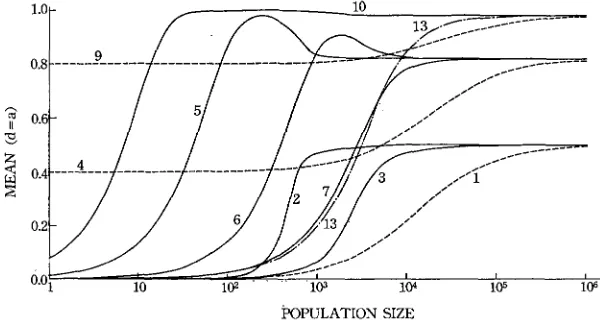
Mean: If there is no dominance for quantitative characters or d = 0, expression (2) reduces to Y = G
+
na(2p‘, - 1 ) . Thus, the relation between the mean andpopulation size is determined by 2pLll - 1. The values of 2p’, - 1 are given in Figure 1. For cases ( l ) , (2), and (3) p’, = 0.5 for all values of
N ,
so that the mean of a quantitative character is independent of population size. Also, in cases (4) and (9) the means are independent of population size, though the values are not the same as those of the first three cases. Case(5)
shows that the mean value first increases logistically with an increase of N , reaching the maximum value at about N = 200, and then begins to decrease, approaching the value of N = CO.The large values of the means in populations of the order of 200 has been brought about by the mean gene frequencies drifting away from the equilibrium values. That the gene frequencies in small populations are deviated far from the equi- librium values when the equilibrium gene frequencies at N = 00 are not 0.5 has
been noted by ROBERTSON (1962). It is seen from (6) and (7) that a similar pattern of change in mean obtains also for the smaller values of s and h though the pattern is less conspicuous. Comparison of
(5)
with (14) or (10) with (16) shows that, if U>
U, the mean value is further increased in populations of inter-mediate size. It is also observed that the mean in small populations is affected more strongly by mutation than by selection intensity.
In the case of complete dominance (cases (8) and (12) ), the mean value in populations of intermediate size is also slightly larger than the value at N = CO.
When there is selection without dominance or genic selection (13)
,
the relation between the mean and population size is of S shape.When the effects of genes on quantitative characters show complete dominance
( d = a ) , expression (2) becomes Y = G - na( 1 -
4 ~ ’ ~
+
2 ~ ’ ~ ) .
The values of- 1
+
4 ~ ’ ~
- 2p’z are given in Figure 2. The mean value is no longer independent of the population size even in the case of neutral genes (1, 4, and 9). The samet
I
10
,I_---___---
-
- -/.<---
POPULATION SIZE
GENETIC V A R I A T I O N A N D POPULATION SIZE 769 is true for the cases of (2) and (3), i.e. overdominance. Other cases show the same type of change in mean as in the case of d = 0, but the difference between the maximum value and the value at
N
= 00 is smaller.Theoretically, it is possible to make d equal to -a. I n this case Y = G - na( 1
-
2 , ~ ‘ ~ ) . Thus, the relation between Y and
N
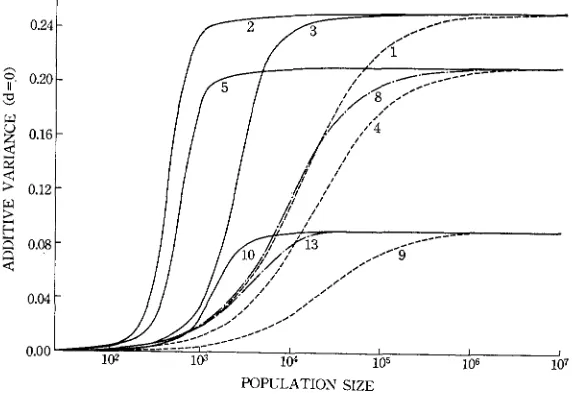
is somewhat different from that of the case where d = a. However, we will not consider this any more, since it appears important only in limited cases.Additive genetic and dominance variances: With d = 0 the additive genetic variance becomes 2nd (pLI1 - P ’ ~ ) . The values of p’l - pI2 are given in Figure 3. The relation between the additive genetic variance and effective size is rather simple, and in all cases an S curve obtains. Selection, whether genic, recessive or overdominant, generally increases the variance in small populations. Thus, when the fitness or heterozygotes is higher than those of both homozygotes by 1 % (case 2 ) , the genetic variance in a population of the order of 1000 is almost equal to that in a population of more than 100,000 in the case of neutral genes. The same is true also f o r the case of
( 5 ) ,
when compared with case (4). The genetic variability maintained in a small population is generally larger when genes are subject to strong selection than when subject to weak selection. It was also found that the genic selection with small values of s and h (13) has a stronger effect on the genetic variance than an overdominant selection with rather large absolute values of s and h (11).In a study of the effect of overdominance on the frequency of heterozygotes,
ROBERTSON
(1962) reached the conclusion that, while it can conserve a larger genetic variability than in the case of neutral genes in a region of 0.1540.85 ofPOPULATION SIZE
POPULATION SIZE
FIGURE 4.-Effect of overdominance i n fitness on the additive genetic variance when the equilibrium gene frequency is 0.9. The broken line refers to no selection and the solid lines to overdominant selection. The number given to each curve represents the case number in Table 1.
It is seen that curves 16 and 17 cross 9.
the equilibrium gene frequency at
N
= CO, it may reduce the genetic variabilityoutside the region if
N
(s - 2h) is smaller than a certain critical value. This con- clusion is based on a study of rather small populations with equal mutation rates of U and U . However, if the population size is very large, the genetic variance under selection again becomes smaller than that in the case of no selection, as seenPOPULATION SIZE
GENETIC V A R I A T I O N A N D POPULATION SIZE 771 from the comparison of curves (1) and (IO) in Figure 3. If, on the other hand, the mutation rates for neutral genes are assigned so as to give the same equilibrium gene frequency as that specified by a given type of selection, the genetic variance in large populations in larger for non-neutral genes than for neutral genes [ (9)
us. ( l o ) ] . In this case, however, the ROBERTSON effect disappears. I n order for this effect to hold, the mutation rates for non-neutral genes should be the same as or close to those for neutral genes, as seen from Figure 4. I n the case of (16) in Figure 4 the ROBERTSON effect arises for N
<
IO3 and in the case of (17) forN
<
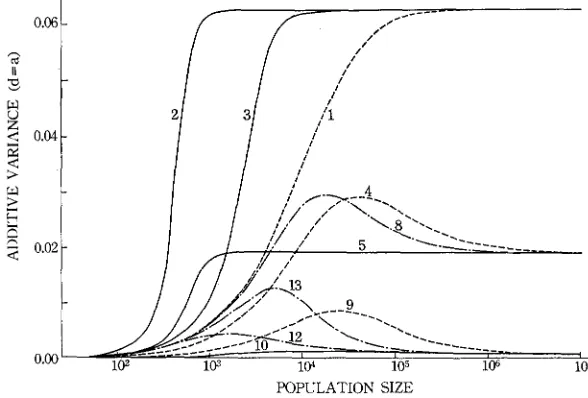
IO4. No such effects were observed for the cases of (14) and (15).When d = a, the relationship between the additive genetic variance and popu- lation size is slightly changed, as seen from Figure 5. With the equilibrium gene frequency of 0.7 or 0.9 and weak o r no selection, the genetic variance in a popu- lation of intermediate size, i.e. around lo4, is larger than the value in an infinitely large population. This is caused by the fact that, when there is weak or no selec- tion, the gene frequencies are affected by random genetic drift more severely than when there is strong selection. It is of interest to see that, when the equi- librium gene frequency is 0.9 and N is smaller than IO4, genic selection (13) is capable of maintaining a larger genetic variance than no selection (9). Over- dominant selection (1 0)
,
however, maintains only a small variance. This is due to the fact that under strong selection the moments of gene frequency quickly reach the values of N = 00 as N increases. The same is true for the case of (5).The numerical values of dominance variance, i.e. Vo/4nd2 = pI2 - 2 ~ ’ ~
+
pE4,are graphically shown in Figure 6. The relationship between the dominance
-
m0.06
1
0.04 -
0.02 -
0.CQ- 0.06 -
-
POPULATION SIZE
variance and population size is almost the same as that between the additive genetic variance and population size, except that with some sets of small selection coefficients (e.g. 12) the intermediate size of
N
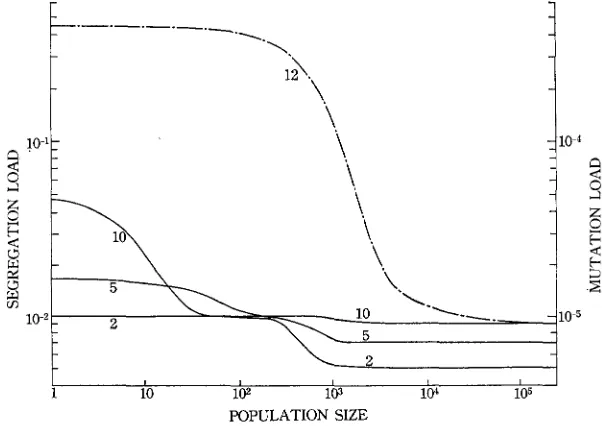
no longer shows the largest value.Genetic load: The genetic loads for representative cases are plotted against the population size in Figure 7. The relation between the mutation load and popu- lation size has been fully investigated by KIMURA, MARUYAMA, and CROW (1963), and our results on this type of load are almost the same as theirs. One exception is that the genetic load created by small selection coefficients becomes smaller than thc mutation rate when N is large. For example, in the case of (8) the genetic load at N = w becomes 0.6 x for a locus. This smaller load than the mutation rate is due to the fact that with weak selection the reverse mutation
a+A is no longer negligible when U = U. As indicated by KIMURA et al. (1963),
the mutation load increases as
N
decreases. Thus, in the case of (12) the genetic load forN
= 100 is almost 40 times the load for N = w (Figure 7). If there are 100 such loci controlling a quantitative character, the reduction in fitness is 1 - e100x0.9x10-5 = 0.09% for N = CO and 3.5% for N = 100.The relation of the segregation load to the population size is somewhat differ- ent from that of the mutation load. First, the difference in the segregation load between large and small populations is not generally so great as the difference in the mutation load. I n general, the load for segregational loci is quite high even when N = w but does not increase so strikingly with a decrease of population size as does the load for mutational loci. In the case of (2), for example, the total load for 100 loci is 100 x 5 x 10-3 = 0.5 when
N
= w and 1 whenN
= 100. The relative fitnesses of the two populations are 0.61 and 0.43 respectively. Second,10
T5
\ 2
I I I I
1 10 102 103 104 105
POPULATION SIZE
GENETIC VARIATION A N D POPULATION SIZE 773
with some sets of selection coefficients the genetic load shows a two-step change as
N
increases, as in the cases of( 5 )
and (IO).Changes of mean due to an increase in mutation rate: When d = 0 and m, = mz = m, the amount of change in mean is given by 2nma( 1 - 2 ~ ’ ~ ) . The
dependence of this change on the population size can be seen from Figure 1, where the value of 2p’, - 1 is given. The interpretation of this figure has already been discussed. In the case of complete dominance ( d = a ) , AY = 4nma( 1
-
3pfl f 2 ~ ’ ~ ) . Numerical computations have shown that the relation of AY to N
is roughly the reverse of the relation of Y to N and AY is generally larger in small populations than in large populations.
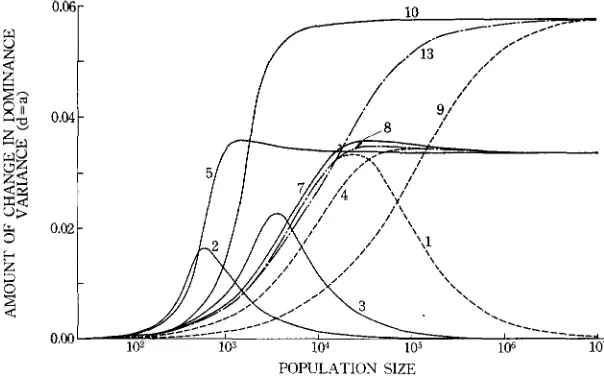
Changes of genetic variances: The changes of additive variance due to an increase in mutation rate when d = 0 are shown in Figure 8. The relation of A V , to N is again roughly the reverse of the relation of V , to N . In small popu- lations most loci are fixed, so that almost every mutation creates a new genetic variation. A large population, on the other hand, contains both positive and nega- tive alleles. so that the frequency of heterozygotes is hardly affected, unless the equilibrium gene frequency deviates substantially from 0.5. If the equilibrium gene frequency is 0.7, AVA at
N
= 30 is less than one fifth of the value atN
<
100.The amounts of changes in additive genetic variance with d = a are shown in Figure 9. When the equilibrium gene frequency is 0.5, AV, decreases mono- tonically with an increase of
N ,
but if it differs from 0.5, this value decreases f a r below the level of N = x. in populations of intermediate size. In an extreme case of (IO) the value of AV, is almost zero for N = 102+107. Apparently, these decreases are caused by the gene frequency drifting away from the equilibrium value.The change in dominance variance in a population of N
<
100 is negligiblyk
i 3 0
2
POPULATION SIZE
7
POPULATION SIZE
FIGURE 9.-Amounts of changes in additive genetic variance due to increase in mutation rate in populations of finite size (d = a ) . The broken lines refer to no selection and the solid lines to overdominant selection. The line in dot and dash refers to genic selection. The number given to each curve represents the case number in Table 1.
small but it gradually increases as N increases (Figure 10). When the equi- librium gene frequency is 0.9, AV, monotonically increases to reach the largest value of N = 0 0 . However, if it is 0.5, AV, again decreases and becomes 0 at
N = 00 (1, 2, and 3 ) . This is understandable if we note that the change in domi-
nance variance can be written as 8Zmq( 1 - q ) (1 - 2q)
V ,
whereX
indicatesthe summation over all relevant loci. This quantity is 0 if q is any of 0,0.5, and 1. In small populations q is mostly 0 or 1, whereas in large populations q is 0.5 at
POPULATION SIZE
GENETIC VARIATION A N D POPULATION SIZE 775
1 1 I I I
1 10 102 103 104 105
-0.0121
POPULATION. SIZE
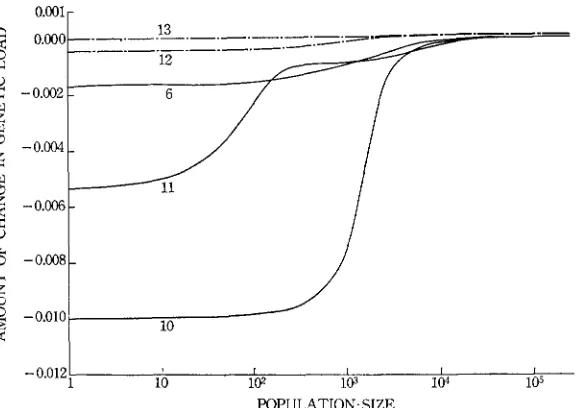
FIGURE 1 1 .-Amounts of changes in genetic load due to increase in mutation rate. The solid lines refer to segregation load and the lines in dot and dash to mutation load. The number given to each curve represents the case number in Table 1 .
most loci. In both cases, therefore, A V , is nearly 0. I n populations of intermediate size, however, q is flatly distributed with the mean value of 0.5, and those loci at which 0
<
q<
0.5 or 0.5<
q<
1 contribute to the value of AV,.Changes of genetic load: When the genetic variation is maintained by mutation and selection, the amount of change in genetic load is generally small, as seen from Figure 11 (of course, if s and h are large, this change could be large). In an infinitely large population the change in genetic load is positive as it should be, but in a small population it can be negative if dominance for fitness exists, as in the case of (12). In this case such mutations as AA+ A a show no effect on fitness, while the mutations such as aa+ A a increase fitness. Therefore, the genetic load decreases.
I n the case of overdominance the genetic load is almost independent of muta- tion rate if N is large. However, if N is small, the genetic load is reduced by increase in mutation rate (Figure 11). This reduction in the genetic load or the increase of fitness is caused by the increase of heterozygote frequency due to mutations.
DISCUSSION
NE1 Y. IMAIZUMI
very small compared with that of a large population (of course, assuming that the mutation rate is of the order of lo-”, it may be conjectured that the genetic variation is maintained by reversible mutations or very slight overdominant selection. When overdominant seelction operates and the equilibrium gene fre- quencies are far removed from 0.5, the ROBERTSON effect takes place, and the genetic variance in small populations could be smaller than in the case of rever- sible mutations. In this case, however, the mean value changes with change of population size and the genetic load is considerably larger even in large popula- tions. The genetic load associated with a quantitative character may be measured by the method developed by HALDANE (1954) in practice, assuming no inter- action between genetic and environmental effects. When the genetic variation is maintained by the balance between mutation and selection, the relation be- tween the genetic variance and population size may again look like the relation for neutral genes. In this case, however, the genetic load in small populations would be much larger than that in large populations. For the purpose of discrimi- nating between the different mechanisms of maintaining the genetic variation information on the changes in genetic parameters may also be useful.
If there is dominance for quantitative characters, the relations of genetic param- eters with population size are somewhat different from those in the case of no dominance, but the relations may again be used for discriminating between the different mechanisms. The degree of dominance of quantitative characters can be studied by the comparison of full sib and parent-offspring correlations or other procedures specifically designed for the purpose.
Quantitative characters are often subject to a centripetal selection. Several models of optimizing selection have been put forward to explain this type of selection, though most of the models have been proved to be inadequate for main- taining the genetic variation permanently (FISHER 1930; WRIGHT 1935; KOJIMA 1959; LEWONTIN 1964). Recently, KIMURA (1965) proposed a new model based on a number of assumptions, of which the adequacy is not necessarily demon- strated.
On the other hand, ROBERTSON (1956) has shown that, if the individual genes are maintained by overdominance, a centripetal selection results. This was extended to the case of balance between mutation and selection by KIMURA
(1958). Thus, if any of these kinds of selection leads to the same type of centrip- etal selection as observed in nature or in experiments, optimum models may be unnecessary. For the overdominance or mutation-selection model to be correct, several properties other than those considered here should be satisfied (cf. ROBERTSON 1959; KIMURA 1960).
G E N E T I C VARIATION A N D P O P U L A T I O N SIZE 777
the quantitative character and fitness are correlated. It is also expected that the response to selection is very small in early generations and gradually increases as generation proceeds, since it depends on the quantity q (1 - 4). However, the selection experiments conducted with Drosophila or mice do not support any of these predictions. On the other hand, the overdominant selection usually creates a large genetic load in large populations compared with the mutation-selection scheme, and this is one of the reasons why some authors object to the overdomi- nance hypothesis. If, however, the heterozygote advantage is only of 1
%
or less, the genetic load created by some 100 such loci would not be so large. In small populations the genetic load is quite large both for mutational and segregational loci.Natural populations are not necessarily a single random mating unit but usually subdivided into many subpopulations in which random mating takes place. I n such populations the gene frequency distribution for neutral genes is
given by
where
,-
4 N v [ m ( l - r ) + U + V ]U -
V‘
u + u
4Nv [m( 1
-
r )4-
U+
V ] u + vand m and r stand for the migration rate and correlation of gene frequency between neighboring subpopulations (cf.
KIMURA
and WEISS 1964), and N for0 . 0 0 10 y
POPULATION SIZE
NE1 AND
the effective size of subpopulations. In WRIGHT’S “island model” (WRIGHT 1943), r is always 0, while in the “stepping stone model” by KIMURA and
WEISS
(1964) r is a function of m. In the case of two dimensional distribution r is 0.70 for m = 0.1,0.68 for m = 0.05, and 0.48 f o r m = 0.001. Using the above distribution, we can obtain the mean, genetic variance, etc. of quantitative characters as before. The result for the additive genetic variance with d = 0 is shown in Figure 12. In this computation U = U =It is clear that in the case of island model with m = 0.1 the additive genetic variance in subpopulations of
N
= 100 is almost the same as that in an infinitely large population. It is also noted that the genetic variance for N = 100 and m = 0.1 is of the same order of magnitude as that for N = lo6 and m = 0. The genetic variance for stepping stone model is slightly smaller than that for island model when the migration rate is the same. It is, however, remarkable that the migration of only 0.1%
can increase the genetic variance considerably compared with the case of complete isolation. NEI and IMAIZUMI (1966) have estimated the effective size and migration rate of the so-called isolated populations in Japan. The estimates obtained are 1993 and 0.06 respectively. It may, therefore, be inferred that the genetic variance of quantitative characters in these populations is hardly different from that in the general Japanese population.Information on the changes of genetic parameters due to increases in mutation rate may be useful in the evaluation of genetic effect of radiation in man or other organisms. For example, if there is no dominance ( d = 0) and no selection and the forward and backward mutations occur with equal frequency, the means of quantitative characters are hardly affected in any population. The results ob- tained with Drosophila melanogaster may reflect this circumstance ( TOBARI
and NEI 1965). On the other hand, if there is dominance or selection or the forward mutation rate far exceeds the backward mutation rate, the means could be lowered by radiation. One such case is known with the maze learning ability of rats (NEWCOMBE and MCGREGOR 1964), though the underlying genetic mechanism is not clear. It is of interest to see that under the assumptions made in this paper the change in mean is larger in small populations than in large populations.
The effect of radiation on the variance may be evaluated from Figures 8 and 9, assuming the constancy of environmental variance. It is clear that the amount of increase of genetic variance is larger in small populations than in large popu- lations. In such a case as (1) in Figure 8, the increase of genetic variance in populations of less than 1000 is considerable, while in populations of larger than lo5 the genetic variance hardly changes. The degree of dominance and the selection scheme affect the relation between N and A V , or AVa -t AVD but the general pattern remains the same. This indicates that the genetic hazard of radia- tion to man may not be the same for small-sized isolated populations and large general populations.
TOBARI and NEI (1965) examined the effect of X rays on the genetic variance of abdominal bristles of D. melanogaster, using an approximately equilibrium population of about 8,000 individuals, and obtained almost the same amount of
GENETIC VARIATION A N D POPULATION SIZE 779 variance increase as observed with an isogenic population. Assuming the effective population size to be 4,000, this result suggests that the genetic variation is maintained largely by reversible mutations or very slight selection. Note that this character is known to show little dominance and mutations occur in both positive and negative directions with an almost equal frequency. Further, the upward and downward selections so far conducted suggest that the average gene frequency is not far from 0.5.
Finally, it should be noted that the present analysis is based on the assumptions of no epistasis and no multiple alleles. If these assumptions are not fulfilled, the relationship between the genetic variation and population size may be somewhat different, but the general pattern appears to be the same, unless epistatic effects are large.
W e are indebted to DR. M. KIMURA for helpful discussions during preparation of the manu- script. Our thanks are also due to DR. H. B. NEWCOMBE for correcting the English.
SUMMARY
small populations than in large populations, though they depend on various fac- tors such as the forward and backward mutation rates and the mechanism of maintaining the genetic variation.-The bearings of the results obtained on the experimental discrimination between the different mechanisms of maintaining the genetic variation and the evaluation of genetic hazard of radiation to man have been discussed. The effect of migration on the genetic variation has also been examined by using the “island” and “stepping stone” models.
LITERATURE CITED
FISHER, R. A., 1930
HALDANE, J. B. S., 1954 The measurement of natural selection. Proc. 9th Intern. Congr. Genet.
KIMURA, M., 1958 On the decrease of fitness due to deviation from optimum in quantitative characters. Ann. Rep. Nat. Inst. Genet. (Japan) 8 : 106-107.
-
190 Relative appli- cability of the classical and the balance hypotheses to man. Especially with respect to quanti- tative characters. J. Radiation Res. 1: 155-164. __ 1963 Numerical methods used to evaluate the mean and the variance of the mutational load with genic selection. Genetics48: 1310-1312.
-
1965 A stochastic model concerning the maintenance of genetic variability in quantitative characters. Proc. Natl. Acad. Sci. U.S. 54: 731-736.KIMURA, M., T. MARUYAMA, and J. F. CROW, 1963 The mutational load in small population. Genetics 48: 1303-1312.
KIMURA, M., and G. H. WEISS, 1964 The stepping stone model of population structure and the decrease of genetic correlation with distance. Genetics 49: 561-576.
KOJIMA, K., 1959 Stable equilibria for the optimum model. Proc. Natl. Acad. Sci. U.S. 45:
989-993.
LEWONTIN, R. C., 1964 The interaction of selection and linkage. 11. Optimum models. Genetics
50: 757-782.
NEI, M., and Y. IMAIZUMI, 1966 Genetic structure of human populations. 11. Differentiation of blood group gene frequencies among isolated populations. Heredity 21 : 183-190. NEWCOMBE, H. B., and J. F. MCGREGOR, 1964 Learning ability and physical well-being in
offspring from rat populations irradiated over many generations. Genetics 50: 1065-1081. ROBERTSON, A., 1959 The effect of selection against extreme deviants based on deviation o r o n
homozygosis. J. Genet. 54: 236-248.
-
1962 Selection for heterozygotes in small populations. Genetics 47: 1291-1300.TOBARI, I., and M. NEI, 1965 Genetic effects of X rays on quantitative characters in a hetero- geneous population of Drosophila melanogaster. Genetics 52 : 1007-1015.
WRIGHT, S., 1931 Evolution in mendelian populations. Genetics 16: 97-159.
-
1935 The analysis of variance and the correlations between relatives with respect to deviations from a n optimum. J. Genet. 30: 243-256.-
1937 The distribution of gene frequencies in populations. Proc. Natl. Acad. Sci. U.S. 23: 307-320.-
1943 Isolation by distance. Genetics 28: 114-138.The Genetical Theory of Natural Selection. Clarendon Press, Oxford.
: 480487.
APPENDIX: CHANGE O F LINKAGE DISEQUILIBRIUM, OWING TO MUTATION
The departure from a random combination of gene frequencies may be measured by the so-called linkage disequilibrium. For two loci each with two alleles A, a and B , b this linkage disequilibrium is defined as
GE N E T I C VARIATION A N D P O P U L A TI O N SIZE 781
where P , Q, R, and S stands for the frequencies of gametes AB, Ab, aB and ab respectively. If the mutation rates of a -+ A and b + B are each m, and those of A + a and B + b are rn2, the transition matrix of gamete frequencies due to mutation become as given in Table 2. Thus, neglecting the second order terms of mutation rate, we have
AP = -2m,P
+
m, (Q+R)AQ = m2
P-4)
- m,( Q 4 t
AS = m2(Q+R) - 2m,S
AR z m2 (P-R)
-
m, (R-S)where AP, AQ, AR, and A S are the amounts of changes of P, Q, R, and S, respectively, due to mutation. The amount of change of D i s then obtained as follows:
aD aD aD ao
ap
aQ
aRas
AD = - AP+
-
AQ i--
AR -f--
AS= --2(m,
+
m 2 ) DThis indicates that the change of linkage ise equilibrium is always such as to reduce the pre- existing disequilibrium,
As seen from the above, mutation has an effect analogous to that of recombination. When there is no selection, therefore, we have
D , = (l--r-9rn-2m2)~Do
where D , is the linkage disequilibrium in the tth generation and r stands for the recombination value between the two loci. Hence, a continuous exposure to radiation would speed up the breakdown of linkage disequilibrium.
TABLE 1
Selectinn coeficients employed for numrical c ~ m ~ u ~ a t ~ o ~
0 '
Case number Type of selection S h N = 0 N z f f i
(1
1
Neutral 0 0 0.5 0.5( 2 ) Overdominant 0 -0.01 0.5 0.5
( 3 ) Overdominant 0 -0.001 0.5 0.5
(4.) Neutral 0 - 0 0.7 0.7
(5) Overdominant 0.013397 -0.01 0.5 0.7
( 6 ) Overdominant 0.001397 -0.001 0.5 0.7
( 7 ) Overdominant 0.000197 -0.oo01 0.5 0.7
( 8 ) Recessive 0.000063 0 0.5 0.7
.___
(9) Neutral 0 0 0.9 0.9
(10) Overdominant 0.08089 -0.01 0.5 0.9 -0.001 0.5 0.9
112) Recessive 0 . 0 ~ 8 9 0 0.5 0.9
(13) Genic 0.0001 78 0.000089 0.5 0.9
(14) Overdominant 0.013333 -0.01 0.7 0.7
(15) Overdominant 0.001333 -0.001 0.7 0.7
(11) Overdominant 0.00889
(16) Overdominant 0.08032 -0.01 0.9 0.9
(171 Overdominant 0.00832 -0.001 0.9 0.9
TABLE 2
Transition matrix of gamete frequencies due to mutation
AB Ab aB ab