Optimal Sparse Singular Value Decomposition for
High-dimensional High-order Data
Anru Zhang and Rungang Han∗ University of Wisconsin-Madison
September 9, 2018
Abstract
In this article, we consider the sparse tensor singular value decomposition, which aims for dimension reduction on high-dimensional high-order data with certain sparsity structure. A method named sparse tensor alternating thresholding for singular value decomposition (STAT-SVD) is proposed. The proposed procedure features a novel double projection & thresholding scheme, which provides a sharp criterion for thresholding in each iteration. Compared with regular tensor SVD model, STAT-SVD permits more robust estimation under weaker assumptions. Both the upper and lower bounds for estimation accuracy are developed. The proposed procedure is shown to be minimax rate-optimal in a general class of situations. Simulation studies show that STAT-SVD performs well under a variety of configurations. We also illustrate the merits of the proposed procedure on a longitudinal tensor dataset on European country mortality rates.
Keywords: high-dimensional high-order data, projection and thresholding, singular value de-composition, sparsity, Tucker low-rank tensor.
∗
Anru Zhang is Assistant Professor, Department of Statistics, University of Wisconsin-Madison, Madison, WI 53706, E-mail: [email protected]; Rungang Han is PhD student, Department of Statistics, University of Wisconsin-Madison, Madison, WI 53706, E-mail: [email protected]. The research of Anru Zhang is supported in part by NSF Grant DMS-1811868.
1
Introduction
High-dimensional high-order data, i.e., values arranged in large-scale tensors along three or more directions, commonly occur in a broad range of applications due to revolutionary developments in science and technology. These data possess distinct characteristics compared with the traditional low-dimensional or low-order data and pose unprecedented challenges to various communities, including statistics, machine learning, applied mathematics, and electrical engineering. To bet-ter summarize, visualize, and analyze high-dimensional high-order data, a sufficient dimension reduction often becomes the crucial first step. Therefore, how to effectively exploit the low-rank structure from high-dimensional high-order observations is often an important task.
To this end, the framework of tensor SVD (or tensor PCA) has been introduced and exten-sively studied recently (Allen, 2012b; Richard and Montanari, 2014; Anandkumar et al., 2016; Zhang and Xia, 2018; Liu et al., 2017; Wang and Song, 2017). Suppose one is interested in an order-dlow-rank tensor of dimensionp1×· · ·×pd, which is observed with entry-wise additive noise
ZasY=X+Z. Assume the fixed tensorXis low-rank in the sense that the fibers ofXalong dif-ferent directions (i.e., the counterpart of rows and columns for matrix) all lie in low-dimensional subspaces, say U1, . . . , Ud. The goal of tensor SVD is to estimate the loadings U1, . . . , Ud and
underlying low-rank tensorX. Under the regular tensor SVD setting, several practical methods have been introduced and studied, including High-order SVD (HOSVD) (De Lathauwer et al., 2000a), High-order Orthogonal Iteration (HOOI) (De Lathauwer et al., 2000b), sum-of-square scheme (Hopkins et al., 2015), homotopy or continuation method (Anandkumar et al., 2016). Using lower bound arguments, Richard and Montanari (2014) and Zhang and Xia (2018) showed that the signal-noise-ratio (SNR) ≥ Cmax{p1, p2, p3}1/2 is required to ensure that consistent
estimation is statistically possible; and SNR ≥ Cmax{p1, p2, p3}3/4 may be further necessary
for computationally efficient methods. However in many applications, such conditions, i.e., SNR is no less than a polynomial of dimension p, are often too restrictive to satisfy.
Moreover, in many applications, the leading singular/eigenvectors of the high-dimensional high-order data may satisfy intrinsic structural assumptions along certain ways. We have seen the need for singular value decomposition in a number of modern tensor data applications, where sparsity plays an essential role. For example, in high-order longitudinal study, since observations
often come as multivariate functions of time, (e.g. country-wise fertility and death rates by the calendar year and age (Wilmoth and Shkolnikov, 2006)), the leading singular vectors along the mode of calendar year or age are expected to be smooth, and therefore becomes sparse after differential transformation; in Electroencephalogram (EEG) data analysis, the brain electrical activities are measured and stored as multi-way data with three or more modes representing channels, time, and patients, etc. It is often believed that some parts of brain region are more active and vary through time smoothly, then the leading singular vectors may be sparse along the channel mode and smooth along time mode (Miwakeichi et al., 2004); in imaging ensemble analysis, facial images are often stored as high-dimensional high-order tensors. To sufficiently reduce the dimension, one looks for low-dimensional subspaces that can best explain the possibly sparse facial features and suppress illumination effects such as shadows and highlights (Vasilescu and Terzopoulos, 2003). How to incorporate these structural assumptions wisely to improve the performance of subsequent statistical analyses is crucial for singular value decomposition in tensor data analysis. Such a problem, however, has not been well studied or understood in previous literature.
In this article, we aim to fill this gap by developing methodology and theory forsparse tensor SVD. In addition to the regular tensor SVD model, we assume that the underlying low-rank structureXsatisfies some sparsity constraints. As mentioned above, the data are not necessarily sparse along all modes in practice (for example, it is not reasonable to assume sparsity for the patient mode in EEG data or subject mode in high-order longitudinal data). To allow more flexibility, we suppose there exists a subset Js ⊆ {1, . . . , d} such that part of the loadings
{Uk : k ∈ Js} contains certain row-wise sparsity structures. The detailed formulation of the
sparse tensor SVD model is introduced in Section 2.
To better illustrate the nature and difficulty of sparse tensor SVD problem, it is also helpful to discuss its order-2 counterpart, matrix sparse singular value decomposition, for comparison. The framework of matrix sparse singular value decomposition, which focuses on extracting si-multaneously sparse and low-rank matrix structure from high-dimensional matrix data, has been introduced and extensively studied during the past decade (see Lee et al. (2010); Yang et al. (2014, 2016) and the references therein). In addition, sparse principal component analysis, a closely connected topic, has also been considered in Zou et al. (2006); Shen and Huang (2008);
Johnstone and Lu (2009); Cai et al. (2013). In contrast, sparse tensor SVD is much more in-volved and difficult than sparse matrix SVD and regular tensor SVD in many aspects. First, classical methods for matrix data are often not directly applicable to high-order data. Many previous works approach the tensor problem by vectorizing or matricizing high-order data (or intuitively speaking, stretching the data cubes into matrices or vectors) so that high-order prob-lems are transformed into vector or matrix ones. However, since high-order structures can get lost in the process of simple vectorizing or matricizing, one may only obtain sub-optimal results in the subsequent analyses. Second, some straightforward extensions from sparse matrix SVD methods, such as sparse HOSVD, sparse HOOI, or a single projection & thresholding scheme, does not perform optimally in general. Third, as pointed out by the seminal work of Hillar and Lim (2013), many basic concepts or methods for matrix data cannot be directly generalized to the high-order ones. Naive extensions of concepts such as operator norm, singular values, and eigenvalues are mathematically possible but computationally NP-hard.
To overcome these difficulties, we propose a procedure named Sparse Tensor Alternating Truncation for Singular Value Decomposition (STAT-SVD) for sparse tensor SVD in this paper. The method consists of two steps: (i) a thresholded spectral initialization and (ii) an iterative alternating updating scheme. One crucial part of the procedure is a novel double projection & thresholding scheme, which provides a sharp criterion for thresholding in each iteration. Since each step of STAT-SVD only involves basic matrix and tensor operations, such as matricization, multiplication, matrix SVD, and thresholding, the proposed procedure can be implemented efficiently.
We study both the theoretical and numerical properties of the proposed procedure. We prove by an upper bound argument that the STAT-SVD estimator can recover the low-rank structures accurately. A lower bound is further developed to show that the proposed estimator is rate optimal for a general class of simultaneously sparse and low-rank tensors. To the best of our knowledge, we are among the first ones to study the method and theory for sparse tensor SVD with matching upper and lower bound results. The numerical results show that the STAT-SVD outperforms other more naive methods, such as regular HOOI, HOSTAT-SVD, sparse HOOI, and sparse HOSVD, by achieving significantly smaller estimation errors within much shorter running time. We also illustrate the merit of STAT-SVD in the analyses of high-order mortality
rate data.
The rest of this article is organized as follows. After a brief introduction of the notations and preliminaries, we formally introduce the sparse tensor SVD model in Section 2. Then we propose the methodology for sparse tensor SVD in Section 3. The theoretical properties of the proposed procedure are developed in Section 4. The data-driven hyperparameter selection is discussed in Section 5. Numerical performance of the proposed methods is studied through both simulation studies and the real data analyses on high-order mortality rate dataset in Section 6. Finally, further discussions, proofs of the technical results, and supporting theoretical tools are postponed to the supplementary materials.
2
Problem Formulation
2.1 Notations and Preliminaries
We start this section with notations and preliminaries that will be used throughout the paper. The lowercase letters, e.g. x, y, u, v, are used to denote scalars or vectors. For any a, b∈R, let
a∧banda∨bbe the minimum and maximum ofaandb, respectively. For convenience, we denote
p= (p1, . . . , pd), r = (r1, . . . , rd), s= (s1, . . . , sd), and p =p1· · ·pd, s=s1· · ·sd, r=r1· · ·rd.
For any 1≤k≤p, we also note p−k =Ql6=kpl, s−k =Ql6=ksl, r−k =Ql6=krl. We use C, c and
the variations to denote generic constants, whose actual values may change from line to line. The uppercase letters are used to note matrices. ForA∈Rm×n, we assume the singular value
decomposition isA=P
iσiuivi>, whereσ1≥σ2≥ · · · ≥0 are the singular values in descending
order. Denote σi(A) =σi as the i-th largest singular value of A. Particularly, the largest and
smallest non-trivial singular values: σmax(A) = σ1(A) and σmin(A) =σm∧n(A) play important
roles in our analysis. We also define SVDr(A) = [u1, . . . , ur] as the matrix comprised of the top
r left singular vectors of A. Let the collections of regular and sparse orthogonal matrices be
Op,r={U ∈Rp×r :U>U =Ir},Op,r(s) ={U ∈Rp×r:U>U =Ir,kUk0=Pip=11{U[i,:]6=0} ≤s}.
These orthogonal matrices are extensively used in later narratives.
or higher. For anyS∈Rr1×···×rd and U
k∈Rpk×rk, the mode-ktensor-matrix product is defined as
S×kUk∈Rr1×···×rk−1×pk×rk+1×···×rd, (S×kUk)i1,...,id =
rk X
jk=1
Si1,...,jk,...,idUik,jk.
Multiplication along different directions is commutative invariant, i.e., (S×k1 Uk1)×k2 Uk2 =
(S×k2 Uk2)×k1Uk1 fork1 6=k2. For convenience, the tensor product along alldmodes is applied
S×1U1× · · · ×dUd:=JS;U1, . . . , UdK.
Matricization is a basic tensor operation that transforms tensors to matrices. Particularly the mode-1 matricization for any X∈Rp1×···×pd is defined as
M1(X)∈Rp1×p−1, where [M1(X)]i1,i2+p2(i3−1)+···+p2···pd−1(id−1)=Xi1,...,ip.
The general mode-k matricization can be defined similarly. The readers are referred to Kolda and Bader (2009) for a more comprehensive tutorial for tensor algebra.
We also use the R syntax to denote sub-vectors, -matrices, and -tensors. For example,A[I1,I2]
is used to note the sub-matrix with row indices I1 and column indicesI2 of A. In addition, for
any integers a ≤b, we use “a: b” to represent consecutive sequence {a,· · · , b}; and “:” alone represents the entire index set. Thus,A[:,1:r]represents the firstrcolumns ofAwhileA[(s1+1):p1,:]
represents the {(s1+ 1), . . . , p1}-th rows with indices {(s1+ 1), . . . , p1}. Similar notations are
also applied to sub-vectors and sub-tensors.
2.2 Sparse Tensor SVD Model
Now we formally introduce the sparse tensor SVD model. Suppose one observes a (p1× · · · ×pd
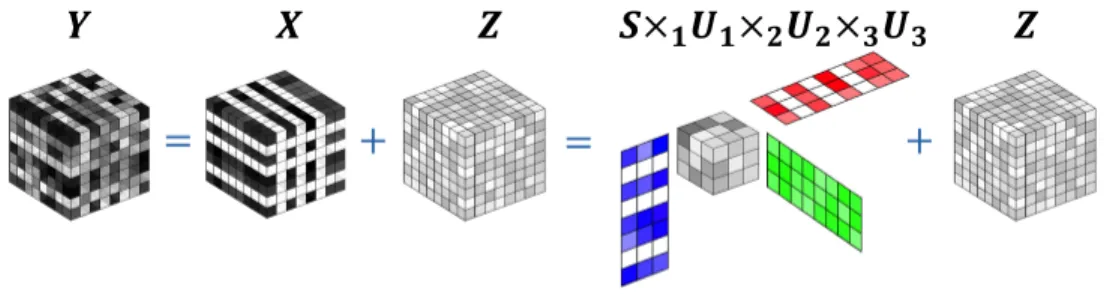
)-dimensional tensor Y with additive noise, sayY=X+Z. Here,X is a low-rank tensor in the sense that all fibers along each direction lie in some low-dimensional subspace, Z consists of i.i.d. Gaussian noises with mean zero and variance σ2. Given the connection between Tucker low-rank and Tucker decomposition (Tucker, 1966; Kolda and Bader, 2009), the model can be further written as
Figure 1: Illustration of sparse tensor SVD model. Here, X is sparse along Modes-1 and -3.
with S ∈ Rr1×···×rd and {U
k ∈ Opk,rk}
d
k=1 being the unknown core tensor and Mode-1, . . . , k
loadings, respectively. Especially,Uk is also the singular subspace ofXalong thek-th direction.
RecallOp,r andOp,r(s) are the classes of regular and sparse orthogonal columns. Given previous
discussions, suppose a subset Js ⊆ {1, . . . , d} is known a priori, such that the mode-k loading
Uk for anyk∈Js issk-sparse,
Uk∈
Opk,rk(sk), k∈Js;
Opk,rk, k /∈Js.
To be more flexible, we set sk = pk if there is no sparsity constraint in the k-th Mode, i.e.,
k /∈Js. The central goal is to estimate singular subspacesU1, . . . , Ud, and the original low-rank
tensorXbased on observationsY. See Figure 1 for a pictorial illustration of sparse tensor SVD model.
Remark 1 It is worth mentioning that our framework is related but distinct from the CP low-rank-based decomposition framework in literature (see De Silva and Lim (2008); Kolda and Bader (2009); Anandkumar et al. (2014a,b); Sun et al. (2015); Sun and Li (2017); Wang et al. (2017); Hao et al. (2018) and the references therein). Since the main focus of tensor SVD analysis is to sufficiently reduce the high-order data onto low-dimensional subspaces, the Tucker low-rank structure provides a more natural fit based on the interpretation of Tucker decomposition that we have mentioned above. Additionally, it is known that any CP rank-rtensor must be of Tucker rank at mostr, but the opposite of this statement is not generally true (Kolda and Bader, 2009). Therefore, we mainly pursue the more general Tucker low-rank model (1) rather than the CP one, with distinct methodologies and theories developed for the rest of this paper.
3
The STAT-SVD Procedure
Next, we propose the procedure for sparse tensor singular value decomposition. Note that Uk
in the sparse tensor SVD model (1) is not only the mode-ksingular subspace of Xbut also the left singular subspace of Mk(X), a straightforward idea for initialization is
˜
Uk(0) = SVDrk(Mk(Y)).
This method, originally introduced by De Lathauwer et al. (2000a), has been widely referred to as high-order SVD (HOSVD) and used in numerous scenarios. However, ˜Uk(0) may fail to provide any consistent estimations or even warm starts, unless one has strong SNRλ/σ≥Cp3/2
(Zhang and Xia, 2018), where λ = mink=1,2,3σrk(Mk(X)). An alternative idea is to apply `1 regularized estimation to encourage sparsity (Allen, 2012a,b),
ˆ
U1,Uˆ2,Uˆ3 = arg min
U1,U2,U3
kY−S×1U1×2U2×3U3k2F +λ
X
k∈Js
kUkk1.
Both the computation and theoretical analysis for the regularized MLE may be difficult. Instead, we propose a procedure with a novel double thresholding & projection scheme as follows.
Step 1 (Initialization: support) Let Yk=Mk(Y) be the matricization ofY fork= 1, . . . , d. Recall
p−k=p1· · ·pd/pk,p=p1· · ·pd. Fork= 1, . . . , d, select the index sets for all sparse modes,
ˆ
Ik(0) = (
i:(Yk)[i,:]
2 2 ≥σ
2p
−k+ 2
p
p−klogp+ 2 logp
or max
j |(Yk)[i,j]| ≥2σ
p logp
)
, k∈Js.
(2)
Ideally speaking, ˆIk(0) provides an initial estimate for the support of {Uk : k ∈ Js}, which
captures the significant signals of X but may miss the weak ones. For k /∈ Js, we select
ˆ
Ik(0)={1, . . . , pk}.
Step 2 (Initialization: loadings) Construct
˜
Y ∈Rp1×···×pd, Y˜
[i1,...,id]=
Y[i1,...,id], (i1, . . . , id)∈Iˆ1(0)⊗ · · · ⊗Iˆ (0)
d ;
0, otherwise,
and initialize
ˆ
Uk(0) = SVDrk
Mk( ˜Y)
Then ˆUk(0) provides a rough estimate for Uk. The initialization step is illustrated in Figure 3
(a).
Step 3 (Power Iteration and Alternating Thresholding) Provided a reasonable initialization by thresh-olded spectral method, we consider an iterative alternating scheme to refine the estimation. Suppose we aim to update ˆUk(t)→Uˆk(t+1) for some specific k= 1, . . . , dand t= 0,1, . . .. The updating scheme is discussed under two scenarios.
• If the targeting mode, say Mode-2, is non-sparse, we can update by orthogonal projection
A(2t)=M2rY; ( ˆU1(t+1))>, Ip2,( ˆU
(t) 3 )
>, . . . ,( ˆU(t)
d )
>z∈
Rp2×r−2. (3)
Ideally speaking, the dimension of Y is significantly reduced from p1· · ·pd to p2×r−2,
while the majority of signal X can be preserved in A(2t) after such a projection. Then we update
ˆ
U2(t+1)= SVDr2 A
(t) 2
.
See Figure 3 (b) for an illustration.
• If the targeting mode, say Mode-1, is sparse, we apply a double projection & thresholding scheme for refinement (see Figure 3 (c)). We still perform projection first,
(1st Projection) A(1t) =M1rY;Ip1,( ˆU
(t) 2 )
>, . . . ,( ˆU(t)
d )
>z∈
Rp1×r−1.
Then A(1t) is denoised by row-wise hard thresholding,
(1st Thresholding) B1(t)∈Rp1×r−1, B1(t,[)i,:]=A1(t,)[i,:]1{kA(t)
1,[i,:]k
2
2≥η1}, 1≤i≤p1,
where the thresholding level η1 = σ2(r−1 + 2
p
r−1logp+ 2 logp) is determined by the
quantile of kA(1t,)[i,:]k2
2 if the i-th row of A (t)
1 does not contain any signal. SincekA1,[i,:]k22 ∼
σ2χ2r2 ≈ σ2r2 when A1,[i,:] are pure noise, an η1 induced by kA1,[i,:]k22 can be as large as ≈σ2r−1, which may falsely kill many rows with weak signals. In order to lower the large
thresholding level, we introduce the second projection and thresholding: let the leading r1
right singular vectors ofB1(t)be ˆV1(t), i.e., ˆV1(t)= SVDr1(B
(t)>
1 ), then we further reduce the
dimension of p1-by-r−1 matrixA(1t) top1-by-r1 matrix ¯A(1t) by performing right projection,
(a) Initilaization
(b) Dense mode update
(c) Sparse mode update
and apply the second thresholding
(2nd Thresholding) B¯(t) ∈Rp1×r1, B¯(t)
1,[i,:] = ¯A1,[i,:]1{kA(t)
1,[i,:]k22≥η¯1}
,
with much smaller thresholding value ¯η1 =σ2 r1+ 2 √
r1logp+ 2 logp
, given the reduced dimension of ¯A(1t). As we will illustrate in theoretical analysis, the double projection & thresholding scheme provides more accurate denoising performance. It is also noteworthy that a similar version of double thresholding appears in recent high-dimensional clustering literature (Jin and Wang, 2016), although their problem, method, and theory were all different from ours. Finally, we update ˆU1 by QR decomposition
ˆ
U1(t+1) = QR( ¯B1(t)).
Step 4 The iteration is stopped until the maximum number of iteration is reached (i.e. t > tmax), or
convergence, i.e. the following criterion holds,
B¯
(t)
k
2
F −
B¯
(t−5)
k
2
F < εtol.
Hereεtolis the maximum tolerance, which can be chosen empirically. Finally, we propose the
denoising estimator for X as
ˆ
X=Y×1( ˆU1>)× · · · ×d( ˆUd>).
The pseudo-code for the proposed STAT-SVD method is provided in Algorithm 1. We partic-ularly summarize the double projection & thresholding scheme for the sparse mode update in Algorithm 2.
4
Theoretical Analysis
In this section, we analyze the theoretical properties of the proposed procedure in the previous section. The sin Θ distances are adopted to quantify the singular subspace estimation errors. Particularly for any U, V ∈ Op,r, the principal angles between U and V is defined as an r
-by-r diagonal matrix: Θ(U, V) = diag(cos−1(σ1(U>V)), . . . ,cos−1(σr(U>V))). Then the sin Θ
Frobenius norm ksin Θ(U, V)kF =
q
r− kU>Vk2
Algorithm 1 Sparse tensor alternating thresholding - SVD (STAT-SVD)
1: Input: order-dtensor data Y∈Rp, rankr, noise levelσ2, set of sparse modesJ
s.
2: (Initialization) Let Yk =Mk(Y). Select subset ˆIk(0) by
ˆ
Ik(0) =
n
1≤i≤pk :
(Yk)[i,:]
2 2 ≥σ
2 p
−k+ 2
p
p−klogp+ 2 logp
or maxj|(Yk)[i,j]| ≥2σ √
logp
o
, k∈Js;
{1, . . . , pk}, k /∈Js.
3: Sett= 0. Calculate the initializations
ˆ
Uk(0)= SVDrk
Mk( ˜Y)
, where Y˜ =
Yi1,...,id, (i1, . . . , id)∈Iˆ
(0)
1 ⊗ · · · ⊗Iˆ (0)
d ;
0, otherwise.
4: while t < tmax or convergence criterion not satisfieddo 5: fork= 1, . . . , ddo
6: if k∈Js then
7: (Sparse mode update) Update ˆUk(t+1) via Algorithm 2;
8: else
9: (Dense mode update) Calculate
A(kt+1) =MkJY; ( ˆU1(t+1))>, . . . ,( ˆUk(t−+1)1 )>, Ipk,( ˆU
(t)
k+1)
>, . . . ,( ˆU(t)
d )
> K
.
10: Update as ˆUk(t+1) = SVDrk
A(kt+1)
.
11: end if
12: end for 13: t=t+ 1.
Algorithm 2 Update Scheme in STAT-SVD – Sparse Mode
1: Input: Y, ˆUk(+1t) , . . . ,Uˆd(t),Uˆ1(t+1), . . . ,Uˆk(−t+1)1 , rank rk.
2: (First Projection) Calculate
A(kt) =MkJY; ( ˆU1(t+1))>, . . . ,( ˆUk(t−+1)1 )>, Ipk,( ˆU
(t)
k+1)
>
, . . . ,( ˆUd(t))>K
.
3: (First Thresholding) Perform row-wise thresholding for A(kt+1):
Bk(t+1) ∈Rpk×r−k, B(t)
k,[i,:]=A (t+1)
k,[i,:]1nkAk,(t+1)[i,:]k2
2≥ηk
o, 1≤i≤pk,
whereηk =σ2 r−k+ 2
p
r−klogp+ 2 logp
.
4: (Second Projection) Extract the leadingrk right singular vectors of Bk(t)
ˆ
Vk(t+1) = SVDrk
Bk(t+1)>∈Opk,rk,
then project as ¯A(kt+1) =A(kt+1)Vˆk(t+1) ∈Rpk×rk.
5: (Second thresholding) Perform thresholding on ¯Bk(t+1),
¯
Bk(t+1) ∈Rpk×rk, B¯(t+1)
k,[i,:] = ¯A (t+1)
k,[i,:]1nkAk,(t+1)[i,:]k2
2≥η¯k
o, 1≤i≤pk,
where ¯ηk =σ2 rk+ 2
√
rklogp+ 2 logp
.
between U and V. The readers are referred to (Cai and Zhang, 2018, Lemma 1) for more discussions on the properties of sin Θ distance.
Theorem 1 (Upper bound) Suppose r, σ2 are known, logp
1 · · · logpd, and for 1 ≤
k ≤d, λk =σrk(Mk(X))≥ C0σ (slogp)
1/2+P
kskrk+ max1≤k≤dr−k
. Then after at most O(dslogp) iterations, the proposed Algorithm 1 yields the following estimation error upper bound,
Xˆ −X
2
F ≤Cσ
2
d
Y
l=1
rl+
X
k
skrk+
X
k∈Js
sklogpk
. (4)
sin Θ
ˆ
Uk, Uk
2
F ≤
Cσ2(s
krk+sklogpk)/λ2k ∧rk, k∈Js,
Cσ2p
krk/λ2k ∧rk, k /∈Js,
(5)
with probability at least 1− C(p1+···+pd) log(slogp)
p1···pd . Here C >0 is some uniform constant, which
does not depend on σ,p,r,s.
Remark 2 The estimation error upper bound (4) is comprised of three terms: σ2Qd
l=1rl,
σ2skrk, andσ2sklog(pk), which correspond to the estimation complexity for the core tensor S,
the values of loading Uk, and the support of Uk (only for sparse modes), respectively. On the
other hand, the signal strength assumptionσrk(Xk)≥Cσ (slogp)
1/2+P
kskrk+ max1≤k≤dr−k
involvesponly in the logarithmic term. Compared with the assumptionσrk(Xk)≥σmax{p1, p2, p3}
3/4
that is required in regular tensor SVD, our proposed algorithm is able to handle high-dimensional settings under much weaker conditions.
Remark 3 (Proof sketch for Theorem 1) Since the proof of Theorem 1 is lengthy and highly non-trivial, we briefly discuss the sketch here. First, a number of conditions are in-troduced as the baseline assumptions (Step 1). Under these conditions, we try to establish the upper bound for the initial estimate:
ksin Θ( ˆUk(0), Uk)k ≤c and k( ˆUk(0)⊥) >M
k(X)kF ≤C
p
slogp
for constants 0< c <1/2 andC >0 (Step 2), then develop the upper bound for estimates after each iteration:
sin Θ( ˆU
(t+1)
k , Uk)
F
≤ √
skrk+
√
sklogp·1{k∈Js}
λk/σ
+C
√
slogp λk/σ
and ( ˆU
(t)
k⊥) >
Xk
F ≤Cσ
√
skrk+Cσ
p
sklogp·1{k∈Js}+Cσ p
slogp·τt.
for some constant 0 < τ ≤ 1/2 (Step 3). Then after a number of iterations, the error rate sufficiently decays. One obtain final estimators ˆU(tmax)
k and ˆX(tmax) that achieve the targeting
upper bounds of estimation error (Steps 4 and 5). Finally, we use a coupling scheme to show that the introduced conditions hold with high probability (Step 6).
Remark 4 (Performance of Single Projection & Truncation Scheme) As discussed ear-lier, the proposed double projection & thresholding scheme is crucial to the performance of STAT-SVD. Such a scheme is essential in the sense that the simple single projection & thresh-olding, which may be a more straightforward extension from matrix sparse SVD method, may yield sub-optimal results. To be specific, suppose ˜Xis the estimator with single thresholding & projection (see Algorithm 3 in Appendix for detailed explanations), Theorem 5 in the Appendix shows that there exists a low-rank tensorX that satisfies all assumptions in Theorem 1, but ˜X
yields a higher rate of convergence in the sense that
EkX˜ −Xk2F ≥Cσ2
Y
l
rl+
X
k
skrk+
X
k∈Js
sklogpk+
X
k∈Js
sk(r−klogpk)1/2
.
Next, we study the statistical lower bound for sparse tensor SVD. Consider the following class of sparse and low-rank tensors,
Fp,r,s(Js) =
X=JS;U1, . . . , UdK∈R
p1×···×pd: rank(X)≤(r1, . . . , rd),
ksupp(Uk)k0≤sk fork∈Js
.
The following lower bound results hold for sparse tensor SVD.
Theorem 2 (Lower Bound: Subspace Estimation) Supposesk≥3rk, consider the
follow-ingkclasses of sparse and low-rank tensors with least singular value constraint on matricization,
Fp(k,r),s(Js, λk) ={X∈ Fp,r,s(Js) :σrk(Mk(X))≥λk}, k= 1, . . . , d.
Then, for any fixed k, we have
inf
ˆ
Uk
sup
X∈Fp(k,r),s(Js,λk) sin Θ
ˆ
Uk, Uk
2
F ≥c
σ2skrk
λ2
k
+σ
2s
klog(pk/sk)
λ2
k
·I{k∈Js}
Theorem 3 (Lower bound: Tensor Recovery) Suppose sk ≥3rk for any k. Consider the
tensor recovery over the class of sparse and low-rank tensors Fp,r,s(Js), there exists uniform
constant c >0 such that
inf
ˆ X
sup
X∈Fp,r,s(Js) ˆ
X−X
2
F
≥cσ2
d
Y
k=1
rk+ d
X
k=1
skrk+
X
k∈Js
sklog (pk/sk)
.
Theorems 1, 2, and 3 together show the proposed STAT-SVD method achieves the optimal rate of convergence in the general class of sparse low-rank tensors when log (pk/sk) logpk, for
k∈Js.
5
Data-driven Hyperparameter Selection
In practice, the proposed procedure requires the input of hyperparametersσ2 and (r1, r2, . . . , rd).
Since Y = X+Z and a significant portion of entries of X are zeros, the data-driven median estimator (Yang et al., 2016) can be used to estimate σ: ˆσ = Median(|Y|)/0.6744. Here 0.6744 is the 75% quantile of standard normal distribution. We have the following theoretical guarantee for ˆσ.
Proposition 1 (Concentration Inequality of σˆ2) Letσˆ= Median(|Y|)/z0.75. Ifs=o( √
plogp), then there exists universal constants C and c, such that
P
|σˆ−σ|
σ ≤c
s logp
p
!
≥1−C/p. (6)
Now we consider the data-driven selections of (r1, . . . , rd). Recall that we directly threshold
on each mode and obtain ˜Y in the initialization step of Algorithm 1. We propose to select (r1, . . . , rd) based on the singular values of ˜Y,
ˆ
rk= max
r:σr(Mk( ˜Yk))≥σδˆ |Iˆ(0)
k |,|Iˆ
(0)
−k|
. (7)
Here, δij = 1.02
√
i+√j+q2ilogepk
i + 2jlog ep−k
j + 4 logpk
and ˆσ is the estimated stan-dard deviation. Under regularity conditions, one can show that (ˆr1, . . . ,rˆd) match the true ranks
Proposition 2 Under the conditions of Theorem 1 and Proposition 1, we haverˆk=rkfor each
k= 1, . . . , d with probability at least 1−O((p1+· · ·+pd)/p1−δ) for any δ >0.
If neither σ nor {rk}dk=1 are known, we can first estimate σ by MAD estimator ˆσ, then
estimate {rk}dk=1 by (7), and feed all the estimations to Algorithm 1. We have the following
theoretical guarantee for this fully data-driven method.
Theorem 4 Suppose we set σ = ˆσ and rk = ˆrk in Algorithm 1. If s = o(
√
plogp), the conclusion of Theorem 1 holds with probability at least 1 −O (p1+· · ·+pd)/p1−δ
for any δ >0.
Remark 5 Similarly as some previous works on distribution-based methods for principal com-ponent number selection (Choi et al., 2017), the performance of the proposed ˆσ and ˆrk may rely
on specific Gaussian noise assumptions. In scenarios with general noise, some more empirical schemes can be applied. For example, to estimate σ, one can trim a portion of entries from
Y with largest absolute values, and evaluate the trimmed variance σˆ2 as the sample variance for remaining entries (Serfling, 1984); for rk, we can apply the cumulative percentage of total
variation criterion (Jolliffe, 2002, Chapter 6.1.1) – a commonly used in principal component analysis literature:
ˆ
rk= arg min
r : Pr
i=1σi2(Mk(Y))
Ppk
i=1σi2(Mk(Y))
> ρ
.
Here,ρ∈(0,1) is an empirical thresholding level.
6
Numerical Analysis
6.1 Simulation Studies
We evaluate the numerical performance of the proposed STAT-SVD method by simulation stud-ies on various synthetic datasets. In each setting, we first generate an r1-by-r2-by-r3 tensor
¯
S with i.i.d. standard normal entries, then rescale ¯S as S = ¯S·λ/min1≤k≤3σrk(Mk(¯S)) to ensure that σrk(Mk(S)) ≥ λ. For k = 1,2,3, we generate singular subspaces ¯Uk and indices subsets Ωtwith cardinalityskuniformly at random fromOsk,rk and{1, . . . , p}, respectively. The
combination of ¯Uk and Ωk
(Uk)[i,:]=
( ¯Uk)[j,:], i∈Ωk, and iis the j-th element of Ωk;
0, i /∈Ωk.
yields a uniformly random sparse singular subspace inOpk,rk(sk). LetX=S×1U1×2U2×3U3,
Z iid∼ N(0, σ2), and Y = X+Z be the underlying parameter, noise, and observation tensors. To examine the performance of STAT-SVD, we apply the proposed Algorithm 1 along with four baseline methods, HOSVD, HOOI, sparse HOSVD HOSVD), and sparse HOOI (S-HOOI), on the same synthetic data for comparison. Here, HOSVD and HOOI are classical methods (De Lathauwer et al., 2000a,b) that have been widely used in literature. S-HOSVD and S-HOOI are the sparse modifications of HOSVD and HOOI – intuitively, S-HOSVD and S-HOOI are performed by replacing all regular matrix SVD steps in HOSVD and HOOI by sparse matrix SVD (Yang et al., 2014). The detailed implementation of S-HOSVD and S-HOOI are summarized in Section B of the supplementary materials. The experiments are repeated for 100 times in each setting.
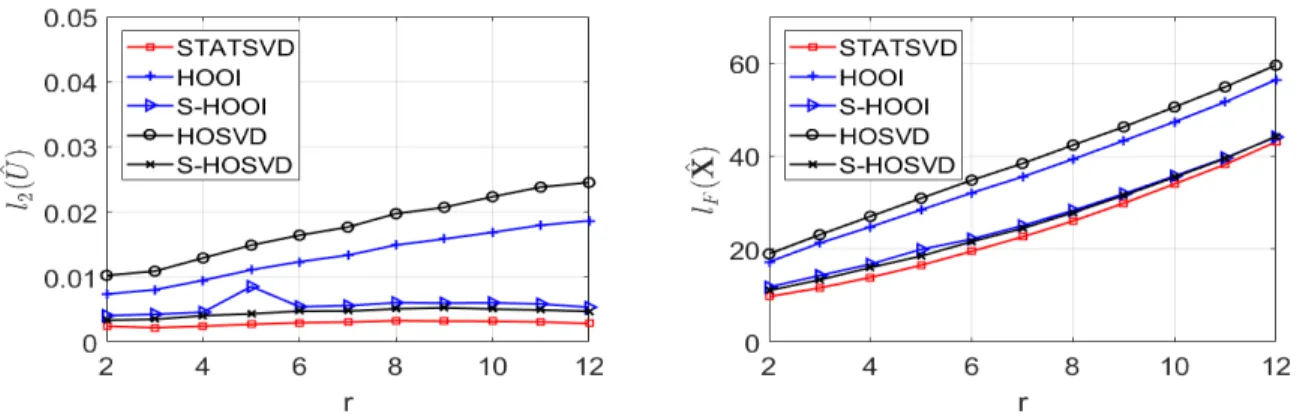
In the first simulation study, we compare the estimation errors of STAT-SVD and baseline methods (HOOI, S-HOOI, HOSVD, S-HOSVD) in average Frobenius norm,
l2( ˆU) =
1 3
3
X
k=1
sin Θ( ˆUk, Uk)
F, l( ˆX) =
kXˆ −XkF.
For hyperparameters, we use the median estimator ˆσ in STAT-SVD and all baseline methods; since sin Θ distance is one of the most important error quantification in tensor SVD analysis and one requires the correct rk to evaluate the sin Θ distance between singular subspaces, we
use the true ranksrkfor all implementations. Fixp1 =p2 =p3 = 50,s1=s2 =s3= 15,λ= 70,
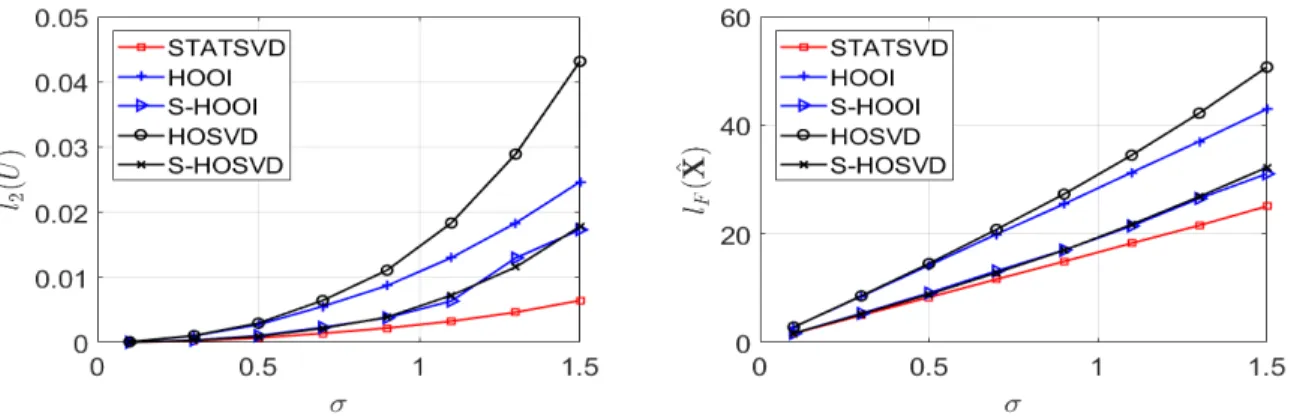
r =r1 = r2 = r3, we specifically consider two scenarios: (1) σ = 1, r varies from 2 to 12; (2)
r = 5,σranges from 0.1 to 2.5. Although the signal-to-noise ratio (SNR,λ/σ) here seems large,
λ represents the singular value of the each matricization that measures the signal strength of the whole tensor; while σ is the standard deviation of each Zijk that quantifies the noise level
of eachsingle entry. By random matrix theory (Vershynin, 2010), the singular values ofMk(Z) are aroundσ√p−k≈5 to 125, which is comparable to the signal Mk(X). As one can see from
the numerical results in Figures 3 and 4, although all methods yield smaller estimation error with smaller noise level, STAT-SVD significantly outperforms all other schemes in estimations
Figure 3: Estimation error of Uk (left panel) and X (right panel) for different methods. Here,
p1 =p2=p3= 50, s1=s2 =s3= 15, σ = 1,λ= 70, and r1 =r2 =r3=r vary.
Figure 4: Estimation error of Uk (left panel) and X (right panel) for different methods. Here,
p1 =p2=p3= 50, s1=s2 =s3= 15, r1=r2=r3 = 5,λ= 70, σ varies.
of both subspaces and original tensors.
We also consider the accuracy of hyperparameters’ estimation. Under the previous simulation setting, we examine the performance of MAD estimator ˆσ and rank estimator ˆrk in Section 5.
The results are provided in Table 1. One can see that the proposed ˆσ and ˆrkprovide reasonable
estimations. The rank estimation is particularly accurate when noise level is moderate.
In previous sections, the presentation and analysis were mostly focused on Gaussian noise case. Next, we consider the setting that the noises are uniformly distributed on [−σ√3, σ√3]. Letp1 =p2 =p3 = 50,s1 =s2=s3 = 15,r1 =r2=r3 = 5,λ= 70,σ varies from 0.1 to 1.5. As
σ 0.1 0.3 0.5 0.7 0.9 1.1 1.3 1.5
|σˆ−σ| 0.003 0.008 0.013 0.018 0.021 0.025 0.026 0.028
|ˆr−r| 0 0 0 0 0 0 0.54 0.98
rk 3 4 5 6 7 8 9 10
|σˆ−σ| 0.019 0.021 0.022 0.023 0.024 0.025 0.025 0.026
|ˆr−r| 0 0 0 0 0 0 0 0
Table 1: Rank and noise level estimation accuracy. Here,p1=p2=p3 = 50,s1=s2 =s3= 15,
λ= 70. The first three rows explore the setting where r1 =r2 =r3 = 5 with σ varies; the last
three rows consider the case with fixed σ = 1 and varying rank. The errors are averaged over 100 repetitions.
Figure 5: Estimation error ofUk(left panel) andX(right panel) with uniform distributed noise.
better performance than other methods.
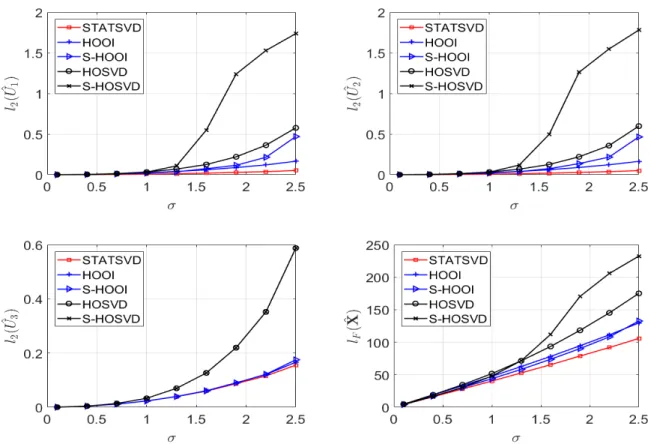
As we have discussed before, in many applications, the tensor dataset possesses sparsity structure in only part of directions. Thus, we turn to a setting thatXcontains both sparse and dense modes. Specifically, we set p1 =p2 =p3 = 50, r1 =r2 =r3 = 10,s1 =s2 = 20, λ= 60,
ands3 =p3, so thatXis sparse along mode-1, -2 and dense along mode-3. The singular subspace
estimation error with varying noise level is evaluated and shown in Figure 6. We can see STAT-SVD significantly outperforms the other methods on the estimation of sparse modes ( ˆU1 and
ˆ
U2). More interestingly, STAT-SVD also estimates the non-sparse singular subspaceU3 slightly
more accurately, especially when σ2 is large. In fact, different modes and singular subspaces of
Figure 6: Estimation error of U1 (left top), U2 (right top), U3 (left bottom) and X (right
bottom) in partial sparse setting. Here, λ = 60, p1 = p2 = p3 = 50, s3 = p3, s1 = s2 = 20,
r1=r2 =r3 = 10.
of dense mode U3 is possible when one can fully utilize the sparsity in U1 and U2. Especially
for STAT-SVD, with the proposed double projection & thresholding scheme (Algorithm 2), one gets significant better estimations on U1 andU2 than the baseline methods in each iteration so
more precise projection (3) can be achieved when updating dense mode singular subspace ˆU3(t), and a slightly better final estimation of U3 can be achieved.
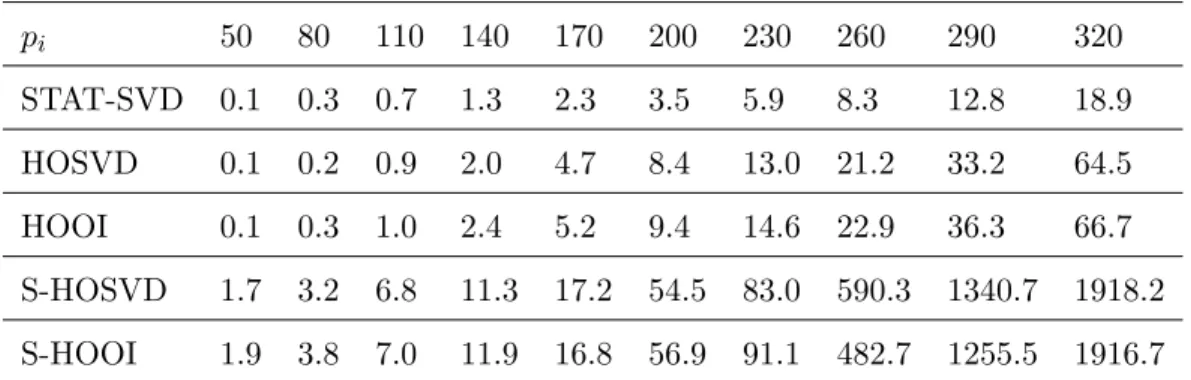
As the time cost is another critical issue in high-dimensional data analysis, we summarize the computational complexity for both initialization and each iteration of STAT-SVD and baseline methods into Table 2. We also compare the running time of STAT-SVD and other algorithms by simulations. As one can see from Tables 2 and 3, HOOI, HOSVD, S-HOOI, and S-HOSVD are all slower than STAT-SVD – this is because the embedded sparse matrix SVD or regular matrix SVD in baselines are computationally expensive, especially for the high-dimensional
STAT-SVD HOSVD HOOI S-HOSVD S-HOOI initialization O((pd1+s1d+1)) O(pd1+1) O(p1d+1) O(T p1d+1) O(T pd1+1) per-iteration O(pd1−1r1+sd1+1) 0 O(pd1+1) 0 O(T pd1+1)
Table 2: Computational complexity of STAT-SVD and baseline methods for order-d sparse tensor SVD. Here, each mode share the same pi,si, andri. T denotes the number of iteration
times.
pi 50 80 110 140 170 200 230 260 290 320
STAT-SVD 0.1 0.3 0.7 1.3 2.3 3.5 5.9 8.3 12.8 18.9
HOSVD 0.1 0.2 0.9 2.0 4.7 8.4 13.0 21.2 33.2 64.5
HOOI 0.1 0.3 1.0 2.4 5.2 9.4 14.6 22.9 36.3 66.7
S-HOSVD 1.7 3.2 6.8 11.3 17.2 54.5 83.0 590.3 1340.7 1918.2
S-HOOI 1.9 3.8 7.0 11.9 16.8 56.9 91.1 482.7 1255.5 1916.7
Table 3: Running time (unit: seconds) of STAT-SVD and baseline methods. Here, λ = 70,
σ = 1,s1=s2 =s3 = 10,r1=r2 =r3 = 5,p1=p2=p3 varies.
cases. In contrast, STAT-SVD is much faster, as the efficient truncation makes sure that only the significant parts of the data are extensively applied in computation, i.e., we only need to perform SVD on thesk-by-s−k submatrix instead of the originalpk-by-p−k one.
6.2 Mortality Rate Data Analysis
We illustrate the power of STAT-SVD through a demographic example. The mortality rate, i.e. the number of deaths divided by the total number of population, provides interesting insights to demographic information of the certain area, period, and age span. The Berkeley Human Mortality Database (Wilmoth and Shkolnikov, 2006) contains a good source of morality rate data aligned by countries, ages, and years. We aim to analyze the mortality rate among 26 European countries for ages 0 to 95 from 1959 to 2010. The data tensor Y is of dimension 96×52×26 with three modes representing age, year, and country, respectively. Since the mortality rate is relatively steady from teenagers to adults (see, e.g., Mini˜no (2013)), it is reasonable to assume that the underlying loadings of Mode age are sparse after taking differential transformation.
Specifically, let D ∈ R96×96 be a secondary difference matrix: D
ij = −2 if i = j; Dij = 1 if
|i−j|= 1;Dij = 0 if|i−j| ≥2. We pre-process the data by multiplying the secondary difference
matrix along Modes age: ˜Y =Y×1D.
We aim to apply sparse tensor SVD on ˜Y with Js ={1}. To achieve more robust
perfor-mance, the hyperparameters are selected via empirical methods instead of the Gaussian-noise-based procedure discussed in Section 5. rkis selected via cumulative percentage of total variation
criterion (Jolliffe, 2002, Chapter 6.1.1), ˆ
rk= arg min
r : Pr
i=1σi2(Mk(X))
Ppk
i=1σi2(Mk(X))
>0.5
.
For the noise level, we trim 15% largest entries ofY in absolute value, then set ˆσ as the sample standard deviation of the remaining entries ofY. The estimated rank and noise level of ˜Y are (ˆr1,rˆ2,rˆ3) = (2,5,4) and ˆσ = 0.0014. In addition to STAT-SVD, we also apply S-HOOI and
S-HOSVD for comparison. Suppose ˜U ,V ,ˆ Wˆ are the resulting singular subspaces of ˜Y. Then we transform ˜U (singular subspace of Mode age) back via ˆU =D−1U˜.
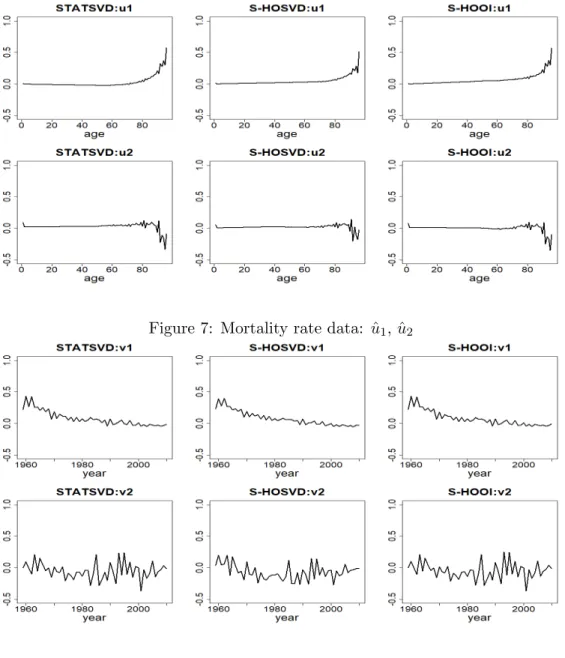
We first compare the first two singular vectors of Modes age and year, ˆu1,uˆ2,ˆv1,and ˆv2, in
Figures 7 and 8. We can see from ˆu1 that infants aged at 0-2 and old people aged over 55 have
a higher risk of dying, and people aged from 2 to 50 have a relatively steady death rate. In addition, the shape ofu2 further suggests additional factors of mortality rate in certain periods.
For example, there may be more complicated patterns in mortality rate for the infants and elderly aged over 80 due to the high risk of death in these two periods. From ˆv1, we can see
the mortality rate in these European countries declines significantly from the year 1955 to 2010, while ˆv2 does not give any significant pattern. Since the three methods produce similar plots on
values of singular vectors, we further compare the estimation support indexes in Figure 9. Since the mortality rate is steady from childhood to adults, one expects that the zero indexes would cover such an age span for ˆu1 and ˆu2. The outcome of STAT-SVD matches this phenomenon.
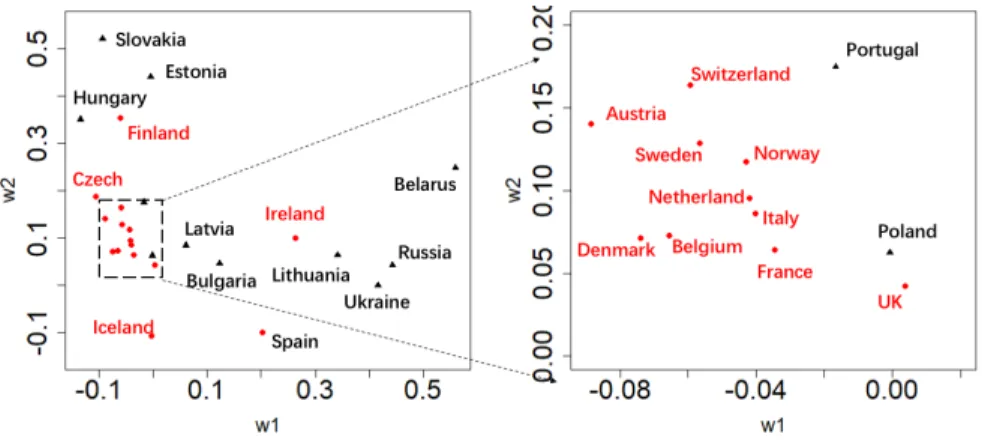
In comparison, the sparsity patterns given by S-HOSVD and S-HOOI are less interpretable. Next, we consider the mortality rate pattern for countries. In particular, we plot ˆw1 against
ˆ
w2 for each country in Figure 10, refer to the 2014 European GDP per capita ranking data1,
search for the countries whose GDP per capita is ranked as top 50% among all European counties,
Figure 7: Mortality rate data: ˆu1, ˆu2
Figure 8: Mortality rate data: ˆv1, ˆv2
Figure 10: Mortality rate data: ˆw1 and ˆw2 of different countries. Red circles and black
trian-gles represent the countries with top 50% GDP per capita in Europe and the other countries, respectively.
Figure 11: Mortality rate means for countries in Europe. Red circles and black triangles represent the countries with top 50% GDP per capita in Europe and the other countries, respectively.
then highlight these countries with red circle markers and the other with black triangles. We can clearly see two clusters in Figure 10 that countries with more GDP per capita have smaller values of ˆw1 and ˆw2, which implies a lower mortality rate. Also, wealthier countries are highly
clustered in the graph, which indicates the common pattern of the death rate for these countries. In contrast, we also calculate the mean mortality rates of these countries and mark them with different colors in Figure 11. By comparing Figures 10 and 11, the mortality data clustering performance of STAT-SVD is significantly better than the one by mean estimations.
7
Proofs
7.1 Proof of Theorem 1
Since the proof for this upper bound result is fairly complicated, we divide the proof into steps. Note that although we do not have refinement for non-sparse modes, to make the proof consistent, we first extend the refinement step to non-sparse algorithm. Specifically, we also apply algorithm 2 on ˆUk(t) for k6∈ Js, with ηk = ¯ηk = 0 i.e. no truncation. This modification
does not change the algorithm at all but makes the following analysis consistent for both sparse and non-sparse modes.
Without loss of generality, we assume σ = 1 throughout this proof. The idea of proving this theorem is that, we first impose a series of conditions, then prove the statement under these conditions, and finally prove these conditions hold with high probability.
Step 1 (Introduction of Notations and Conditions) We introduce or rephrase the following list of notations.
(N1) Matricizations, fork= 1, . . . , d,
Xk=Mk(X), Yk=Mk(Y), Zk=Mk(Z).
(N2) Index sets for sparse modek∈Js: define
(True support) Ik =
i: (Xk)[i,:]6= 0 ,
(Significant support) Ik(0)=ni:(Xk)[i,:]
2
2 ≥16σs−klogp
o
,
(Selected support) Iˆk(0)= (
i:(Yk)[i,:]
2 2 ≥σ
2p
−k+ 2
p
p−klogp+ 2 logp
or max
j |(Yk)[i,j]| ≥2σ
p logp
)
, k= 1, . . . , d.
(8)
Fort≥1, we also define ˆIk(t) and ˆJk(t) withk∈Js:
(selected support forAk int-th step) Iˆk(t)=
i: (A
(t)
k )[i,:]
2 2
≥ηk
,
(selected support for ¯Ak int-th step) Jˆk(t) =
i: ( ¯A
(t)
k )[i,:]
2 2 ≥η¯k
,
whereηk=σ2 r−k+ 2
p
r−klogp+ 2 logp
, ¯ηk=σ2 rk+ 2
√
rklogp+ 2 logp
.
For non-sparse mode k6∈ Js, defineIk =Ik(t) = ˆIk(t) = ˆJk(t) = [1 : pk]. It is easy to see
that for any k,Ik, Ik(0)Iˆk(t),Jˆk(t) are all subsets of {1, . . . , pk}. We also define
I−k=Ik+1⊗ · · · ⊗Id⊗I1⊗ · · · ⊗Ik−1.
Moreover, ˆI−(tk), ˆJ−(tk),I−(tk),J−(tk) are defined in the similar way.
(N3) Index projections: for anyIk ⊆ {1, . . . , pk}, we define
DIk = diag (1Ik)∈R
pk×pk, ifI
k⊆ {1, . . . , pk}is any index subset;
DIk can be interpreted as the projection matrix, which set all rows with index not inIk to zero.
(N4) Loadings:
U−k=Uk+1⊗ · · · ⊗Ud⊗U1⊗ · · · ⊗Uk−1∈Op−k×r−k, k= 1, . . . , d; ˆ
U−(tk)= ˆUk(+1t−1)⊗ · · · ⊗Uˆd(t−1)⊗Uˆ1(t)⊗ · · · ⊗Uˆk(t−)1 ∈Op−k×r−k, k= 1, . . . , d.
Vk= SVDrk
(XkU−k)>
∈Or−k,rk, i.e., leadingrk right singular vectors ofXkU−k;
ˆ
Vk(t)= SVDrk
(Dˆ
Ik(t)YkUˆ
(t)
−k)
>∈
Or−k,rk, i.e., leading rk right singular vectors of DIˆ(t)
k
YkUˆ−(tk).
Combining these definitions, we can rewrite A(kt) and ¯A(kt) as
Ak(t)=YkUˆ−(tk), B
(t)
k =DIˆ(t)
k
A(kt) =DIˆ(t)
k
YkUˆ−(tk),
¯
Ak(t)=YkUˆ−(tk)Vˆ
(t)
k , B¯
(t)
k =DJˆ(t)
k
YkUˆ−(tk)Vˆ
(t)
k .
We can immediately see that A(kt), Bk(t),A¯k(t),B¯k(t)are essentially projections ofYk. Since
Yk=Xk+Zk,A(kt), Bk(t),A¯(kt),B¯k(t) can be decomposed accordingly as
Ak(t)=Ak(X,t)+A(kZ,t) A(kX,t)=XkUˆ−(tk), A
(Z,t)
k =ZkUˆ
(t)
−k;
Bk(t) =Bk(X,t)+Bk(Z,t) Bk(X,t) =Dˆ
Ik(t)XkUˆ
(t)
−k, B
(Z,t)
k =DIˆ(t)
k
ZkUˆ
(t)
−k
¯
Ak(t)= ¯A(kX,t)+ ¯A(kZ,t) A¯(kX,t)=XkUˆ−(tk)Vˆ
(t)
k , A¯
(Z,t)
k =ZkUˆ
(t)
−kVˆ
(t)
k
¯
Bk(t) = ¯Bk(X,t)+ ¯Bk(Z,t) B¯k(X,t) =Dˆ
Jk(t)XkUˆ
(t)
−kVˆ
(t)
k , B¯
(Z,t)
k =DJˆ(t)
k
ZkUˆ−(tk)Vˆ
(t)
k .
(N5) Error Bounds: fort= 0,1, . . . , k= 1, . . . , d,
Ek(t)= ( ˆU
(t)
k⊥) >
Xk
F, F
(t)
k =
sin Θ
ˆ
Uk(t), Uk
F .
Fork= 1, . . . , d, t= 1, . . ., we further define
Kk(t)= sin Θ
ˆ
U−(tk)Vˆk(t), U−kVk
.
We also introduce the following conditions for the proof of this theorem. (A1)
max
(i1,...,id)∈I1×···×Id
|Zi1,...,id| ≤2 p
logp (11)
(A2)
Z[I1,...,I
d]
2
F ≤s+ 2
p
slogp+ 2 logp
Z×1U
>
1 × · · · ×dUd>
2
F
≤r+ 2prlogp+ 2 logp.
(12)
(A3)
∀1≤k≤d, Zk,[I k,I−k]
≤
√
sk+
√
s−k+ 2
p
logp. (13)
(A4) ∀1≤k≤d,
Nk:=
(Zk)[I
k,:]U−kVk ≤
√
sk+
√
rk+ 2
p
logp. (14)
(A5) ∀1≤k≤d,
Mk:= sup
Wl∈Rsl×rl,kWlk≤1 Zk,[I
k,I−k]W−k ≤2
√
sk+
√
r−k+
X
l6=k
(√slrl+
p logp)
, (15) whereW−k=Wk+1⊗ · · · ⊗Wd⊗W1⊗ · · · ⊗Wk−1 ∈Os−k,r−k.
(A6) Support consistency condition:
Ik(0)⊆Iˆk(0),
ˆ
Ik(t)⊆Ik, t= 0, . . . , tmax,
ˆ
Jk(t) ⊆Ik, t= 1, . . . , tmax.
Step 2 (Theoretical guarantees for initialization: Uˆk(0)) In this second step, we show that under (A1) – (A7), the initialization estimator ˆUk(0) satisfies the following two inequalities for any
k= 1,2,· · ·, d:
sin Θ
ˆ
Uk(0), Uk
F ≤
12√slogp λk
. (17)
( ˆU
(0)
k⊥) >
Xk
F ≤12
p
dslogp. (18)
Recall that ˆUk(0) = SVDrk
MkY˜(0) = SVDrk
Dˆ
Ik(0)YkDIˆ−(0)k
. Since Dˆ
Ik(0)YkDIˆ(0)−k =
Dˆ
Ik(0)XkDIˆ−(0)k +Dˆ
Ik(0)ZkDIˆ−(0)k
, by the unilateral perturbation bound result (Proposition 1 in Cai and Zhang (2018)),
sin Θ
ˆ
Uk(0), Uk
F ≤
σrk(U >
k DIˆ(0)
k
YkDIˆ(0)
−k
)kUk>⊥DIˆ(0)
k
YkDIˆ(0)
−k
kF
σ2
rk(U >
k DIˆ(0)
k
YkDIˆ(0)
−k )−σ2r
k+1(DIˆk(0)YkDIˆ−(0)k)
. (19)
We set C0≥80 √
d, recall that
λk≥80
p
dslogp, k= 1, . . . , d, (20)
we analyze each of the three key terms in the right hand side of (19) as follows, (a) Since (16) holds, i.e. Ik(0)⊆Iˆk(0), we know the non-zero part ofDI(0)
k
YkDI(0)
−k
is a submatrix ofDIˆ(0)
k
YkDIˆ(0)
−k , then
σrk(U >
kDIˆ(0)
k
YkDIˆ(0)
−k
)≥σrk
Uk>Dˆ
Ik(0)XkDIˆ−(0)k
−
Uk>Dˆ
Ik(0)ZkDIˆ−(0)k
≥σrk
Uk>Xk
−
Uk>
Xk−DIˆ(0)
k
XkDIˆ(0)
−k −
DIˆ(0)
k
ZkDIˆ(0)
−k F (16)
≥σrk(Xk)−
Xk−DI(0)
k
XkDI(0)
−k − DI
kZkDI−k
F
(12) ≥λk−
X−X×1DI(0)
1
× · · · ×dD
Id(0)
F
−s+ 2pslogp+ 2 logp1/2
≥λk− d
X
k=1 kD
Ik\I
(0)
k
Xkk2F
!1/2
−s+ 2pslogp+ 2 logp1/2
(8)
≥λk−(16dslogp)1/2−
√
s+p2 logp
≥λk−(4 + 1 +
√
2)pdslogp
(b) Note that Dˆ
Ik(0)YkDIˆ−(0)k = DIˆk(0)XkDIˆ−(0)k +DIˆk(0)ZkDIˆ−(0)k, rank(DIˆk(0)XkDIˆ−(0)k) ≤ rk, we
know
σrk+1
Dˆ
Ik(0)YkDIˆ(0)−k
Lemma 6
≤ σ1
Dˆ
Ik(0)ZkDIˆ−(0)k
(16)
≤ σ1 DIkZkDI−k
(13) ≤√sk+
√
s−k+ 2
p
logp≤4pslogp
(20) ≤ .1λk.
(c) Since the left singular space of DIkXkDI−k is Uk, we have U >
k⊥DIkXkDI−k =O, thus,
Uk>⊥DIˆ(0)
k
YkDIˆ(0)
−k F (16) ≤ U >
k⊥DIˆ(0)
k
YkDI−k F ≤ U >
k⊥DIkYkDI−k F + U >
k⊥DIk\Iˆ(0)
k
YkDI−k F ≤ U >
k⊥DIkXkDI−k+U >
k⊥DIkZkDI−k F + U >
k⊥Yk,[I k\Iˆ
(0)
k ,I−k] F ≤ U >
k⊥DIkZkDI−k F +
Yk,[Ik\Iˆ(0)
k ,I−k] F (16) ≤
Zk,[I k,I−k]
F +
Xk,[Ik\Ik(0),I−k] F +
Zk,[Ik\Ik(0),I−k]
F
≤2Zk,[I k,I−k]
F +
p
sk16s−klogp
(12) ≤2
q
s+ 2pslogp+ 2 logp+ 4pslogp
≤2(√s+p2 logp) + 4pslogp
≤9pslogp.
Summarizing (a), (b), (c), and (19), we must have (17), i.e.
sin Θ
ˆ
Uk(0), Uk
F ≤
12√slogp λk
, ∀k= 1, . . . , d,
provided that (A1) – (A7) hold. Next we consider the bound for k( ˆUk(0)⊥)>Xkk. Since ˆU
(0)
k
is the leading rk left singular vectors ofMk( ˜Y(0)) =DI(0)
k
YkDI(0)
−k
, rank(D
Ik(0)XkDI−(0)k
)≤rk,
and
D
Ik(0)YkDI−(0)k =DIk(0)XkDI−(0)k +DIk(0)ZkDI−(0)k.
Then by Lemma 6,
( ˆUk(0))>DI(0)
k
XkDI(0)
−k F
≤2√rk
DI(0)
k
ZkDI(0)
−k
≤2√rk
Z[I
k,I−k]
(13) ≤2√rk(
√
sk+
√
s−k+ 2
p
logp)≤8pslogp.
The last inequality comes from the fact that rksk≤s,rks−k≤sandrk≤sk. Meanwhile,
( ˆUk(0))>
D
Ik(0)XkDI−(0)k
−Xk
F ≤
Xk−DI(0)
k
XkDI(0)
−k F =
X−X[I(0)
1 ,...,I (0) d ] F ≤ v u u t d X k=1 kX
[Ik\Ik(0),:]
k2 F = v u u u t d X k=1 X
i∈Ik\Ik(0) Xk,[i,:]
2 2 ≤ v u u t d X k=1
sk·16s−klogp
=4pdslogp.
(22)
Therefore, ( ˆU
(0) k ) > Xk F ≤
( ˆUk(0))>DI(0)
k
XkDI(0)
−k F +
( ˆUk(0))>
Xk−DI(0)
k
XkDI(0)
−k F (21)(22)
≤ 8pslogp+ 4pdslogp≤12pdslogp,
which has proved (18).
Step 3 Next we consider the refinement of each iteration. To be specific, we try to study the perfor-mance of ˆUk(t) based on ˆUk(t−1). We still assume (11) – (16) all hold. Based on the result in Step 2, we have
E(0)k ≤12pdslogp and Fk(0)≤ 12 √
slogp λk
,
provided that (A1)–(A7) hold. We particularly provides the following upper bound forEk(t)=
( ˆU
(t)
k⊥)>Xk
F andF
(t)
k = sin Θ ˆ
Uk(k), Uk
F
Ek(t) ≤ √
skη¯k+ 3
√
rkNk+ 3
√
rkMk
Kk(t)+E
(t−1)
k+1
λk+1 +· · ·+
Ed(t−1) λd +
E1(t)
λ1 +· · ·+
E(kt−)1 λk−1
1−Kk(t)
,
(23)
Fk(t)≤ E (t)
k
λk
. (24)
The detailed proof is collected in Section C.3 in the supplementary materials. Step 4 In this step, we combine the results in Step 4 and provide a upper bound for E(tmax)
k , F
(tmax)
k
fortmax=C(log(dslogp)). We first show, for all sparse and non-sparse modes, we have the
following upper bounds for Ek(t):
Ek(t) ≤30√skrk+ 30
p
sklogp+
12√dslogp
First, (25) holds fort= 0 due to (18). If (25) holds for t−1 for somet≥1, we aim to prove (25) for t. First, based on the basic principle of Tucker rank, we have
rk≤r−k, rk ≤sk ⇒ slrl≤slr−l≤sls−l=s. (26)
Also, we shall recall that
√
ηk=
q
r−k+ 2
p
r−klogp+ 2 logp≤
√
r−k+
p 2 logp;
√
¯
ηk=
q
rk+ 2
p
rklogp+ 2 logp≤
√
rk+
p 2 logp;
Nl≤
√
sl+
√
rl+ 2
p
logp≤2√sl+ 2
p logp;
Ml≤2
√
sl+
√
r−l+ d
X
l=2 √
slrl+
p logp
!
,
(27)
and
Ek(t−1)≤30√skrk+ 30
p
sklogp+
12√dslogp
2t−1 ≤30√s+ 30psklogp+
12√dslogp
2t−1 ≤60pslogp+12
√
dslogp
2t−1 .
(28)
Thus, the following upper bound holds for K1(t), if we setCgap≥200d.
K1(t)
(60) ≤ (E
(t−1)
2 )2+· · ·+ (E (t−1)
d )2+ 2s1η1+ 6r1M12
λ21
!1/2
(27)(28) ≤
(d−1)60√slogp+ 12 √
dslogp
2t−1
2
+ 2s1η1+ 6r1M12
1/2
λ1 ≤60
√
d−1√slogp+ 12√d−1√dslogp+√2s1r−1+ 2 √
s1logp
λ1
+
2√6√r1
√
s1+ √
r−1+Pdk=2 √
skrk+
√
logp λ1
≤100dλ1
Cgapλ1 ≤ 1
Thus,
E1(t)≤ √
s1η¯1+ 3 √
r1N1+ √
r1M1
K1(t)+E
(t−1)
2
λ2 +· · ·+
Ed(t−1) λd
1−K1(t)
≤2√s1η¯1+ 6 √
r1N1+ 2 √
r1M1 K1(t)+
E2(t−1) λ2
+· · ·+E
(t−1)
d
λd
!
(27)
≤14√s1r1+ 15
p
s1logp+ 2 √
r1M1 K1(t)+
E2(t−1) λ2
+· · ·+E
(t−1)
d
λd
!
.
(29)
WithCgap>20(d+ 2)(d−1), by Lemma 8, we have:
√
r1M1K1(t)≤ √
r1M1Pdk=2E (t−1)
k
λ1
+M1
√
2s1r1η1
λ1
+
√
6r1M12
λ1
,
≤4√s1r1+ 4
p
s1logp+
12√dslogp
2(t+2) .
(30)
√
r1M1
E2(t−1) λ2
+· · ·+E
(t−1)
d
λd
!
≤3√s1r1+ 3
p
s1logp+
12√dslogp
2(t+2) (31)
Combining (29), (30), and (31), we have proved
Ek(t)≤30√skrk+ 30
p
sklogp+
12√dslogp
2t ,
i.e. (25) for t and k = 1. Similarly, one can also prove the upper bounds for Ek(t) for
k= 2, . . . , d, which implies the claim (25) holds for t≥0.
Then we further provide another upper bound for non-sparse modes. Note that we assume logp1 logp2 · · · logpd, thus we can find some constant C, such that
√
logp ≤
C√pk, k= 1,2, . . . , d. Now we want to show:
Ek(t)≤(30 + 15√2C)√pkrk+
12√dslogp
2t , k6∈Js (32)
Again, we assume mode 1 is non-sparse and only prove the bound forE1(t), the similar bounds for other non-sparse modes essentially follow.
Return to (29), note that we particularly have ¯η1= 0 since it is a non-sparse mode, we have:
E1(t)≤6√r1N1+ 2 √
r1M1 K1(t)+
E2(t−1) λ2
+· · ·+E
(t−1)
d
λd
!
(27)
≤ 12√p1r1+ 6
p
2r1logp+ 2 √
r1M1 K1(t)+
E2(t−1) λ2
+· · ·+E
(t−1)
d
λd
!
≤(12 + 6√2C)√p1r1+ 2 √
r1M1 K1(t)+
E2(t−1) λ2
+· · ·+E
(t−1)
d
λd
!
.
Also, we have the following bound forK1(t) asη1 = 0,
K1(t)≤ (E (t−1)
2 ) +. . .+ (E (t−1)
d ) +
√
6r1M1
λ1
. (34)
Besides, we could rebound M1 like following:
M1 ≤2
(1 +C)
√
p1+ √
r−1+
X
l≥2 √
slrl
. (35)
If we setCgap>20(d+ 2)(d−1), then together with (25), (33), (34) and (35), we can proved
the following result as similar as we proved in Lemma 8:
2√r1M1 K1(t)+
E2(t−1)
√
r2λ2
+· · ·+E
(t−1)
d
√
rdλd
!
≤(18 + 9√2C)√p1r1+
12√dslogp
2t .
Then (63) follows.
Now fortmax=C1log(dslogp), for large constantC1>0, we have
E(tmax)
k =
( ˆU
(tmax)
k ) > Xk F ≤
C √skrk+
√
sklogp
, k∈Js,
C√pkrk, k /∈Js,
(36)
F(tmax)
k = sin Θ ˆ
U(tmax)
k , Uk
F (62) ≤
C √skrk+
√
sklogp
/λk, k∈Js,
C√pkrk/λk, k /∈Js.
(37)
Step 5 In this step, we consider the estimation error for ˆX. We first have the following decomposition,
ˆ
X−X
F =
Y×1PUˆ1· · · ×dPUˆd−X
F
≤
Z×1PUˆ1· · · ×dPUˆd F +
X×1PUˆ1· · · ×dPUˆd−X F. Here,
X×1PUˆ1· · · ×dPUˆd−X
F
≤
X×1PUˆ1⊥+X×1PUˆ1 ×2PUˆ2⊥+· · ·+X×1PUˆ1 ×2PUˆ2 × · · · ×(d−1)PUˆd−1 ×dPUˆd F ≤ d X l=1
X×l( ˆUl⊥) > F = d X l=1 Uˆ >
l⊥Xl
F (36) ≤ C X
l∈Js
(√slrl+
p
sllogp) +
X
l6∈Js
√
plrl
Z×1PUˆ1 × · · · × ×dPUˆd F ≤
Z×1U1U1>Uˆ1
>
×2Uˆ2>· · · × ×dUˆd>
F +
Z×1U1⊥U1>⊥Uˆ1
>
×2Uˆ2>· · · × ×dUˆd>
F ≤ Z×1U
>
1 ×2Uˆ2>· · · × ×dUˆd>
F +
U1⊥U1>⊥Uˆ1
>
Z1
ˆ
U2⊗ · · · ⊗Uˆd>
F
≤ Z×1U
>
1 ×2Uˆ2>· · · × ×dUˆd>
F +M1
sin Θ
ˆ
U1, U1
F ≤ · · · ≤
Z×1U >
1 ×2U2>· · · × ×dUˆd>
F +M1 sin Θ
ˆ
U1, U1
F +M2 sin Θ
ˆ
U2, U2
F
≤ · · · ≤
Z×1U >
1 ×2· · · ×dUd>
F + d X l=1 Ml
sin Θ( ˆUl, Ul) F. Z×1U
>
1 × · · · ×dUd>
(12) ≤ q
r+ 2prlogp+ 2 logp=√r+p2 logp;
d X l=1 Ml sin Θ ˆ
Ul, Ul
F
(15)(37) ≤ CX
l∈Js
Ml
λl
(√slrl+
p
sllogp) +C
X
l6∈Js
Ml
λl
(√plrl)
≤CX
l∈Js
(√slrl+
p
sllogp) +C
X
l6∈Js
(√plrl).
In summary,
ˆ
X−X
F ≤C √ r+ d X l=1 √
rlsl+
X
l∈Js p
sllogp
.
under the assumptions (11) – (16) that we introduced in Step 1. Note that logp= logp1+ · · ·+ logpdand we have the assumption that logp1 · · · logpd, thus the result is equitant
to the one stated in Theorem 1.
Step 6 Finally, we prove that all imposed conditions in Step 1, i.e. (11)-(16), hold with probability at least 1−O((p1+···+pd) log (dslogp)
p ). The detailed proof is collected in Section C.4 in the
supplementary materials.
Acknowledgment
The authors would like to thank the Editor, Associate Editor, and anonymous referees for their constructive comments, which have greatly helped to improve the presentation of the paper.
References
Allen, G. (2012a). Sparse higher-order principal components analysis. InAISTATS, volume 15. Allen, G. I. (2012b). Regularized tensor factorizations and higher-order principal components
analysis. arXiv preprint arXiv:1202.2476.
Anandkumar, A., Deng, Y., Ge, R., and Mobahi, H. (2016). Homotopy analysis for tensor pca.
arXiv preprint arXiv:1610.09322.
Anandkumar, A., Ge, R., Hsu, D., Kakade, S. M., and Telgarsky, M. (2014a). Tensor de-compositions for learning latent variable models. Journal of Machine Learning Research, 15(1):2773–2832.
Anandkumar, A., Ge, R., and Janzamin, M. (2014b). Guaranteed non-orthogonal tensor de-composition via alternating rank-1 updates. arXiv preprint arXiv:1402.5180.
Birg´e, L. (2001). An alternative point of view on lepski’s method. Lecture Notes-Monograph Series, pages 113–133.
Cai, T. T., Ma, Z., and Wu, Y. (2013). Sparse pca: Optimal rates and adaptive estimation. The Annals of Statistics, 41(6):3074–3110.
Cai, T. T. and Zhang, A. (2018). Rate-optimal perturbation bounds for singular subspaces with applications to high-dimensional statistics. The Annals of Statistics, 46(1):60–89.
Choi, Y., Taylor, J., Tibshirani, R., et al. (2017). Selecting the number of principal components: estimation of the true rank of a noisy matrix. The Annals of Statistics, 45(6):2590–2617. De Lathauwer, L., De Moor, B., and Vandewalle, J. (2000a). A multilinear singular value