SPATIAL AND TEMPORAL DELIVERY OF SMALL MOLECULES FROM LONG WAVELENGTH SENSITIVE PHOTOTHERAPEUTCS USING ERYTHROCYTES AS
BIOLOGICAL CARRIERS
Christina M. Marvin
A dissertation submitted to the faculty at the University of North Carolina at Chapel Hill in partial fulfillment of the requirements for the degree of Doctor of Philosophy in the Department of
Chemistry (Biological Chemistry).
Chapel Hill 2018
Approved by:
David S. Lawrence Bo Li
ABSTRACT
Christina M. Marvin: Spatial and Temporal Delivery of Small Molecules from Long Wavelength Sensitive Phototherapeutics using Erythrocytes as Biological Carriers
(Under the direction of David S. Lawrence)
The need for safe and potent therapeutics has prompted designs of site-targeting drugs and the development of delivery systems that spatially and temporally deposit active agents directly at disease sites. The work in this dissertation presents the design and implementation of a two-part drug delivery system in which light-activated B12 drug conjugates, loaded on
erythrocyte drug carriers, photo-release bioactive moieties both in vitro and in vivo.
Historically, light-activated “caged compounds” have been developed to trigger biological responses on command with light. Light provides exquisite control that allows for more precise study into the dynamics of biological systems, mainly in vitro. Unfortunately, most caged compounds have been limited to light below the optimal window of tissue penetration (long wavelengths, 600 - 1000 nm), severely limiting their utility in biological systems beyond imaging. Common drug carriers in clinical practice include liposomes and nanoparticles. However, both systems exhibit fast clearance from the body, prompting attention towards naturally derived drug carriers, such as human cells.
This dissertation describes three generations of B12-loaded RBCs extended into the optimal window of tissue penetration and demonstrates the evolution of light-induced drug delivery from B12 scaffolds. Modification with fluorophore antennas alters the B12
iv
vi
ACKNOWLEDGEMENTS
I want to thank my advisor, Dr. David S. Lawrence, for his scientific guidance and
professional support throughout my graduate career. I also want to thank the current and former members of my lab who aided me with this research and provided scientific advice: Dr. Song Ding, Dr. Natalia Orlova, Emilia Zywot, Dr. Qunzhao Wang, Dr. Nate Oien, Dr. Melanie
Priestman, and Dr. Robert Hughes. Special thanks to Dr. Melanie Priestman for her mentorship and guidance, which were instrumental over the years and especially as I started investigating in vivo work. Also, I would like to thank the rest of my current lab and former lab members for their feedback and for making the lab a great place to work: Dr. Marissa Barry, Dr. Lauren Haar, Dr. Anwesha Goswami, Dr. James “Weston” Smith, Dr. Colin O’Banion, Dr. Zach Rodgers, Brianna Vickerman, and Josh Welfare. Special thanks to Lauren, Anwesha, Natalia, and Colin for their feedback on Chapter 1. I furthermore want to thank my collaborators, Dr. Teresa
Tarrant and Dr. Paul Dayton for their instrumental assistance with my pre-clinical work. I want to thank my committee: Drs. Bo Li, Matthew Lockett, Matthew Redinbo, and Gary Pielak.
This work is dedicated to my friends and family. I especially want to thank my parents, Patricia and Joseph, who have always supported my education, even when I decided to leave the valley to pursue my dreams almost 500 miles away. Thank you for your unwavering love, your commitment, and for setting an example I am proud to follow. You are the people I hope to become and I couldn’t have made this milestone without you. I also want to thank my best friend, Jennifer Bale and her husband Steven Bale, for years of support and encouragement. Jenn, you are truly the sister I never had – through all the milestones, the adventures, and even the challenges. I would never have reached this level of success without you. You are a
And finally, I want to thank Cecilia, the crooked-head kitty, who has been a vital source of comfort and companionship, especially through the challenges of graduate school.
Over the years, my friends have become like second, third, and fourth families to me. I want to thank each of them for their encouragement and mentorship – without which I would not be the person or the scientist I am today. I want to thank the Hoyt Library in Kingston, PA, especially Maryann Hovan, Stephen Wheadon, Amanda Winslow, Jessica Fountain, Diane Barr, Carol Dalmas, Elaine Lacina, Shelia Murtha, Paulette Moran, and Melissa Werner. You all helped me grow as a person for 10 years and I will never forget our library adventures. I want to thank my undergraduate chemistry and biology professors at King’s College in Wilkes-Barre, PA who encouraged me to pursue graduate education and made the classroom fun. Also, special thanks to the King’s College 2013 Chemistry class. You are all amazing and I look forward to seeing what our futures hold. I want to thank Morehead Planetarium and Science Center in Chapel Hill, NC. You welcomed me into the Science Center and fostered my love of science education and outreach for 5 years. Special thanks to Tamara Poles and the IMPACTS program for their amazing encouragement and mentorship.
viii
TABLE OF CONTENTS
LIST OF SCHEMES ... xii
LIST OF FIGURES ... xiv
LIST OF TABLES ... xx
LIST OF ABBREVIATIONS ... xxi
CHAPTER 1: COBLAMIN DRUG DELIVERY IN THE OPTICAL WINDOW OF TISSUE WITH ERYTHROCYTES AS BIOLOGICAL CARRIERS 1.1. Overview ... 1
1.2. The Dawn of Photoresponsive Biological Agents ... 2
1.3. Advancing Photoresponsive Agents into the Optical Window of Tissue ... 8
1.3.1 Current Application of Long Wavelength Light Therapy ... 15
1.4. A Brief History of Cobalamin ... 17
1.5. Cobalamin’s Structure and Function ... 18
1.6. Cobalamin Photochemistry ... 24
1.7. Extending Cobalamin into the Optical Window of Tissue Penetration ... 26
1.8. Erythrocytes: Natural Carriers with a Long History ... 33
1.9. Important Variations among Species ... 39
1.10. The Loading Process: External Conjugation vs Internal Encapsulation ... 43
1.10.1. External Loading: Coupling to Erythrocyte Membranes ... 45
1.10.2. Internal Encapsulation: Encapsulating in Erythrocyte Interior ... 50
1.10.2.1. Clinical Application... 57
REFERENCES ... 59
CHAPTER 2: LIGHT ACTIVATED DRUG DELIVERY: GENERATION 1, THE ERYTHROCYTE MEMBRANE 2.1. Background ... 68
2.2. Design and Synthesis of Anchored Compounds ... 71
2.3. Light-dependent Release of Drugs and Reporters ... 73
2.4. Fluorescent Reporter TAM as a Model of Loading and Release from Erythrocyte Membranes ... 76
2.5. Photochemistry: Demonstrating Loading and Release of C18-Cbl-drug Constructs from Erythrocyte Membranes ... 78
2.6. Delivery of Active Photoproducts from Erythrocyte Membranes to Mammalian Cells ... 88
2.7. Demonstration of C18-Cbl-Drug Stability on Erythrocytes ... 93
2.8. Extending the Photoresponsive Platform to Biologically Relevant Wavelengths in the Optical Window of Tissue Penetration ... 95
2.9. Long Wavelength Fluorophore Antennas Release Fluorescent Reporters via Energy Transfer ... 97
2.10. Long Wavelength Fluorophore Antennas Release Drugs on Command ... 103
2.11. Delivery of Active Photoproducts from Erythrocyte Membranes to Mammalian Cells using Long Wavelength Light ... 107
2.12. Conclusion ... 113
2.13. Materials and Methods ... 114
x
CHAPTER 3: LIGHT ACTIVATED DRUG DELIVERY: GENERATION 2, THE ERYTHROCYTE INTERIOR
3.1. Background ... 162
3.2. Encapsulation of a Cbl-reporter and Demonstration of Light-Controlled Release ... 165
3.3. Therapeutic Release from Cbl Constructs inside of Erythrocytes ... 179
3.4. Extending Therapeutic Release into the Optical Window of Tissue Penetration ... 186
3.5. Potential for Orthogonal Drug Delivery ... 192
3.6. Conclusion ... 196
3.7. Materials and Methods ... 197
REFERENCES ... 245
CHAPTER 4: LIGHT ACTIVATED DRUG DELIVERY: GENERATION 3, PRE-CLINICAL MODELS 4.1. Background ... 248
4.2. Design on the B12-based Pototherapeutic, Cy5-B12-TAX ... 249
4.3. Adaption of an Osmotic Loading Procedure to Mouse RBCs ... 251
4.4. Considerations when Adapting RBC Loading to Mouse Species ... 259
4.5. B12-loaded mRBCs Circulation Studies Demonstrate RBC Viability in vivo ... 261
4.6. Site-specific TAX release and Visualization of Endothelial Damage ... 264
4.7. Endothelial Damage in a Tumor Model Visualized via Ultrasound ... 270
4.8. Conclusion ... 274
4.9. Materials and Methods ... 275
CHAPTER 5: LIGHT-MEDIATED DRUG THERAPY AND CELL CARRIERS: A CHAPTER FOR NON-SCIENTISTS
5.1. What’s in your Medicine Cabinet?... 294
5.2. The Light-Inducted Chemical Launching Pad ... 295
5.3. Repurposing RBCs as Drug Carriers ... 302
5.4. Generation 1: Membrane Decoration and Anti-inflammatories ... 303
5.5. Generation 2: Internal Encapsulation and Extension to Chemotherapeutics ... 306
5.6. Generation 3: Re-design with Rodent RBCs and Pre-Clinical Studies ... 312
5.7. My Results ... 316
xii
LIST OF SCHEMES
Scheme 1.1. The first photocleavable biological agents ... 3
Scheme 1.2. Cbl Structure ... 19
Scheme 1.3. Cbl Photolysis ... 21
Scheme 2.1. Mechanism and products of alkyl cobalamin photolysis ... 84
Scheme 2.2. The structure and synthesis of C18-modified Cbls 2a, 2b, and 2c ... 115
Scheme 2.3. Synthesis and purification of C18-Cbl-MTX ... 119
Scheme 2.4. Synthesis of C18-Cbl-COL ... 121
Scheme 2.5. Synthesis of C18-Cbl-DEX ... 123
Scheme 2.6. Synthesis of C18-Cbl-TAM ... 126
Scheme 2.7. Synthesis of C18-Cbl-FAM ... 127
Scheme 2.8. Synthesis of C18-C5 and C18-Cy7 ... 131
Scheme 2.9. Synthesis of DY800 fluorophore ... 135
Scheme 2.10. Synthesis of C18-DY800 ... 138
Scheme 3.1. Cbl-Drug conjugates ... 166
Scheme 3.2. Synthesis of Cbl-MTX ... 198
Scheme 3.3. Synthesis of Cbl-COL ... 200
Scheme 3.4. Synthesis of Cbl-PTX ... 202
Scheme 3.5. Long wavelength phototherapeutics ... 211
Scheme 3.6. Synthesis of FL800 ... 212
Scheme 3.7. Synthesis of ethylenediamine-Cbl-MTX ... 213
Scheme 3.8. Synthesis of Cy5-Cbl-MTX ... 214
Scheme 3.9. Synthesis of (Fmoc)ethylenediamine-Cbl-propylamine ... 216
Scheme 3.10. Synthesis of Cy5-Cbl-PTX ... 217
Scheme 3.11. Synthesis of ethylenediamine-Cbl-butyrate ... 219
Scheme 3.13. Synthesis of FL800-Cbl-COL ... 223
Scheme 3.14. Synthesis of Etd-butyrate-Cbl ... 233
Scheme 3.15. Synthesis of Cy5SO3-butyrate-Cbl ... 234
Scheme 3.16. Synthesis of Cy5SO3--Cbl-Dox ... 234
Scheme 4.1.
Synthesis of Cy5-B12-TAX ... 276
Scheme 4.2. Formation of Cy5-B12-OH2 as a photoproduct of Cy5-B12-TAX ... 279
xiv
LIST OF FIGURES
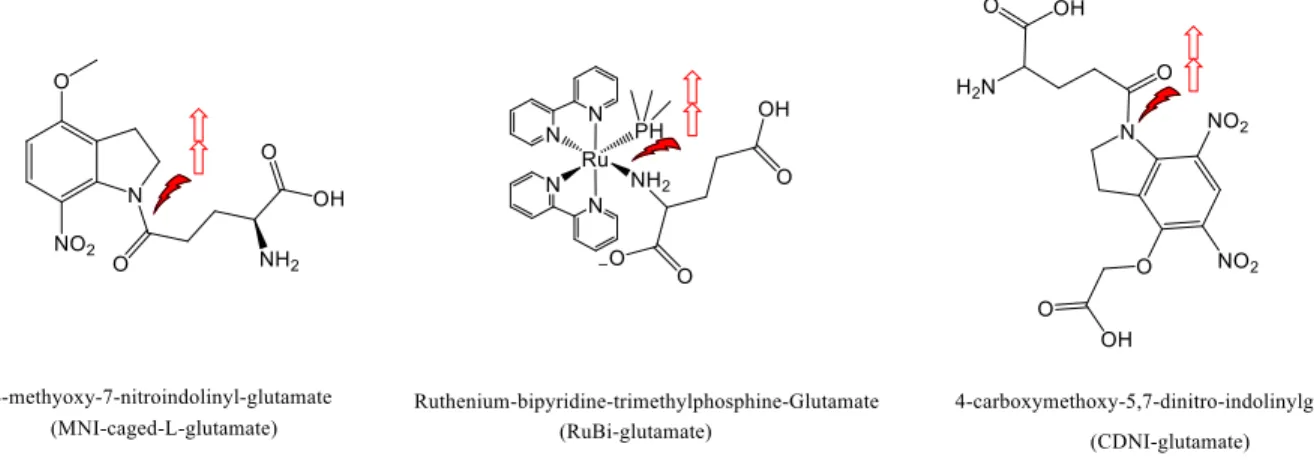
Figure 1.1. Common glutamate caging constructs ... 5
Figure 1.2. Caged phosphopeptide that targets 14-3-3 ... 7
Figure 1.3. Common PPGs and their wavelength of maximum excitation ... 9
Figure 1.4. Optical window of tissue penetration ... 11
Figure 1.5. Two photon absorption ... 13
Figure 1.6. Photodynamic therapy for cancer treatment ... 16
Figure 1.7. Absorption spectrum of alkylCbl ... 25
Figure 1.8. Light activated release of a fluorescent reporter ... 27
Figure 1.9. Demonstration of orthogonal release using long wavelength antennas ... 30
Figure 1.10. Adenosyl Cbl derivatives ... 32
Figure 1.11. Erythrocyte membrane structure ... 36
Figure 1.12. Hemoglobin crystals produced by rat erythrocytes ... 42
Figure 1.13. Coupling material to the erythrocyte membrane ... 46
Figure 1.14. Encapsulating material into erythrocytes through osmotic loading ... 52
Figure 2.1. Cbl phototherapeutics decorating the erythrocyte membrane ... 70
Figure 2.2. Structures of lipidated Cbl‐reporters and Cbl-drug conjugates ... 72
Figure 2.3. Structures of C18 conjugated fluorophore antennas ... 72
Figure 2.4. Light induced migration of TAM from octanol to water monitored by fluorescence of the aqueous layer ... 74
Figure 2.5. Light induced migration of MTX from octanol to water as quantified by the MTX LC-MS assay ... 75
Figure 2.6. C18-Cbl-TAM loading and release ... 77
Figure 2.7. Structural integrity of erythrocytes exposed to various concentrations of lipidated drug conjugates for 14 h ... 79
Figure 2.8. Drug loading on and release from human erythrocytes ... 79
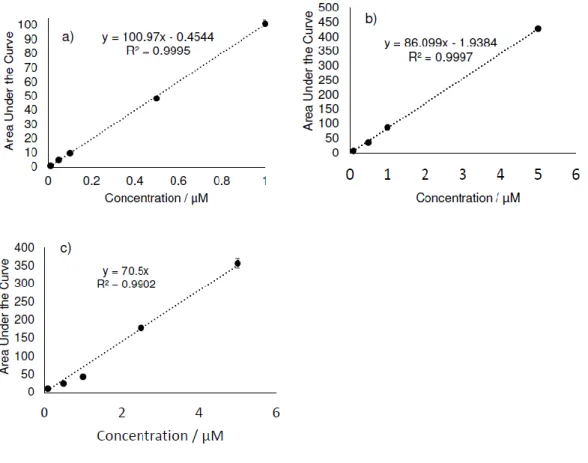
Figure 2.10. Drug standard curves ... 81
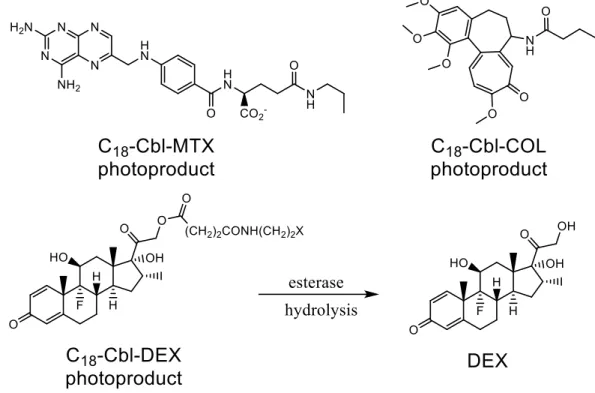
Figure 2.11. Released photoproducts of C18‐Cbl‐MTX, C18‐Cbl‐COL, and C18‐Cbl‐DEX ... 83
Figure 2.12. C18‐Cbl‐MTX as an effective inhibitor of DHFR ... 87
Figure 2.13. Assessment of MTX photo-release from C18-Cbl-MTX-loaded erythrocytes ... 89
Figure 2.14. Effect of COL on microtubules in HeLa cells ... 89
Figure 2.15. Effect of photo-released COL from erythrocyte-bound C18-Cbl-COL on microtubules in HeLa cells ... 90
Figure 2.16. Effect of DEX on the subcellular location of GRα in HeLa cells ... 91
Figure 2.17. Effect of photo-released DEX from erythrocyte-bound C18-Cbl-DEX on the subcellular location of GRα in HeLa cells ... 92
Figure 2.18. Assessment of C18-Cbl-DEX transfer between the erythrocyte and HeLa cell membranes ... 94
Figure 2.19. LED boards ... 96
Figure 2.20. Heat map of TAM release from erythrocytes ... 98
Figure 2.21. Photo-release of TAM from C18-Cbl-TAM/C18-fluorophore-loaded Erythrocytes ... 99
Figure 2.22. Photo-release of FAM from C18-Cbl-FAM/C18-fluorophores-loaded erythrocytes ... 100
Figure 2.23. Photo-release of TAM from C18-Cbl-TAM/C18-fluorophores-loaded erythrocytes after 30 min illumination ... 101
Figure 2.24. Photo-release of TAM from erythrocytes loaded with C18-Cbl-TAM ... 101
Figure 2.25. Release of FAM from erythrocytes loaded with C18-Cbl-FAM ... 102
Figure 2.26. Confocal images of erythrocytes loaded with C18-Cy5 ... 102
Figure 2.27. Release of MTX from C18-Cbl-MTX/C18-fluorophore-loaded erythrocytes ... 104
Figure 2.28. Release of COL and DEX from erythrocytes ... 105
Figure 2.29. DEX release from C18-Cbl-DEX/C18-Cy5-loaded erythrocytes ... 108
xvi
Figure 2.31. Quantitation of the effect of DEX release from C18-Cbl-DEX/C18-Cy5-loaded
erythrocytes on GRα subcellular location in HeLa cells ... 109
Figure 2.32. COL release from Cbl-COL/C18-DY800 erythrocytes at 780 nm... 110
Figure 2.33. Long wavelength release of COL from erythrocytes ... 111
Figure 2.34. MTX release from C18-Cbl-MTX/C18-Cy7-loaded erythrocytes at 725 nm ... 112
Figure 2.35. LC-MS UV/Vis chromatograms of purified C18-Cbl-drugs ... 125
Figure 2.36. LC-MS UV/Vis chromatogram of purified C18-Cy5... 133
Figure 2.37. LC-MS UV/Vis chromatogram of purified C18-Cy7... 134
Figure 2.38. LC-MS UV/Vis chromatograms of purified chloro-DY800 ... 137
Figure 2.39. LC-MS UV/Vis chromatogram of purified C18-DY800 ... 140
Figure 3.1. Light-mediated release of compartmentalized light-responsive compounds ... 164
Figure 3.2. Excitation and emission spectra of Cbl-BODIPY ... 166
Figure 3.3. Photolysis of conjugate Cbl-BODIPY ... 167
Figure 3.4. Effects of hypotonic loading procedure on RBC integrity ... 169
Figure 3.5. Cbl-BODIPY recovered in wash steps after loading into human erythrocytes ... 170
Figure 3.6. BODIPY release from Cbl-BODIPY-loaded erythrocytes ... 172
Figure 3.7. Time-dependent release of BODIPY from Cbl-BODIPY-loaded erythrocytes ... 172
Figure 3.8. Cbl-BODIPY standard curves ... 173
Figure 3.9. Cbl-BODIPY release after incubation ... 174
Figure 3.10. RBC internalization of Cbl-BODIPY over several days ... 176
Figure 3.11. Cbl-BODIPY localization in HeLa cells after release from RBCs ... 178
Figure 3.12. Cell-based assays for internalized MTX release at 525 nm ... 180
Figure 3.13. CETSA assay of 525 nm-induced release of MTX from Cbl-MTX loaded erythrocytes ... 181
Figure 3.14. Cell-based assays for internalized COL release at 525 nm ... 183
Figure 3.16. Cell-based assays for internalized PTX release at 525 nm ... 184
Figure 3.17. 525 nm release of PTX from Cbl-PTX-loaded erythrocytes... 185
Figure 3.18. CETSA assay of 660 nm release of MTX from Cy5-Cbl-MTX-loaded Erythrocytes ... 188
Figure 3.19. 660 nm-induced release of PTX from Cy5-Cbl-PTX loaded erythrocytes ... 189
Figure 3.20. 780 nm-induced release of COL from FL800-Cbl-COL loaded erythrocytes ... 189
Figure 3.21. Dox localization studies when released from CySO3--Cbl-Dox loaded RBCs ... 191
Figure 3.22. Absorbance spectra of Cbl-BODIPY and FL800-Cbl-COL ... 193
Figure 3.23. Orthogonal release of BODIPY and COL from erythrocytes separately loaded with Cbl-BODIPY and FL800-Cbl-COL ... 193
Figure 3.24. Orthogonal release of BODIPY and COL from erythrocytes co-loaded with Cbl-BODIPY and FL800-Cbl-COL ... 194
Figure 3.25. Orthogonal release of BODIPY and COL from erythrocytes separately loaded with Cbl-BODIPY and FL800-Cbl-COL and then pooled ... 195
Figure 3.26. Assessment of light-independent BODIPY release in the experiments described in Figures 3.24 - 3.25 ... 195
Figure 3.27. LC-MS chromatogram of Cbl-MTX ... 204
Figure 3.28. LC-MS chromatogram of Cbl-COL ... 204
Figure 3.29. LC-MS chromatogram of Cbl-PTX ... 205
Figure 3.30. Photolysis of Cbl-MTX ... 206
Figure 3.31. Photolysis of Cbl-COL ... 207
Figure 3.32. Photolysis of Cbl-PTX ... 209
Figure 3.33. LC-MS chromatogram of FL800 monitored at 280 nm ... 213
Figure 3.34. LC-MS chromatogram of Cy5-Cbl-MTX ... 225
Figure 3.35. LC-MS chromatogram of Cy5-Cbl-PTX... 225
Figure 3.36. LC-MS chromatogram of FL800-Cbl-COL ... 226
Figure 3.37. Photolysis of Cy5-Cbl-MTX ... 227
xviii
Figure 3.39. Photolysis of FL800-Cbl-COL ... 231
Figure 4.1. RBC loading and photo-induced TAX release ... 250
Figure 4.2. mRBCs internally and externally loaded with fluorescent material ... 252
Figure 4.3. Loading efficiency of Cy5-B12-R conjugates ... 252
Figure 4.4. Quantification of [Cy5-B12-R]/RBC... 253
Figure 4.5. UV-Vis absorbance spectra of Cy5-B12-TAX and Cy5-B12-OH2 ... 253
Figure 4.6. Flow cytometry histograms of internally and surface loaded mRBCs ... 256
Figure 4.7. Plots of Cy5 intensity vs SSC ... 257
Figure 4.8. Internal vs external loading visualized with on an imaging flow cytometer ... 257
Figure 4.9. Loaded mRBCs viewed with confocal microscopy confirm loading in the internal cavity ... 258
Figure 4.10. Loaded and native mRBCs stored in PBS for 24 h ... 260
Figure 4.11. Comparison of RBC viability during in vitro storage between human and mouse species ... 260
Figure 4.12. Intravital imaging setup ... 262
Figure 4.13. Circulation assessed via intravital imaging of mouse ear vasculature ... 262
Figure 4.14. Quantification of circulating labelled RBCs ... 263
Figure 4.15. mRBC stability under 660 nm light ... 266
Figure 4.16. Light-directed physiological effect of photo-released taxane derivative from Cbl scaffold ... 267
Figure 4.17. Histological differences between treated and untreated mouse ears ... 268
Figure 4.18. Histology controls for TAX release from Cy5-B12-TAX loaded mRBCs ... 268
Figure 4.19. Untreated FVB wild type ears ... 268
Figure 4.20. mRBCs loaded with Cy5-B12-OH2 do not elicit a major disruptive response in the main vasculature endothelium ... 269
Figure 4.21. Ultrasound Imaging setup ... 271
Figure 4.22. Vascular effects in a tumor model ... 272
Figure 4.24. LC-MS chromatogram of purified Cy5-B12-TAX ... 276
Figure 4.25. Photolysis of Cy5-B12-TAX ... 277
Figure 4.26. LC-MS chromatogram of purified non-photocleavable conjugate B12≡-NH2 ... 283
Figure 4.27. LC-MS chromatogram of purified non-photocleavable conjugate B12≡Cy5 ... 283
Figure 5.1. Vitamin B12 ... 297
Figure 5.2. Visible light penetration ... 298
Figure 5.3. Cy5-B12-Paclitaxel ... 300
Figure 5.4. Site-directed drug delivery ... 301
Figure 5.5. Attaching drugs to RBC membranes ... 304
Figure 5.6. Advantages of RBCs over other cell types for drug loading ... 307
Figure 5.7. Osmotic gradients alter cell shapes ... 309
Figure 5.8. Encapsulating drugs into RBC interiors ... 311
Figure 5.9. Unidentified rat RBC crystals ... 314
Figure 5.10. Release of a chemical group with long wavelength antennas ... 317
Figure 5.11. Effect of drugs released from RBCs after antenna-B12-drug encapsulation ... 319
xx
LIST OF TABLES
Table 1.1. Comparison and contrast of erythrocytes from humans, mice, and rats ... 40
Table 2.1. Elution times and predicted/detected masses of intact C18-Cbl-MTX, C18-Cbl-COL, and C18- Cbl-DEX ... 85
Table 2.2. Elution times and detected masses of the photocleavage products for C18-Cbl-MTX, C18-Cbl-COL, and C18-Cbl-DEX ... 85
Table 2.3. Power output of each of the LED arrays ... 96
Table 2.4. Elution times for the products of C18-Cbl-MTX and C18-Cbl-COL after fluorophore assisted, photocleavage from erythrocytes ... 106
Table 2.5. Solvent gradient used for preparative HPLC to purify C18-Cbl constructs ... 129
Table 2.6. Gradient used for LC-MS analysis of C18-Cy5 and C18-Cy7 ... 140
Table 2.7. Gradient used for LC-MS analysis of C18-DY800 and intermediates ... 141
LIST OF ABBREVIATIONS AND SYMBOLS 5-FAM 5-carboxyfluorecein
ADC antibody-drug conjugate AdoCbl adenosinylCbl
Alkyl-Co alkylcobalamins
AMPA α-amino-3-hydroxy-5-methyl-4-isoxazolepropionic acid ANOVA analysis of variance
ATP adenosine triphosphate BSA bovine serum albumin
B12 vitamin B12
CA1 cornu Ammon 1
cAMP cyclic adenosine monophosphate
Cbl cobalamin
CDT carbonylditriazole
CESTA cellular thermal shift assay
cm centimeter
CNCbl CyanoCbl
Co cobalt
CoA coenzyme A
COL colchicine
CuOAc copper (I) acetate
BS3 Bissulfosuccinimidyl suberate DAF decay-accelerating factor
DBU 1,8-diazabicyclo[5.4.0]undec-7-ene DC direct current
xxii
DEX dexamethasone
DHFR dihydrofolate reductase
DIC diisopropylcarbodiimide
DiD 1,1-dioctadecyl-3,3,3,3-tetramethylindodicarbocyanine DIPEA N,N-diisopropylethylamine
DMA dimethylacetamide DMBI benzimidazole
DMEM Dulbecco's Modified Eagle's medium DMF dimethylformamide
DOX doxorubicin DMSO dimethyl sulfoxide
DSP dexamethasone 21-phosphate ER endoplasmic reticulum
ESI MS electrospray ionization mass spectrometry ESMS electrospray mass spectrometry
EtOH ethanol FAM fluorescein
FDA Food and Drug Administration FBS fetal bovine serum
FITC fluorescein isothiocyanate
fL femtoliter
Fmoc Fluorenylmethyloxycarbonyl
Fmoc-OSu N- (9-fluorenylmethoxycarbonyloxy)succinimide
fmol femtomole
G guage
GAPDH glyceraldehyde 3-phosphate dehydrogenase
h hour
H&E Haemotoxylin and Eosin
HBTU N,N,N′,N′-tetramethyl-O-(1H-benzotriazol-1-yl)uronium hexafluorophosphate HO-Cbl hydroxocobalmin
HPLC high performance liquid chromatography
HR ESI MS High-resolution electrospray ionisation mass spectrometry
Hz Hertz
IACUC Institutional Animal Care and Use Committee
K potassium
kcal kilocalorie
kDa kilodalton
km kilometer
L liter
LC-MS liquid chromatography–mass spectrometry LED light-emitting diode
LSD least significant difference
M molarity
MB microbubble
MeCbl methylCbl MeOH methanol
mol moles
mOsm milliosmole
min minute
xxiv MTX methotrexate
mw molecular weight
Na sodium
NHS N-hydroxysuccinimide NIR near infrared
nm nanometers
NADP+ nicotinamide adenine dinucleotide phosphate NMR nuclear magnetic resonance
ONB ortho-nitrobenzyl
PBS phosphate buffered saline PDT photodynamic therapy PFA paraformaldehyde
PLGA poly(lactic-co-glycolic acid) PPG photolabile protecting group
PS photosensitizer
PTX paclitaxel
RA rheumatoid arthritis RBC red blood cell
RES reticuloendothelial system ROI region of interest
ROS reactive oxygen species
RT room temperature
SAMe S-adenosyl methionine
s second
SDS sodium dodecyl sulfate
TAMRA 5-carboxytetramethylrhodamine TFA trifluoroacetic acid
TSTU O-(Nsuccinimidyl)-N,N,N′,N′-tetramethyluronium tetrafluoroborate UCNP upconverting nanoparticles
UV ultraviolet
W watt
Xe xenon
Å angstrom
ε extinction coefficient
λ wavelength
µL microliter
1
CHAPTER 1: COBLAMIN DRUG DELIVERY IN THE OPTICAL WINDOW OF TISSUE WITH ERYTHROCYTES AS BIOLOGICAL CARRIERS
1.1. Overview
A concern of many current drugs is their tendency to cause serious, often life threatening side effects when administered systemically. This challenge in the pharmaceutical community has prompted interest in the design of drug delivery systems (DDS) that finely tune delivery and deposit active therapeutics at disease sites under spatial and temporal control.
In this chapter, I will introduce the design of light-sensitive chemical scaffolds for drug delivery and the use of erythrocytes as drug carriers. Both are essential for development of a finely tuned drug delivery system. The chemical scaffold permits investigator-controlled delivery, while erythrocytes instill extended circulation lifetime and biocompatibility on the system.
First, I will provide background on the current state of light activated release of biological entities and specifically discuss improvements in using light activation as a non-invasive
stimulus. Next, I will discuss the development of cobalamin (Cbl)-based phototherapeutics, which provide a biocompatible, light-sensitive launching pad for a wide array of small molecules. Finally, I will transition into the mechanism behind erythrocytes as drug carriers, and highlight the advantages and limitations of erythrocytes as biological vesicles for drug delivery.
1.2. The Dawn of Photoresponsive Biological Agents
The first light-responsive agents designed to control biological entities were synthesized in the late 1970s through modification of essential residues on biologically active substrates with photolabile protecting groups (PPGs). Absorbed light energy photocleaves the PPG and
produces an active agent. Pilot approaches with light-activated cyclic adenosine
monophosphate (cAMP) and adenosine triphosphate (ATP) were undertaken one year apart by Engels et al.3 and Hoffman et al.4 in 1977 and 1978, respectively. Even though his work was published a year later, Hoffman’s group is often credited with designing the first light-activated biological construct with future biochemical implications. Hoffman is also famous for coining the word “caging” to describe biological moieties inactivated with PPGs. While this term is still used, it is acknowledged that it is often problematic due to its ambiguity in the biochemical field.5
Hoffman’s group demonstrated successful blocking of ATP hydrolysis by modification of the γ-phosphate with an ultraviolet (UV) sensitive ortho-nitrobenzyl (ONB). Upon irradiation with 340 nm light, the ONB group undergoes photolysis to produce bioactive ATP (Scheme 1.1). The group found that the uncaged entity was acted upon by the ATPase function of Na:K ion pumps, demonstrating its ability to function as a native biological substrate on demand. Further work with caged ATP revealed that individual transports across the Na pump could be observed in membrane vesicles.1 While light activated molecules for synthetic purposes were already widely in use,2 these initial ATP studies laid the foundation for a new field in biology where
3 a)
b)
Since the pilot ATP experiments, various PPGs (the most common of which are ONB derivatives), have been used to synthesize a wide range of caged small molecules, peptides, proteins, and nucleic acids.3–7 These constructs continue to provide novel insights into the understanding of basic biological processes. A few examples are provided below to demonstrate the utility and diversity of the field.
5
7
Research continues to improve classical PPGs for enhanced temporal and spatial accuracy in cellular biology.9,13–15 However, there is still the question as to whether PPGs have utility in biomedical applications. Recently, a number of studies have designed PPG-modified nanocarriers.16 In one example, the anti-cancer agent 5-fluorouracil was attached to the outside of gold nanoparticles through a photocleavable nitrobenzyl linker. These “smart” carriers
demonstrated light-controlled cytotoxic efficacy against a MCF-7 breast cancer cell line.17 As an alternative strategy, PPGs can be used as light sensitive “caps” on porous nanocarriers. Drugs are encapsulated on the inside of these carriers and cargo is released upon illumination and subsequent dissociation of the caps. Vivero-Escoto et al. demonstrated the utility of this system through attachment of 5 nm gold nanoparticle caps to mesoporous silica nanoparticles via a photocleavable linker and reported controlled release of paclitaxel inside of human fibroblast and liver cells.18
1.3. Advancing Photoresponsive Agents into the Optical Window of Tissue While researchers have used traditional PPGs to enhance understanding of cell signaling and create finely tuned biochemical investigations, application of PPGs as drug release agents, even with nanocarriers, has been limited. The largest challenge associated with ONB and other traditional PPGs (Figure 1.3) is their activation with UV and short wavelength visible light. First, light within this range encompasses only a narrow portion of the potential visible and near infrared (NIR) spectrum, limiting the types and diversity of PPGs available. Secondly, UV light inflicts biochemical damage on cellular components in the body through the production of radicals, making its use for clinical application questionable.19 Finally, UV and short visible light have very short penetration depths through mammalian tissue. Cells and organisms such as zebrafish are transparent to short wavelength light and thus PPGs have found broad application with these systems.4 However, when applied to thick-skinned mammals, short wavelength light is strongly absorbed and scattered by melanin and hemoglobin,20,21
9
Figure 1.3. Common PPGs and their wavelength of maximum excitation. These caging groups are activated with light below 500 nm, which is too short to effectively penetrate biological tissue.
324 nm 360 nm 405 nm 419 nm
364 nm
440 nm
450 nm
469 nm
254 nm
285 nm
320 nm
330 nm
440 nm
11
a) b)
Figure 1.4. Optical window of tissue penetration. (a) Most traditional PPGs respond to light between the UV and short visible wavelength region (< 600 nm). Unfortunately, light in this region is strongly absorbed by biological components such as melanin and hemoglobin, limiting their use in biological systems. This absorption is minimized in the “optical window” of tissue penetration between 600 - 1000 nm. (b) Light within the optical window can penetrate up to 5 cm under the skin. Through design of photoresponsive conjugates in this window, light controlled biological applications in imaging and medicine can be achieved.
13
Figure 1.5. Two photon absorption. A PPG that normally undergoes photolysis at short wavelengths can be activated with long wavelength light when exposed to extremely
In terms of clinical application, it would be beneficial to overcome these limitations
through the design of a therapeutic system that responds to one photon activation energy. Since the dawn of UV-responsive ONB groups, one photon responsive dyes have steadily been extended into the red region of the visible spectrum with coumarin (400 - 450 nm),23 bodipy (~500 nm),24,25 and cyanine (650 - 690 nm)26 derivatives. Other single photon NIR responsive (700 - 980 nm)27–29 systems have been recently realized in the form of upconverting
15
1.3.1. Current Application of Long Wavelength Light Therapy
Despite the challenges associated with extending light sensitive molecules into the optical wavelength of tissue penetration, several industries utilize long wavelength light for therapeutic application. The most advanced clinical application to date is photodynamic therapy (PDT) (Figure 1.6). The first stage of PDT is the intravenous injection of a molecular
photosensitizer (PS). PS conjugates, often based on porphyrin structures, are retained for prolonged periods of time in cancer cells compared with normal cells. After 2-3 days, enough time for the body to clear the PS from healthy cells, the second stage of PDT is initiated through treatment of the diseased area with the appropriate long wavelength light. Light dose is
Figure 1.6. Photodynamic therapy for cancer treatment. The concept of PDT is routed in the site directed accumulation and light induced cytotoxicity of a PS. The PS is injected
17
As of 2015, the US Food and Drug Administration (FDA) has approved the PS porfimer sodium, or Photofrin ®, to treat esophageal, microinvasive endobronchial non-small cell lung cancer, and high grade dysplasia in Barrett’s esophageal cancer. Various other PS molecules are also approved for PDT clinical trials in various solid tumors including head and neck, skin, perianal, and metastatic breast cancer. While PDT represents a huge advancement for light induced therapy, there are several areas for improvement. Major limitations include the need for sufficient environmental oxygen at the tumor site and the sole creation of ROS, which is a nonspecific cytotoxic agent. The following sections will demonstrate how I aim to broaden the concept of long wavelength therapy to the release of a wide range of therapeutic agents, including anti-inflammatories and a variety of cytotoxic agents.
1.4. A Brief History of Cobalamin
The discovery of Cbl harkens back to the early twentieth century, when Dr. George Whipple discovered that raw liver alleviated the lethargic symptoms of anemic dogs.31 Minot and Murphy32 went on to cure 45 patients suffering from pernicious anemia through a diet of lightly cooked liver. Whipple, Minot, and Murphy shared the 1934 Noble Prize in Medicine for the treatment of what was until that time a fatal disease. In 1948, Karl Folkers and Alexander Todd isolated the compound responsible for the curative effect and coined it vitamin B12 or
1.5. Cobalamin’s Structure and Function
Cobalamin, and a multitude of its natural and synthetic derivatives, is one of the most widely studied organometallic cofactors. Its native photochemistry, discussed further in Section 1.7, imparts its ability to function as a novel phototherapeutic. Most vitamin B12 derivatives contain the same core structure of a cobalt (Co) corrinoid with pseudo-octahedral
19
Scheme 1.2. Cbl Structure. Left: The full chemical structure of Cbl. Cbl is composed of a nineteen membered cobalt corrinoid ring with pseudo-octahedral geometry. The Co normally exists in the (+3) oxidation state, but can undergo reduction to (+2) or (+1). The R group at the β-axial position can be substituted with a number of various functional groups, including bioactive methylCbl (MeCbl) and adenosinylCbl (AdoCbl). Synthetic methods also allow
The Co metal coordinated in the center normally exists in a stable (+3) oxidation state with a d6-low spin configuration. Both biological37 and chemical38 entities can reduce Co (+3) to either its (+2) or (+1) oxidation states. Of particular interest to our studies is the conversion from (+3) to (+2) which results in the loss of the upper β-axial ligand and the retention of the unpaired electron in the dz2 orbital as a radical. The bond at this position is relatively weak (< 44
21
23
Cobalamin participates in carbon skeletal rearrangements, acting as a controlled source of carbon centered radicals.39 In the cytoplasm, MeCbl is associated with methyltransferase activity, undergoing heterolytic cleavage by methionine synthase in the methionine cycle. This process transfers a methyl group from 5-methyltetrahydrofolate to homocysteine, which generates tetrahydrofolate and methionine. These products are used to make S-adenosyl methionine (SAMe), a universal methyl donor important for proper DNA methylation,
phospholipid membrane formation, and other biological processes. In the mitochondria, AdoCbl is associated with isomerase activity, undergoing homolytic cleavage. It acts as a cofactor for methylmalonyl-CoA mutase, which converts methylmalonyl-CoA into succinyl Co-A. Succinyl Co-A is a necessary intermediate for porphyrin and heme production in mitochondria, which is eventually required for hemoglobin construction in red blood cells.
Many other alkylCbls can be synthesized via standardized protocols such as -CH2CH3 (ethyl), -(CH2)2CH3 (propyl), (CH2)17CH3 (stearyl), -(CH2)3NH2 (propylamine), and –(CH2)3CO2H (butyrate).40,41 More substituted alkyl groups (2° and 3°) are typically not applied to Cbl due to instability caused by steric interactions. To offset steric hindrance, highly substituted ligands will quickly undergo elimination reactions to yield alkenes and Cbl hydride species.42 For our work, this means that we use a non-substituted alkyl chain as a linker to highly substituted
therapeutics.
1.6. Cobalamin Photochemistry
Careful examination of the Cbl absorbance spectrum reveals multiple bands that vary based on the β-axial ligand (Figure 1.7). This discussion will mainly focus on alkyl-Cbl, as they will be the focus of phototherapeutic design. The most intense band, the γ band, is found in the UV region (300 - 400 nm) with ε ranging from 10,000 - 30,000 M-1cm-1. With alkyl ligands at the β-axial position, this band arises from the multiple π π* corrin transitions.36,43,44 The strong electron donating alkyl groups split the band into an “atypical” spectrum with two maxima between 300 and 400 nm. In comparison, β axial ligands that are strong electron withdrawing groups, such as –OH and –CN produce a “typical” spectrum with a single strong peak at 350 nm. The α/β absorption bands between 450 and 600 nm produce a smaller ε with values less than 10,000 M-1cm-1.31 When the β-axial ligand dissociates to form Co+2, the α/β band will shift to ~480 - 490 nm. Although there is some evidence to suggest otherwise, it is most widely
25
Figure 1.7. Absorption spectrum of ethylCbl. The γ band is most likely the result of π
1.7. Extending Cobalamin into the Optical Window of Tissue Penetration
27 a) b)
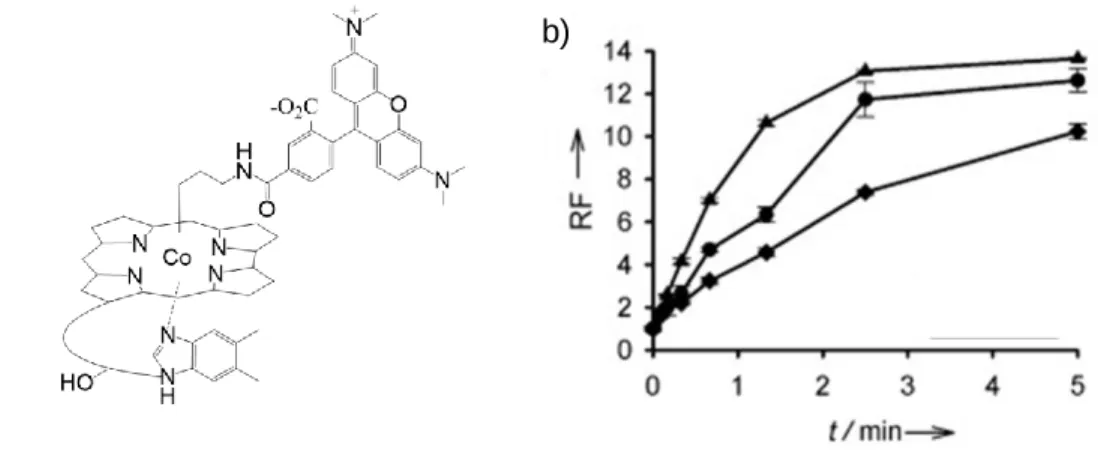
Figure 1.8.47 Light activated release of a fluorescent reporter. (a) Structure of Cbl-TAMRA. We demonstrated that Cbl’s β-axial ligand could be substituted with an alkylated TAMRA molecule and could be released on command with 560 nm light. (b) Kinetics of TAMRA photolysis as observed by fluorescent unquenching.
A key observation was made that suggested a relationship between the TAMRA fluorophore and photolysis, which would eventually allow for the extension of the wavelength response. Compounds with TAMRA at the β-axial position underwent photolysis at a faster rate than unsubstituted conjugates when illuminated with 560 nm. It occurred to our group that the weak state of the Co-C bond represented an opportunity to extend photolysis into longer wavelengths by using long wavelength fluorophores as light-capturing “antennas”. The
29
Modification of the β-axial ligand is easily carried out by using zinc to reduce Co (+3) into a nucleophilic Co (+1) species that reacts with alkyl halides. The antenna hypothesis was
a)
b)
Figure 1.9.48 Demonstration of orthogonal release using long wavelength antennas. (a) Structures of Cbl-based, long wavelength sensitive release agents. Various long wavelength functionalized Cbl constructs demonstrated photolysis upon illumination with the attached fluorophore’s maximum excitation wavelength. Note that the structures of Alexa700 and Dylight800 have not been reported. (b) Illumination at 546 nm, near the excitation maximum of the corrin ring, photolyzed all conjugates prepared. The longer wavelengths of light were only able to photolyze conjugates with their respective fluorophore antenna, suggesting the potential for orthogonal control.
31
33
With the ability to functionalize a biologically relevant light-stimulated release system, the tools necessary to design a finely tuned drug delivery system were available. In the next
chapters, two approaches will be discussed: photolysis via an adjacent fluorophore (Chapter 2) and photolysis via a fluorophore attached at the 5’-OH position on Cbl (Chapter 3). Before describing these systems in details, we must transition to a discussion of drug carriers. We believed we could increase circulation time and efficacy of our Cbl phototherapeutics with the right carrier. While there are a number of widely implemented synthetic carriers in investigation, including liposomes, hydrogels, and nanocarriers, we chose to focus on a natural carrier with a number of unique advantages in vivo.
1.8. Erythrocytes: Natural Carriers with a Long History
Erythrocytes, also called red blood cells (RBCs), were first observed by early microscopy leaders in the 17th century. Both Marcello Malpighi and Jan Swammerdam are credited with making preliminary observations on the “red particles” in blood, while Antoni van Leeuwenhoek is known for recording the first detailed notes and illustrations of the cells.49,50 Since then, erythrocytes have been widely studied, from their role in hematological malignancies to biomedical applications stemming from their unique structure and function. As oxygen
Erythrocytes have many advantages as natural, versatile drug carriers that can be loaded via either membrane binding or internal encapsulation. In their native state, human erythrocytes are biconcave discs, 7 to 8 µm in diameter, with an average volume of 90 fL, and an average surface area of 140 µm2.51 They are biocompatible, biodegradable, easy to handle, and non-immunogenic. If drugs are loaded in the interior, the cells can protect the organism from toxic effects of the drug and the drug from clearance mechanisms in the body. In comparison to synthetic carriers, erythrocytes survive longer in the blood (days or months vs minutes or hours) and have a larger payload capacity (μm vs nm) than synthetic carriers. Compared to other cellular carriers they possess the largest surface-to-volume ratio of any cell (1.9 x 104 cm/g), abundance (4-6 million cells/μL of whole blood and almost 30 trillion
cells/human body), and affordability. While these properties provide great potential for erythrocyte drug carriers over other systems (liposomes, nanoparticles, stem cells etc.), limitations to their use include reticuloendothelial system (RES) removal, reduced
biocompatibility as a result of ex vivo modification, variations in loading and physiological characteristics, difficulty in the identification of appropriate storage conditions, possible
35
Erythrocytes express a functionally rich surface containing multiple sites for covalent and non-covalent attachment of chemical entities. These potential handles resulted in intense
interest in the design of “hitchhiker” chemical entities in circulation. The erythrocyte membrane is composed of a lipid bilayer and membrane cytoskeleton, together containing over 300 unique proteins.54 The lipid bilayer, composed of phospholipids, cholesterol, and integral
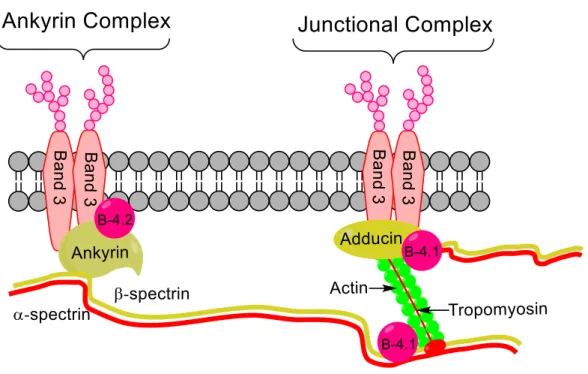
Figure 1.11. Erythrocyte membrane structure. The lipid bilayer is physically connected to the cytoskeleton via integral membrane proteins and horizontal spectrin interactions. The
37
Over the course of an erythrocyte’s 120-day lifespan, cells undergo chemical alterations that eventually signal them for clearance by the spleen. Autologous immunoglobulin binding, complement deposition, and macrophage recognition are all signals of old cells. Metabolic pathway inactivation, changes in size and shape, and reduction of membrane surface area due to spleen-induced vesiculation57 cause the cell membrane to lose its integrity and flexibility, which acts as a signal it for clearance by the spleen. Alternatively, aging erythrocytes simply undergo surface alterations, most commonly band 3 clustering and externalization of membrane phosphatidyl serine on the outer leaflet of the lipid bilayer. In this case, system wide
macrophages recognize the changes and clear the erythrocytes, predominantly through either the spleen or the liver. It is important to understand the signs of erythrocyte senescence when developing drug loading methods as ex vivo modification can lead to features that mimic erythrocyte senescence states, resulting in quick removal from circulation and loss of the erythrocytes’ advantageous circulation lifetime.
Since internal loading will play a large role in Chapters 3-4, the history of this method will be briefly discussed. The first chemical entities to be successfully loaded into erythrocyte
interiors were ATP by Gardos in 195358 and 10-250 kDa dextrans by Marsden and Ostling in 1959.59 The first reports which describe therapeutic loading of erythrocytes were independently published by Ihler et al.60 and Zimmerman61 fourteen years later in the 1970s. Several key features of erythrocyte physiology caught the attention of these early scientists. The first aspect was the erythrocyte’s flexibility, a property of its unique spectrin-based membrane skeleton that allows it to swell to a sphere of 150 µL without breaking or to shrink below its starting volume in order to squeeze through 3-4 µm capillary beds. Deformability is key to using osmotic methods to load materials into the erythrocyte interior (Section 1.13). As mentioned above, human erythrocytes circulate for an average of 120 days, traveling about 250 km through the entire bloodstream. This survival time far surpasses that of most synthetic carriers, making
39 1.9. Important Variations among Species
This section will highlight the importance of accounting for species-specific variations in cellular physiology, morphology and membrane deformability of modified cells. Loading was initially performed on human erythrocytes in Chapters 2 and 3 since human cells are the most relevant to future clinical trials. Chapter 4 highlights the adaption of the loading procedure to rodent cells in order to conduct pre-clinical investigations. Before discussing each loading strategy in detail, I wish to highlight the challenges and considerations needed when working between erythrocytes of multiple species.
We chose human erythrocytes for in vitro proof of concept studies with various Cbl-based phototherapeutics, as they are the most relevant for human clinical application. To extend our work to pre-clinical models, we adapted our erythrocyte loading system on the basis of the biological characteristics of the erythrocytes of small mammals. The most common pre-clinical models are the common laboratory mouse (Mus musculus) and the Wistar rat (Rattus
Table 1.1. Comparison and contrast of erythrocytes from humans, mice, and rats.63–66
Human Mouse Rat
Diameter (µm) 7-8 6 6.5
Surface Area (µm2) 140 91 100
41
At first, rat erythrocytes appeared to be the superior model for in vivo preclinical studies, as they are slightly larger than mouse erythrocytes and have a longer circulation time.
Additionally, tail vein injections are easier to perform on rats than mice and are typically more accurate than with mice species. However, a fundamental aspect of rat erythrocytes was found to greatly limit their use as a model for erythrocyte drug carriers. In order to internally load erythrocytes, it is necessary to remove hemoglobin to make room for the new payload.
43
While mouse erythrocytes do not have crystallizing hemoglobin, it is known that they are grossly less stable ex vivo than human erythrocytes. We confirmed that mouse erythrocytes survive for a shorter amount of time in storage69 and lyse more readily during ex vivo
manipulation70 when compared to human erythrocytes. In a detailed paper, Muzykantov et al. demonstrated that human erythrocytes showed greater resistance to every environmental challenge tested, (osmotic, mechanical, and oxidative stress) as well as higher resistance to biological injury, than their mouse conterparts.70 Given these challenges, it is important to ensure that mouse erythrocytes are used within 24 h of blood draw and that stress of the loading procedure is minimized. By reducing handling stress, a maximum cell recovery can be achieved and the recovered cells can better maintain their native characteristics. Still, caution should also be taken when correlating potential human utility with mouse models – results obtained with mouse models often overestimate erythrocyte fragility that is ultimately mitigated in sturdier human cells.
1.10. The Loading Process: External Conjugation vs Internal Encapsulation
External coupling is less damaging to the structural integrity of the erythrocytes since their membrane remains intact during the procedure. Because of this feature, native erythrocyte morphology and circulation times are typically better preserved than with internal encapsulation. However, challenges also exist when instilling drugs and materials on the cell’s exterior. Strong covalent bonds can weaken membrane integrity while weak non-covalent interactions can lead to “membrane hopping” where the attached material hops to adjacent mammalian membranes. Other environmental factors such as extracellular proteins, shear stress in circulation, and interactions with the vascular wall may also pull off loaded material.71 Finally, natural reduction of the membrane through interactions with the spleen may lead to premature shedding of the embedded material, and thus become a risk factor in off target effects.
45
1.10.1. External Loading: Coupling to Erythrocyte Membranes
47
Non-covalent coupling on the erythrocyte membrane is described as “hitchhiking” because by attaching themselves to cellular carriers, moieties that are normally cleared rapidly can maintain circulation for longer time spans. Nonspecific physical interactions are largely responsible for the “hitchhiking” effect. Specifically, the two main approaches are electrostatic interactions and passive diffusion.
Positively charged materials in particular can be easily coupled to the membrane through electrostatic interactions since the high concentration of sialic acid residues results in an overall negatively charged membrane. However, this approach is not often employed as strong
electrostatic interactions at the membrane have been shown to create erythrocyte aggregates, possibly due to collapse of the fluidic lipid bilayer and blockage of the local arrangement necessary for lipid coverage.78,79
On the other hand, passive adsorption coupling, a less detrimental non-covalent strategy achieved through hydrogen bonding, van der Waals interactions, and hydrophobic forces, removes the need for positively charged particles.80 Circulating pathogens inspired initial studies on this coupling approach when scientists observed the bacteria Mycoplasma hemofelis
Nanoparticles have a multitude of advantageous features that make them a promising drug carrier including the ability to encapsulate and protect the drug, improve targeting with tissue-specific targeting ligands, tighten control on drug release by composition alterations (i.e. biodegradable poly(lactic-co-glycolic acid) (PLGA)), and be reproducibly mass produced.80 However, freely injected nanoparticles typically survive for only a few minutes in circulation86–88 and this rapid clearance by the RES limits clinical application. By non-covalently attaching polymeric nanoparticles to long circulating erythrocytes, the particle lifetime in circulation could be extended into multiple days. It has been described that at a particle/RBC ratio of 100:1, mouse erythrocytes can carry approximately 24 particles (200 nm) per cell with a nanoparticle circulation time of 24 h, although cells with higher payloads were cleared from circulation within the first 30 min.70,89
49
As an alternative approach, we note the work conducted to improve stability of moiety attachment to the erythrocyte membrane with stronger covalent modifications. The erythrocyte membrane is rich in proteins and carbohydrates that provide ample sites for covalent
modification.80 The most successful covalent modification to erythrocyte membranes has been pioneered by Muzykantov and his collaborators and involves connections with avidin-biotin interactions.91–94 However, their studies also revealed an important limitation of this strategy. Namely, that polyvalent streptavidin binding induces erythrocyte lysis due to activation of the alternative complement pathway.
Specifically, binding inactivates the membrane regulators of complement,
1.10.2. Internal Encapsulation: Encapsulating in Erythrocyte Interior
The second erythrocyte loading strategy is to sequester chemical and biological moieties into the cell interior. As noted in Section 1.10, the greatest advantages of this approach are mitigation of immunogenic clearance and enhanced payload capacity. The most common strategies to encapsulate material into erythrocytes are osmosis, electroporation,99 conjugation to cell penetrating peptides,100 and endocytosis-based101 methods. Of these strategies, osmosis is the most widely utilized approach due in large part to its ability to be industrially scaled-up.102
Internal encapsulation via osmosis is based on the ability of erythrocytes to reversibly swell in hypotonic conditions, opening pores that allow exchange of material. There is some disagreement in the literature as to the exact characteristics of the pores that form during osmosis. Many current papers,60 reviews,103,104 and book chapters105 cite studies conducted by Seeman et al. in 1973 in which thin section electron micrographs demonstrate the formation of multiple pores between 200 – 500 Å in diameter within 10 s of exposure to hypotonic buffer.106 However, follow-up studies conducted by Lieber et al. nearly 10 years later found contradicting results when they used light microscopy to observe the formation of a single pore per
51
First, erythrocytes are isolated from whole blood through centrifugation techniques in which the erythrocytes fall to the bottom as a compact pellet while the other blood components (serum, monocytes, etc.) remain suspended. The isolated erythrocytes are then exposed to a hypotonic buffer (< 300 mOsm/L) and water rushes inside the cells in an effort to maintain osmotic equilibrium. Because membrane surface area is fixed and designed to deform, the cells swell into spheres upon water influx and form reversible pores (discussed above). During the time in which the pores are open, intracellular and extracellular material can be exchanged. Most notably, hemoglobin exits while drugs, enzymes, and other material enters. During swelling, the erythrocyte volume can increase up to 50 – 75 % of its initial point.109 The
53
The first encapsulation procedure investigated to load phototherapeutics described in Chapter 3 was the hypotonic dilution method. Hypotonic dilution involves suspending packed erythrocytes in 2 - 20 volumes of hypotonic buffer containing the entity to be loaded and then resealing the cells by returning the solution to isotonicity. The advantages of this strategy
include simplicity as well as cost and time effectiveness. Ihler60 and Dale112,113 demonstrated the advantages of using the erythrocyte interior for enzyme encapsulation and RES targeting in the 1970s with the hypotonic dilution strategy.109 Independently, they sought to develop an effective vehicle for glucocerebrosidase as means to enhance enzyme replacement therapy to treat Gaucher’s disease. It should be noted that this strategy was employed so that loaded erythrocytes would be effectively taken up by spleen and liver clearance mechanisms. Traditional enzyme replacement therapy is largely ineffective due to immunogenicity (namely, the production of antibodies), lack of bioavailability, and fast clearance rate.114 Fast clearance presents additional problems as administration frequency must be increased to maintain the therapeutic blood index, leading to further immune reactions. It is possible that encapsulating enzymes in erythrocytes will improve pharmacodynamics, pharmacokinetics, and safety of the treatment by reducing the chances of adverse immune responses. Although
55
Hypotonic dilution encapsulation offers an attractive strategy for proof of concept studies and initial investigations. However, it is also clear that it presents limitations. Hypotonic dilution is damaging to the cells, often altering physical properties of resealed erythrocytes and leading to increased membrane instability, cell fragility, low encapsulation efficiency, poor cell recovery, and short life spans when re-injected in vivo.103 RBC damage can become advantageous when targeting loaded cells to clearance organs, but the phototherapeutics described here are most useful when they are able to circulate for an extended period. Therefore, to ensure proper survival and circulation after re-injection, a different procedure that produces carrier erythrocytes more closely retain native characteristics was needed.
A gentler and more effective hypotonic dialysis procedure was pioneered by Deloach and Ihler115 and Dale et al.116,117 in 1977 as a way to better preserve native erythrocyte morphology and increase natural circulation time of engineered erythrocytes. Hypotonic dialysis is performed by exposing erythrocytes at 70% hematocrit and the material to be encapsulated to an
environment of reduced osmotic pressure (such as a hypotonic solution) in conventional dialysis tubing. It is thought that the gradual decrease in ionic strength achieved by separating the cells from direct contact with the hypotonic solution and minimizing the extracellular volume, better maintains the structural integrity of the cell membrane. This method produces more viable cells that preserve biochemical and physiological characteristics of native erythrocytes and results in a higher encapsulation efficiency than hypotonic hemolysis (30 - 50% vs 1 - 8%). Other
Erythrocyte carriers are emerging as viable solutions to challenges of drug
biocompatibility and efficacy in human patients. In recent years progress has been made in procedure optimization for human erythrocytes. These advances have led to the emergence of two major companies, which have independently developed automated ex vivo medical devices to handle and load erythrocytes in an industrial-scaled procedure under blood banking
57 1.10.2.1. Clinical Application
The first company to investigate erythrocytes in clinical trials was ERYTECH Pharma, a clinical stage biopharmaceutical company that focuses on innovative treatments for rare cancers and orphan diseases. ERYTECH’s instrumentation is their proprietary platform ERYcaps, a technology patented by Godfrin in 2006.118 The technique follows the hypotonic dialysis method to encapsulate active drugs into erythrocytes. Briefly, 250 - 350 mL of
transfusion-grade, packed erythrocytes from compatible blood donors are swollen and resealed by exposing them to reversible hypotonic and hypertonic stress environments in a sterile unit. The entire procedure takes 3 h and the resulting resealed erythrocytes have almost normal circulation times when administered to patients, making them ideal for prolonging drug activity lifetime. Other advantages include decreased risk of side effects, high reproducibility, and broad applicability with the ability to encapsulate biological molecules between 1 to 500 kDa in
size.119,120 While ERYTECH has applied their platform to various diseases in oncology, immuno-oncology, and enzymatic disorders, their most progressive work implements erythrocyte loaded L-asparaginase to treat Acute Lymphoblastic Leukemia. Phase I and II clinical trials continue to demonstrate a notable reduction in percentage and severity of allergic reactions when
The second company, EryDel SpA, was founded based on their proprietary technology coined “The Red Cell Loader,” developed by Magnani et al. in 1998. This instrumentation uses the functionality of the hypotonic preswell method, instead of dialysis, to load erythrocytes. The fully automated Red Cell Loader combines sterile, portable, disposable kits with a specially designed software process. The erythrocytes to be loaded can be taken directly from the patient, employing as little as 50 mL of whole blood and alleviating concerns of blood compatibility. Packed erythrocytes are swollen through exposure to two sequential steps of hypotonic dilutions that open the pores in a slow, controlled manner before resealing them by returning the erythrocytes to isotonic conditions. This procedure takes only 90 min and the carrier erythrocytes can be rapidly re-infused to the patient, mitigating in vitro leakage. The most prominent drug used by the EryDel team is the non-membrane permeable prodrug
dexamethasone 21-phosphate (DSP). While encapsulated in carrier erythrocytes, DSP circulates while slowly being hydrolyzed to form the membrane permeable therapeutic, dexamethasone. In this way, active drug is continuously released and maintains a
therapeutically relevant concentration in the blood stream for an extended period of time. This platform is called the EryDex System.
1.11. Conclusion
59 REFERENCES
(1) Iii, B. F. Na’ Movement in a Single Turnover of the Na Pump (Na,K-ATPase/Membrane Transport/Rapid Kinetics/Membrane Vesicles); 1984; Vol. 81.
(2) Photoremovable Protecting Groups in Organic Synthesis.
(3) Lawrence, D. S. The Preparation and in Vivo Applications of Caged Peptides and Proteins. Current Opinion in Chemical Biology 2005, 9 (6), 570-575.
(4) Mayer, G.; Hechel, A. Biologically Active Molecules with a “Light Switch”. Angew Chem Int Ed Engl. 2006, 45 (30), 4900-4921.
(5) Ellis-Davies, G. C. R. Caged Compounds: Photorelease Technology for Control of Cellular Chemistry and Physiology. Nat Methods 2007, 4 (8), 619-628.
(6) Yu, H.; Li, J.; Wu, D.; Qiu, Z.; Zhang, Y. Chemistry and Biological Applications of Photo-Labile Organic Molecules. Chem Soc Rev 2010, 39 (2), 464-473.
(7) Brieke, C.; Rohrbach, F.; Gottschalk, A.; Mayer, G.; Heckel, A. Light-Controlled Tools. Angew Chem Int Ed Engl. 2012, 51 (34), 8446-8476.
(8) Matsuzaki, M.; Ellis-Davies, G. C. R.; Nemoto, T.; Miyashita, Y.; Iino, M.; Kasai, H. Dendritic Spine Geometry Is Critical for AMPA Receptor Expression in Hippocampal CA1 Pyramidal Neurons. Nat. Neurosci. 2001, 4 (11), 1086-1092.
(9) Guruge, C.; Ouedraogo, Y. P.; Comitz, R. L.; Ma, J.; Losonczy, A.; Nesnas, N. Improved Synthesis of Caged Glutamate and Caging Each Functional Group. ACS Chemical Neuroscience. 2018, 21 (9), 2713-2721.
(10) Zayat, L.; Calero, C.; Alborés, P.; Baraldo, L.; Etchenique, R. A New Strategy for Neurochemical Photodelivery: Metal-Ligand Heterolytic Cleavage. J. Am. Chem. Soc. 2003, 125 (4), 882-883.
(11) Fino, E. RuBi-Glutamate: Two-Photon and Visible-Light Photoactivation of Neurons and Dendritic Spines. Front. Neural Circuits 2009, 3.
(12) Ellis-Davies, G. C. R.; Matsuzaki, M.; Paukert, M.; Kasai, H.; Bergles, D. E.
4-Carboxymethoxy-5,7-Dinitroindolinyl-Glu: An Improved Caged Glutamate for Expeditious Ultraviolet and Two-Photon Photolysis in Brain Slices. J. Neurosci. 2007, 27 (25), 6601-6604.
(13) Aujard, I.; Benbrahim, C.; Gouget, M.; Ruel, O.; Baudin, J.-B.; Neveu, P.; Jullien, L. O-Nitrobenzyl Photolabile Protecting Groups With Red-Shifted Absorption: Syntheses and Uncaging Cross-Sections for One- and Two-Photon Excitation. Chemistry 2006, 12 (26), 6865-6879.