EVALUATING THE PROCESS, COSTS, AND OUTCOMES OF ENGAGING NATURAL LEADERS AND TEACHERS IN COMMUNITY‐LED TOTAL SANITATION
Jonny Crocker
A dissertation submitted to the faculty at the University of North Carolina at Chapel Hill in partial fulfillment of the requirements for the degree of Doctor of Philosophy in the Department of
Environmental Sciences and Engineering in the Gillings School of Global Public Health.
Chapel Hill 2016
Approved by:
Jamie Bartram
Greg Characklis
David Gute
Pete Kolsky
Subhrendu Pattanayak
ABSTRACT
Jonny Crocker: Evaluating the process, costs, and outcomes of engaging natural leaders and teachers in community‐led total sanitation
(Under the direction of Jamie Bartram)
Sanitation is a global priority: 1 billion people lack access to any sanitation facility and practice open defecation, which contributes to child mortality, stunting, and decreased school attendance. Community‐led total sanitation (CLTS) is a sanitation promotion approach implemented in over 50 countries, in which a facilitator visits a village, and “triggers” a collective desire to eliminate open defecation (OD). Implementing CLTS has challenges: it requires frequent follow‐up visits by facilitators, depends on collective action by communities, and the costs are not well understood.
I conducted an operational research project collaboratively with Plan International to investigate the role of CLTS in addressing global sanitation challenges, and how to optimize implementation. Chapter 1 of this dissertation is an evaluation of training “natural leaders” (NLs— motivated community members) during a CLTS intervention in Ghana, using a multi‐site, randomized field trial. Chapter 2 is an evaluation of teacher‐facilitated CLTS in Ethiopia, using a multi‐site, quasi‐ experimental study design. Chapter 3 is a bottom‐up, activity‐based cost analysis of the Ghana and Ethiopia interventions.
CLTS should be targeted to villages with high OD, where potential for impact is higher. Training NLs can reduce OD, provided they are from cohesive villages. CLTS should be part of a broader
ACKNOWLEDGEMENTS
Funding for this research was provided by a Bill & Melinda Gates Foundation grant, and by a National Institute of Environmental Health Sciences Training Grant (T32ES007018).
I would like to thank my advisor, Jamie Bartram, for his mentorship, his unfailing confidence in my work, and for being a friend as well as an advisor. I would like to thank my committee members, Pete Kolsky, Greg Characklis, David Gute, and Subhrendu Pattanayak, for their guidance and support throughout my PhD. Thank you to Kate Shields, who contributed to data management and analysis. Thank you to Vidya Venkataramanan and Ryan Rowe, who collaborated with me on this project. I would like recognize Chris Wiesen for his input on the statistical analysis. I would also like to recognize Clarissa Brocklehurst for her recommendations on how to improve the presentation of the research.
I would like to thank my colleagues at Plan International, who worked well beyond their responsibilities, and without whom this research would not have been possible. In the US: Darren Saywell, Liza Douglas, Mulugeta Balecha, and Lauren Yamagata. In Ghana: Daniel Asamani, William Domapielle, Elvis Abodoo, and Benedict Gyapong. In Ethiopia: Fisseha Atalie, Abiyot Geremew, and Messele Yetie.
TABLE OF CONTENTS
LIST OF TABLES ... x
LIST OF FIGURES ... xi
LIST OF ABBREVIATIONS ... xii
INTRODUCTION ... 1
CHAPTER 1: IMPACT EVALUATION OF TRAINING NATURAL LEADERS DURING A COMMUNITY‐LED TOTAL SANITATION INTERVENTION: A RANDOMIZED FIELD TRIAL IN GHANA ... 6
Introduction ... 6
Methods ... 8
Program Description ... 8
Study Design ... 9
Sampling ... 10
Data Collection ... 11
Analysis ... 12
Results ... 13
Descriptive Statistics ... 13
Sanitation Outcomes ... 14
Implementation Process ... 18
Discussion ... 21
Limitations ... 23
CHAPTER 2. TEACHERS AND SANITATION PROMOTION: AN ASSESSMENT OF
COMMUNITY‐LED TOTAL SANITATION IN ETHIOPIA ... 26
Introduction ... 26
Methods ... 28
Program Description ... 28
Study Design ... 29
Sampling ... 30
Data Collection ... 30
Analysis ... 31
Results ... 32
Baseline Statistics ... 32
Sanitation Outcomes ... 33
Implementation Process ... 38
Discussion ... 40
Conclusions ... 42
CHAPTER 3. PROCESS AND COST ANALYSIS OF FOUR COMMUNITY‐LED TOTAL SANITATION INTERVENTIONS IN GHANA AND ETHIOPIA ... 43
Introduction ... 43
Methods ... 46
Project Description ... 46
Context ... 47
Cost Categorization ... 47
Data Collection and Management ... 48
Analysis ... 49
Results ... 51
Local Actors and Member Costs ... 53
Time Contributions to CLTS ... 55
Discussion ... 58
Summary and Interpretation of Ghana Program Costs ... 58
Summary and Interpretation of Ethiopia Program Costs ... 58
Comparison of Ghana and Ethiopia Program Costs ... 59
Summary and Interpretation of Local Costs ... 60
Summary and Interpretation of Time on CLTS ... 60
Placing this Research in the Context of Existing Evidence: ... 61
Methods Contribution ... 63
Relevance of Findings ... 63
Limitations ... 64
Conclusions ... 65
CHAPTER 4: CONCLUSION ... 66
Operational Research Methodology ... 66
Summarized Findings ... 69
Implications ... 70
Final Words ... 73
APPENDIX 1: CENSUS AND SURVEY SAMPLING COUNTS AND SANITATION PRACTICE VARIABLE ... 75
APPENDIX 2: GHANA ORDERED LOGISTIC REGRESSION OUTPUTS AND TRANSFORMED PARAMETERS ... 76
APPENDIX 3: GHANA HOUSEHOLD SURVEY ... 80
APPENDIX 4: GHANA NATURAL LEADER SURVEY ... 94
APPENDIX 6: ETHIOPIA ORDERED LOGISTIC REGRESSION OUTPUTS AND
TRANSFORMED PARAMETERS ... 105 APPENDIX 7: SANITATION PRACTICE BEFORE AND AFTER CONVENTIONAL AND
TEACHER‐FACILITATED CLTS INTERVENTIONS IN ETHIOPIA ... 105 APPENDIX 8: ETHIOPIA FOLLOW‐UP HOUSEHOLD SURVEY ... 109 APPENDIX 9: PROJECT ACTIVITIES AND RESPONSIBLE PARTIES, BY COUNTRY AND INTERVENTION ... 119 APPENDIX 10: IMPLEMENTATION TIMELINE FOR FOUR CLTS INTERVENTIONS, GHANA AND ETHIOPIA ... 120 APPENDIX 11: COST CATEGORIES, SUB‐CATEGORIES, DATA SOURCES, AND DATA
DESCRIPTIONS ... 121 APPENDIX 12: UNIT COSTS AND DATA SOURCES ... 124 APPENDIX 13: DISAGGREGATED PROGRAM, LOCAL ACTOR, AND COMMUNITY COSTS ... 124 APPENDIX 14: ANALYSIS OF COST SENSITIVITY TO ESTIMATED PARAMETERS ... 131 APPENDIX 15: MANAGEMENT CHECKLIST ... 133 APPENDIX 16: CHECKLISTS 1 AND 2 FOR TRAINING AND FOR COMMUNITY VISITS, GHANA VERSION ... 134 REFERENCES ... 139
LIST OF TABLES
Table 1. Household and respondent characteristics of 29 villages receiving CLTS, and
29 villages receiving CLTS with natural leader training added on. ... 14
Table 2. Household ownership of a private latrine before and after CLTS and CLTS + NL training in Ghana, by region and intervention. ... 17
Table 3. Characteristics of latrines built during CLTS compared to pre‐existing latrines in 58 villages in Ghana. ... 18
Table 4. Implementation details – natural leaders trained, village visits, and community presence at triggering, by region and treatment. ... 19
Table 5. Implementation details – local actor and community activity during CLTS, by region and treatment. ... 20
Table 6. Characteristics of study population receiving CLTS interventions, by region. ... 20
Table 7. Household and respondent characteristics at baseline by comparison group. ... 33
Table 8. Household ownership of a private latrine, and latrine characteristics, before and after CLTS interventions in Ethiopia. ... 37
Table 9. Baseline and follow‐up open defecation levels, and ODF certification dates, by kebele. ... 37
Table 10. Implementation details – facilitators trained and leadership attendance at triggerings. ... 38
Table 11. Household interactions and activities for conventional and teacher‐ facilitated CLTS kebeles at baseline and follow‐up. ... 39
Table 12. Plan’s implementation activities for four CLTS interventions in Ghana and Ethiopia. ... 47
Table 13. Descriptive statistics for villages receiving four CLTS interventions. ... 51
Table 14. Breakdown of program costs for four CLTS interventions in Ghana and Ethiopia. ... 53
Table 15. Breakdown of local costs for four CLTS interventions in Ghana and Ethiopia. ... 55
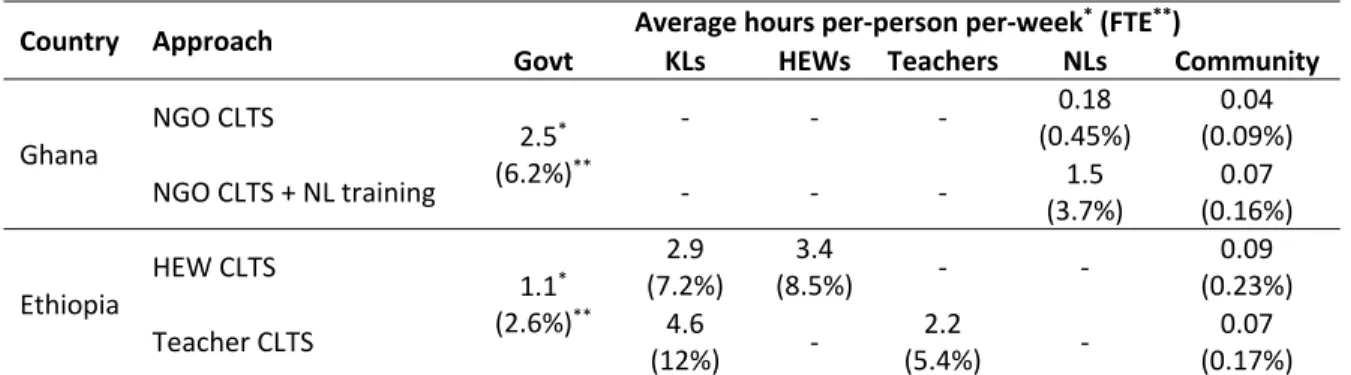
Table 16. Ratio of actors’ hours spent on CLTS implementation. ... 56
LIST OF FIGURES
Figure 1. Timeline and sequence of the randomized field trial study design and execution. ... 10
Figure 2. Impact of training natural leaders on open defecation as an add‐on activity to CLTS in Ghana, full sample and by region. ... 15
Figure 3. Impact on sanitation practice of training natural leaders as an add‐ on activity to CLTS in Ghana. ... 16
Figure 4. Timeline and sequence of the quasi‐experimental study design and execution. ... 29
Figure 5. Open defecation before and after conventional and teacher‐facilitated CLTS interventions in Ethiopia. ... 35
Figure 6. Sanitation practices before and after CLTS interventions in Ethiopia. ... 36
Figure 7. Program cost of four CLTS interventions in Ghana and Ethiopia, per household targeted. ... 52
Figure 8. Components of program cost categories for CLTS interventions in Ghana and Ethiopia. ... 53
Figure 9. Local actor and community costs of four CLTS interventions in Ghana and Ethiopia, per household targeted. ... 54
Figure 10. Hours spent on CLTS by different actors per 10,000 people targeted, by month, Ghana. ... 57
LIST OF ABBREVIATIONS AAA American Automobile Association
CI confidence interval
CLTS community‐led total sanitation DID difference in difference FTE full‐time equivalent HEW health extension worker
HH household
KL kebele leader
LNGO local non‐governmental organization NGO non‐governmental organization NL natural leader
OD open defecation ODF open defecation free pp percentage points PVC polyvinyl chloride
SDG Sustainable Development Goal SE standard error
SNNP Southern Nations, Nationalities, and Peoples TDC top‐down costing
TSC total sanitation campaign UN United Nations
INTRODUCTION
While sanitation has improved dramatically in the past decade, globally 2.5 billion people lack access to improved sanitation (more than a third of the world’s population). An estimated 1 billion lack access to any sanitation facility and practice open defecation,1 though the actual number is probably much higher.2,3 Almost half of child stunting can be explained by levels of open defecation,4 though the exact mechanism by which open defecation affects growth is not clear, nor are the health benefits of specific sanitation interventions and service levels.5 There are rationales for sanitation beyond health. Sanitation can lead to improved social status and dignity,6,7 gender‐equity benefits,8 increased school attendance for girls,9 and time savings and increased productivity.10 However, increased access to sanitation is often not sustained when latrines breakdown, and access to sanitation does not always guarantee use when demand is not stimulated.11,12
A number of approaches have emerged for promoting sanitation and hygiene behavior change, including participatory hygiene and sanitation transformation (PHAST), community health clubs, and community‐led total sanitation (CLTS).13–15 Community‐led total sanitation (CLTS) emerged in the year 2000 as a participatory approach to address open defecation (OD), and draws on a variety of emotional triggers such as shame and disgust to bring awareness to sanitation issues.15 CLTS has been
follow‐up, facilitators visit the village to monitor progress and guide their efforts to eliminate OD. If, during follow‐up, a community has determined that open defecation is no longer practiced and the environment has been cleaned of all exposed feces, they can request that a district government team visit and certify them as open defecation free (ODF).
I worked on a systematic review of CLTS literature with another PhD student,19 which is summarized briefly here. The literature review answered four questions. First, what does the evidence show regarding the success or failure of CLTS? Second, have interventions focusing on natural leaders shown an impact on sanitation and hygiene outcomes, and if so what is the nature and magnitude of this impact? Third, have interventions focusing on teachers and schools shown an impact on sanitation and hygiene outcomes, and if so what is the nature and magnitude of this impact? Fourth, have interventions focusing on district/local government actors shown an impact on sanitation and hygiene outcomes, and if so what is the nature and magnitude of this impact? The review covered journal‐ published and gray literature (all documents available to the public but not in peer‐reviewed journals). Separate search and selection methods were used for each type of literature.
We found few scientific studies on sanitation promotion, and only one rigorous trial of a sanitation promotion intervention.20 Since the systematic review, a number of other evaluations of sanitation promotion interventions have been published which demonstrated an impact on latrine construction and adoption,21–23 and one evaluation of India’s Total Sanitation Campaign that
The systematic review of CLTS gray literature reviewed 115 documents, and found that project settings and processes were well‐described, but there was a preponderance of low quality study designs and data collection methods.19 The following conclusions were drawn from the gray literature. The importance of structured monitoring and evaluation mechanisms, especially to sustain behavior change and the scale‐up of CLTS activities, was emphasized in most documents. Structured follow‐up activities after triggering were reported to have helped communities eliminate open defecation. Natural leaders, teachers, and local government actors were all referenced as important actors in CLTS implementation across the gray literature, but no evaluations were found of their role in achieving CLTS outcomes. Research with the objective of informing policy and practice has been given a variety of names in different fields, such as implementation science and operational research. Notable principles of implementation science are collaboration between researchers and practitioners in defining research questions, and study of existing programs.26 Others have coherently argued that research methods should be applied to programs as normally practiced,27 that rigorous evaluations focused on service delivery may have the most potential to influence policy,28 and that research on preventative programs should be emphasized over causes of disease.29 Another paper sets criteria for evaluating evidence on public health interventions, by adapting and expanding on criteria for evaluating clinical evidence, with consideration given to the fact that public health interventions tend to be complex, programmatic, and context dependent.30 The authors conclude that evidence on public health interventions should include information on context, details of the intervention, and its efficiency and effectiveness, so that the transferability of the intervention can be determined. Although many sanitation and hygiene
My doctoral dissertation comprises operational research on CLTS interventions in Ghana and Ethiopia. The project was conducted as a partnership with Plan International (Plan), who led all implementation, as part of a grant from the Bill & Melinda Gates Foundation. We worked together throughout the project, beginning with collaboratively defining the research questions and writing the grant proposal. The interventions focused on evaluating variations on the CLTS approach, which were designed by Plan in response to challenges they have faced. The context, process, costs, and
effectiveness for all of the interventions evaluated are included in this dissertation.
In both Ghana and Ethiopia, Plan’s local country staff have been implementing CLTS for over eight years. In response to the various challenges they have faced in scaling‐up CLTS, they have begun piloting variations in the CLTS approach with mixed success. In Ghana, Plan staff have trained “natural leaders” (NLs – community members who quickly adopt latrine use and try to influence others to do the same) in a variety of technical and social skills, with the aim of improving CLTS outcomes. In Ethiopia, Plan staff have trained teachers to facilitate the CLTS approach. CLTS facilitation is usually the
responsibility of NGO staff and health workers, but health workers are responsible for 15 tasks in addition to CLTS, and are not able to perform adequate follow up. Plan trained teachers with the aim of alleviating some of the burden on health workers, without decreasing CLTS outcomes.
CHAPTER 1: IMPACT EVALUATION OF TRAINING NATURAL LEADERS DURING A COMMUNITY‐LED TOTAL SANITATION INTERVENTION: A RANDOMIZED FIELD TRIAL IN GHANA
Introduction
Sanitation and hygiene behavior change interventions have often incorporated recruiting and training of authority figures such as village leaders, or those in a related profession such as health workers or teachers, to deliver and reinforce behavior change messages. Multiple studies have
evaluated interventions that include recruiting local actors, all of which reported positive behavioral or health outcomes. 31–36 However, only three of the studies included random assignment,31,33,34 and none were able to attribute outcomes to recruiting or training local actors, as engagement of local actors was embedded within a broader project in each case. One study trained volunteers in sanitation and hygiene promotion, rather than pre‐identified authority figures or professionals. The study evaluated
participatory training for mothers, and found changes in behavioral and health outcomes, although they could not be attributed to the intervention due to the quasi‐experimental study design and small sample size.37 A recent systematic review of social marketing in water, sanitation, and hygiene (WaSH) found a number of high quality studies on promotion of water treatment and handwashing, but only two that included sanitation promotion.38 Many of these studies find that outcomes are skewed toward certain members of a community (such as children when students were trained, or women when teachers or mothers were trained), or hypothesize that the success of the interventions was partially due to the project occurring in a favorable setting.
triggering), and that diffusion beyond early adopters through a social network depends on
communication and the social system.39 A cross‐sectional study in India found that individuals were more influenced to adopt latrines by their peers than by the village as a whole.40 A recent evaluation of community‐led total sanitation (CLTS) in Indonesia found that the intervention succeeded best in villages with high initial “social capital” or participation, and the intervention failed or even had negative impacts in villages with low social capital.41 However, two studies on water resources have cautioned against participatory approaches, hypothesizing that both formal and informal power structures may concentrate benefits among a few to the exclusion of the most disadvantaged.42,43 An editorial on participatory development hypothesized that interventions in communities with endogenous
imperfections (or low social capital) will often lead to appropriation of benefits by the most powerful community members.44
Community‐led total sanitation is a participatory sanitation and hygiene promotion approach in which an external facilitator triggers an awareness of sanitation and hygiene issues with the aim of generating collective action to eliminate open defecation.15 A few evaluations of CLTS or similar
sanitation promotion projects have been conducted, all of which have shown impact on latrine adoption and behaviors,20–22,24,45 two of which found an impact on child health.24,45
mentioned frequently in CLTS gray literature,19 but they are not mentioned in any of the CLTS peer‐ reviewed literature. Plan International Ghana (Plan) has worked on CLTS since 2009 in Ghana. They have found intensive, long‐term follow‐up is required, and in many cases communities do not respond well to CLTS. They proposed that training natural leaders in a variety of skills, from conflict resolution to latrine construction, could improve the community response to CLTS by improving community dynamics and instilling capacity to build latrines.
We used a randomized field trial design to evaluate the impact of training natural leaders on sanitation outcomes in Ghana. This study was designed as operational research, to generate
implications for policy and practice. The evaluation included multiple sites (regions in Ghana), paired with situational assessments before interventions began, to study how outcomes varied across settings. Implementation processes, natural leader and community member activities, and a variety of outcomes were tracked, to enable insight into the mechanism if training natural leaders had an impact. This study was a collaborative effort, with UNC leading the research and Plan leading implementation.
Methods Program Description
Two different interventions were implemented in rural Ghana. The first intervention (“CLTS”) was CLTS as it has typically been implemented in Ghana. The second intervention (“CLTS + NL training”) was CLTS with additional training given to natural leaders on a variety of participatory, social, and technical skills. The full training manual is available online.46
(comprising pre‐trigging, triggering, and at least one follow‐up visit) had occurred. Plan and district government officials then trained the identified natural leaders from only those villages receiving the CLTS + NL training intervention in groups in the regional capitals. Training consisted of an initial 4‐day session in March 2013, and three 1‐day review meetings and a 4‐day refresher training over the
following year. Natural leaders identified for training had built a latrine (or owned one) within the first 3‐ months of the CLTS intervention, consistently showed up to community meetings, and worked to convince others from their village to build a latrine. No natural leaders under 18 years of age were trained. At least one female was trained from each village. A timeline of implementation activities for both interventions is in the appendix, and detailed implementation activities are available online in a report written by Plan.47 The implementation in this project was enabled by broad exogenous factors. Plan had prior experience implementing CLTS, working with natural leaders, and collaborating with the government on sanitation and hygiene. The Government of Ghana has included CLTS in national policy, and has institutional support mechanisms in place, such coordinating committees for sanitation at the national and regional levels.48
Study Design
Figure 1. Timeline and sequence of the randomized field trial study design and execution.
Sampling
The Central, Upper West, and Volta regions in Ghana were selected for inclusion in this project as they have different environmental and social conditions, had high levels of open defecation, and Plan had an established relationship with regional government. One district was selected from each region in which the local government was familiar with CLTS, and most villages had not received a CLTS
intervention. Twenty villages were randomly selected in each district for inclusion in the study. Villages eligible for inclusion were those with no prior CLTS, and a population of 300‐1000 people according to district records. Two villages in the Central region were withdrawn from the study in January 2013 when village leaders turned down the CLTS intervention, reducing the number of study villages to 58.
exception of one village consisting of only 7 households). Twenty‐six percent of all households were sampled (1759), of which 97 percent were surveyed (1708). This sample size allows for a detectable difference in latrine ownership between treatment arms ranging from 12 percentage points (10 to 22 percentage points) to 18 percentage points (40 to 58 percentage points) with 80% power, 95% statistical significance, and village‐clustering of outcomes accounted for with a conservative intra‐class correlation of 0.2.20,22,49,50 Census and sampling details are in the appendix.
Data Collection
Village and household characteristics, sanitation and hygiene outcomes, and sanitation‐related activities were measured using household surveys, and latrine and handwashing station observations. Survey responses regarding latrines and handwashing stations were validated with surveyor
observations. Indicators were selected based on review of prior WaSH research,19,20,51,52 and input from UNC and Plan. Surveys were administered by an independent contractor with extensive experience in Ghana, one team lead per region, and local surveyors. Household surveys were translated into the local languages (Fante, Ewe, and Waale) by surveyors during training, translations checked for accuracy by team leads, and then CLTS‐related terms checked by Plan staff. The survey tools were developed in SurveyCTO software, and responses and observations recorded on Android devices. Surveys were pre‐ tested during training and piloted in non‐project villages. Team leads reviewed survey responses and counts each evening, and Plan staff were available to answer questions. Surveyors were audited by the regional team leaders visiting a random selection of households each evening to verify the accuracy of data collected.
administered by the same contractor and team using the same protocol. Survey tools are available in the appendix.
Semi‐structured interviews with Plan and district government were used to understand the context of each region and the implementation process and challenges. Government officials were interviewed in June 2012, before the interventions began. Plan staff were interviewed in December 2012 and March 2014, at the beginning and end of the interventions. Interviews were administered in English, which was comfortably spoke by all interviewees. The CLTS process was monitored with
checklists filled out by Plan, interviews with Plan and district government, teacher and HEW surveys, and questions on interactions in household surveys.
Analysis
unequal selection probabilities, and non‐response rates, was accounted for using the “svyset” command in STATA.
This study was reviewed and approved by the Office of Human Research Ethics of the University of North Carolina, Chapel Hill (study #12‐1970). Local approval was obtained from regional
environmental health and sanitation directorates within Ghana. Informed consent was received from all respondents.
Results Descriptive Statistics
Table 1 includes characteristics of households and respondents, by treatment group, estimated from the follow‐up survey. Variables that would not likely to be influenced by the interventions are presented, as they can be used to assess the balance across the treatment groups with data collected after the interventions. Most characteristics are balanced. One showed a significant difference across treatment groups at p < 0.1 (years in village). Families in the CLTS + NL training treatment group had lived in their village an average of 5.2 years less than families in the conventional treatment group (25.4 and 30.6 years, p = 0.038). Random assignment of villages was used to ensure internal validity, and all analysis accounts for the study design and sampling.
Table 1. Household and respondent characteristics of 29 villages receiving CLTS, and 29 villages receiving CLTS with natural leader training added on.
Variable CLTS CLTS + NL
training t‐stat p‐value Average village size (households) 209 162 ‐0.88 0.380
Average compound size 2.3 2.7 1.17 0.247
Average household size 4.1 3.9 ‐0.65 0.521
Children under five years of age 0.7 0.6 ‐1.05 0.298
Female respondent 74% 69% ‐1.37 0.177
Average age 44 43 ‐0.54 0.592
Completed primary school 52% 58% 0.89 0.378
Years family lived in village 31 25 ‐2.13 0.038 Years family lived in current house 15 14 ‐1.16 0.249
Metal / fabricated roofing 88% 93% 1.16 0.252
TV ownership 34% 41% 1.40 0.166
Radio ownership 48% 50% 0.45 0.656
Cell phone owners / house 1.2 1.40 1.33 0.190
Use an improved water supply 77% 77% 0.04 0.970
Main water source is in dwelling or compound 9.0% 10.9% 0.55 0.587 Baseline private latrine ownership* 9.4% 12.7% 1.53 0.132 Twenty‐nine villages received each intervention. *All values are taken from the 1.5‐year follow up household census and survey, and describe the two treatment groups at that time, except for baseline private latrine ownership, which is based on recall of how old their latrines were.
Sanitation Outcomes
Training natural leaders as an add‐on activity to CLTS caused a 19.9 percentage point (pp) reduction in households practicing open defecation, as compared to villages that just received CLTS (95% CI: ‐8.8 to ‐30.9 pp, p < 0.001) (Figure 2). The impact was greatest in villages in the Upper West region, where the impact of the natural leader training was a 38.6 pp reduction in open defecation (95% CI: ‐14.2 to ‐63.0 pp, p = 0.002). There was a smaller reduction in OD in the villages in the Volta Region (‐ 12.4 pp, 95% CI: ‐5.1 to ‐19.7 pp, p = 0.001), and no statistically significant reduction in OD in the villages in the Central region.
Figure 2. Impact of training natural leaders on open defecation as an add‐on activity to CLTS in Ghana, full sample and by region.
The full sample is 58 villages: 18 in Central, 20 in Upper West, and 20 in Volta, split evenly between interventions. Horizontal lines are means for the CLTS treatment group. Bars are 95% confidence intervals. Percentages are transformed logistic regression parameters (available in the appendix). Open defecation is based on survey responses and latrine observations. All analysis accounts for unequal selection probability, non‐response rates, and village clustering. ICC = 0.618 for open defecation at the village level in the full sample.
In the full sample, the reduction in open defecation caused by the natural leader training corresponded to a small increase in use of shared latrines (4.3 pp, 95% CI: 1.7 to 6.9 pp), and a larger increase in use of private latrines (18.3 pp, 95% CI: 9.5 to 27.1 pp) (Figure 3).
0% 20% 40% 60% 80% 100%
CLTS CLTS + training
CLTS CLTS + training
CLTS CLTS + training
CLTS CLTS + training
Percentage
o
f
househo
lds
practicing
o
pen
defecation
Full sample ‐19.9 pp p=0.000
Central ‐11.1 pp p=0.157
Upper West ‐38.6 pp p=0.002
Volta ‐12.4 pp p=0.001 Region:
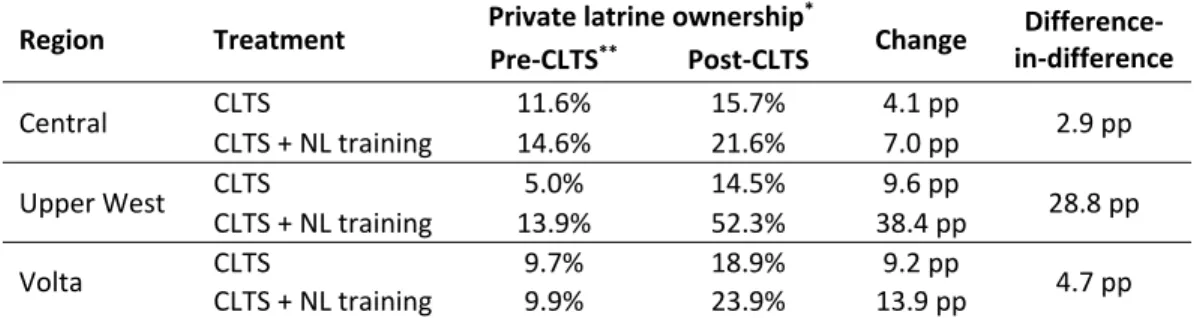
Table 2. Household ownership of a private latrine before and after CLTS and CLTS + NL training in Ghana, by region and intervention.
Region Treatment Private latrine ownership *
Change Difference‐ in‐difference Pre‐CLTS** Post‐CLTS
Central CLTS 11.6% 15.7% 4.1 pp 2.9 pp
CLTS + NL training 14.6% 21.6% 7.0 pp
Upper West CLTS 5.0% 14.5% 9.6 pp 28.8 pp
CLTS + NL training 13.9% 52.3% 38.4 pp
Volta CLTS 9.7% 18.9% 9.2 pp 4.7 pp
CLTS + NL training 9.9% 23.9% 13.9 pp
The study included 18 villages in Central, 20 in Upper West, and 20 in Volta, split evenly between interventions in each region. Percentages account for unequal selection probability and non‐response rates. ICC = 0.349 for ownership of a usable latrine at the village level in the full sample. *Private latrine ownership is different from "private latrine use" as it does not include latrines at rented households. **Pre‐CLTS private latrine ownership is based on respondent recall of the age of their latrine at the follow‐up survey.
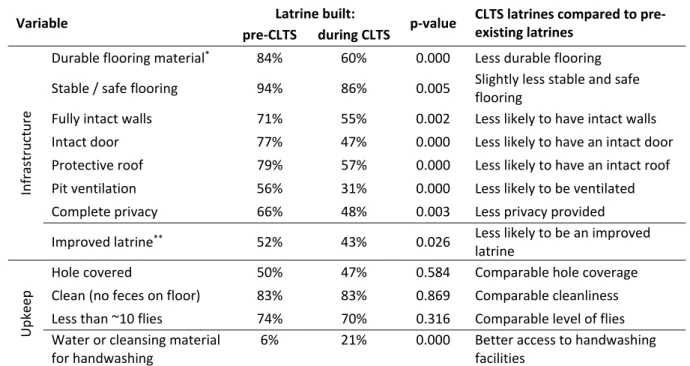
Compared to pre‐existing latrines, latrines built during the CLTS interventions were made of lower quality, less durable materials, offered users less privacy and protection from weather, and less often had a hole cover and ventilation (Table 3). However, latrine cleanliness and level of flies were comparable between latrines built during CLTS and pre‐existing latrines. Latrines were observed after the CLTS interventions, so owners of pre‐existing latrines may have upgraded or maintained them during the CLTS interventions.
Table 3. Characteristics of latrines built during CLTS compared to pre‐existing latrines in 58 villages in Ghana.
Variable Latrine built: p‐value CLTS latrines compared to pre‐
existing latrines pre‐CLTS during CLTS
Infrastructure
Durable flooring material* 84% 60% 0.000 Less durable flooring Stable / safe flooring 94% 86% 0.005 Slightly less stable and safe
flooring
Fully intact walls 71% 55% 0.002 Less likely to have intact walls Intact door 77% 47% 0.000 Less likely to have an intact door Protective roof 79% 57% 0.000 Less likely to have an intact roof Pit ventilation 56% 31% 0.000 Less likely to be ventilated Complete privacy 66% 48% 0.003 Less privacy provided Improved latrine** 52% 43% 0.026 Less likely to be an improved
latrine
Upkeep
Hole covered 50% 47% 0.584 Comparable hole coverage Clean (no feces on floor) 83% 83% 0.869 Comparable cleanliness Less than ~10 flies 74% 70% 0.316 Comparable level of flies Water or cleansing material
for handwashing
6% 21% 0.000 Better access to handwashing facilities
This analysis covers the 530 of 554 privately owned latrines and 213 of 264 shared latrines that were observed during the follow‐up survey. Latrines are in the pre‐CLTS category if households reported their latrine as more than 18 months old. The pre‐CLTS category covers 447 latrines, and the during CLTS category covers 296 latrines. Percentages and p‐values account for unequal selection probability, non‐response rates, and village clustering. *Concrete or wood. ** The “improved” latrine is a separate variable based on the Joint Monitoring Program definition, though measurement of improved latrines varies globally.1,53
Implementation Process
During the 1.5‐year implementation period, Plan facilitators averaged 12.1 visits per village that received just CLTS, and 12.9 visits per village that received CLTS + NL training (Table 4). Overall
participation in triggering (which occurred before NL training) was similar across treatment groups, though it varied between regions. After triggering was completed in all villages, eight natural leaders were trained per village, of which 35% were females. This represents a larger portion of each village in Upper West region, where villages were considerably smaller.
Table 4. Implementation details – natural leaders trained, village visits, and community presence at triggering, by region and treatment.
Treatment Region Villages HHs
Follow‐up visits per
village*
Community hours in CLTS triggering, per 10,000
people targeted.**
NLs trained*** Total Female
CLTS
Central 9 1463 12.6 7,360 0 0
Upper West 10 808 10.5 11,187 0 0
Volta 10 1172 13.2 9,752 0 0
Average ‐ ‐ 12.1 9,424 0 0
CLTS + NL training
Central 9 1495 13.1 8,634 8.0 3.6
Upper West 10 540 11.5 8,295 7.8 2.0
Volta 10 1277 14.2 9,383 8.0 3.0
Average ‐ ‐ 12.9 8,814 7.9 2.8
*Follow‐up visits includes visits by Plan, local NGOs, and government. **Triggering occurred between December 2012 ‐ March 2013, before natural leader training. ***Natural leader training occurred in March 2013, after triggering was complete in all villages.
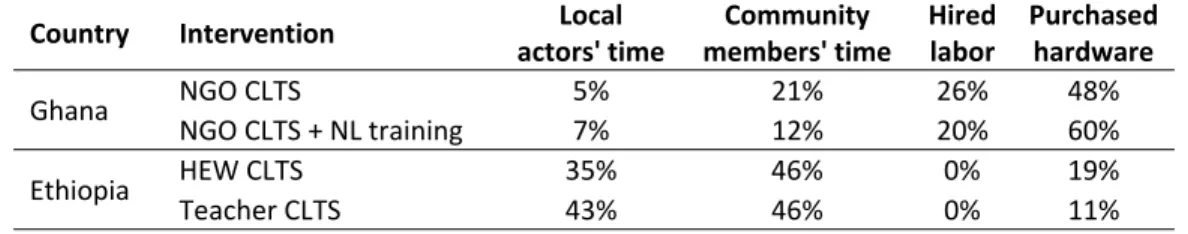
At the follow‐up survey, the percentage of community members participating in sanitation and hygiene related activities and interactions was nearly identical across treatment groups. For both treatment groups, approximately one‐third of community members reported they had attended any sanitation or hygiene meeting in the past two months, and approximately one‐third reported they had discussed sanitation or hygiene with a neighbor over the same period (Table 5). However, the intensity (total level of activity) was higher in villages where natural leaders had been trained. The time spent on facilitation by local actors and government per 10,000 people targeted was approximately 130% higher in villages where natural leaders were trained, and community time on CLTS was 80% higher (Table 5).
Table 5. Implementation details – local actor and community activity during CLTS, by region and treatment. Treatment Region Attended village sanitation / hygiene meeting in past 2 months Discussed sanitation / hygiene with a neighbor in past 2 months Local actor hours on facilitation, per
10,000 people*
Community hours on CLTS,
per 10,000 people**
CLTS
Central 30% 29% 707 18,084
Upper West 29% 30% 1,368 23,838
Volta 43% 52% 3,233 44,569
Average 30% 34% 1,696 28,037
CLTS + NL training
Central 40% 54% 2,423 44,017
Upper West 20% 29% 4,319 49,730
Volta 28% 33% 5,102 53,982
Average 30% 35% 3,925 49,236
*Local actor hours on CLTS facilitation includes time spent by natural leaders and government in villages, and excludes travel and training time. Numbers are normalized to per 10,000 people targeted. **Community and hired labor time includes time in meetings and visits, as well as time spent on latrine construction. Villages in the Upper West region differed from those in the Central and Volta regions in a number of ways (Table 6). The average village size was 67 households in Upper West, compared to a much larger 164 in Central and 122 in Volta. More people lived in each household in Upper West, with more children under the age of five, and the number of households per compound was lower. Families had lived in their villages longer. Fewer villages had prior externally funded WaSH projects, had been provided with free latrines, or materials or money for latrine construction. The villages in both the Upper West and Volta regions had lower population densities than those in the Central region. Table 6. Characteristics of study population receiving CLTS interventions, by region.
Variable Central Upper West Volta
Discussion
The impact of training natural leaders as an add‐on activity during a CLTS intervention in Ghana was a 19.9 percentage point (pp) reduction in open defecation, as compared to villages receiving only conventional CLTS. This should be interpreted as the impact of training natural leaders, not as the impact of natural leaders in general, as they existed and were identified in all project villages. The full sample included villages in three dissimilar regions in order to study how the aggregate impact estimate differed from the impact in different settings. The impact was far greater in villages in the Upper West region of Ghana (‐38.6 pp), as compared to villages in the Central and Volta regions (‐12.4 and ‐11.1 pp). The natural leader training impact on open defecation was associated with a small impact on use of shared latrines (+4.3 pp), a larger impact on use of private latrines (+18.3 pp), and no significant impact on use of communal latrines.
Latrines built during CLTS were, on average, slightly less likely to be made of durable materials, and less likely to offer users full privacy and protection from weather, as compared to pre‐existing latrines. However, pre‐existing latrines and those built during CLTS were comparable regarding cleanliness, use of hole covers, and presence of flies, indicating they were similarly maintained and protected users from exposure to fecal matter. Latrines built during CLTS were more likely to have handwashing materials present, indicating more attention to hygiene.
groups, indicating that training natural leaders did not lead to the CLTS message reaching a greater proportion of their villages. However, the overall level of activity was much higher in villages where natural leaders were trained. Natural leaders spent more time reinforcing CLTS messages, and community members spent more time discussing sanitation and building latrines.
A small number of trained individuals – natural leaders (less than 2 per 100 community members) – were able to influence the collective sanitation behavior of their communities, without money or latrine materials being provided to them or their villages. Training natural leaders increased overall sanitation‐related activity levels and interactions in their villages. While there are no studies that demonstrate an impact of training community members on WaSH behaviors, these findings seem plausible in light of a number of studies that found that social network interactions predict latrine adoption,40 and that latrine adoption decisions within villages are interlinked and spur more latrine adoption.50,54,55 Trained natural leaders were most able to influence behaviors in villages with indicators of higher social cohesion – in the Upper West region where villages were more remote, smaller, and families had lived in the villages longer. These same villages had lower exposure to externally supported WaSH projects. This aligns with recommendations in the CLTS Handbook,15 which asserts that, where prior latrine subsidies occurred, an expectation for external support can hinder collective action. The better outcomes in the Upper West region could also be explained by the higher portion of trainees per village. Eight natural leaders were trained per village, and villages in the Upper West region were smaller. Variation in outcomes across different settings is expected for interventions targeting
environmental health behaviors, as both the behaviors and exposure to hazards is influenced by social and environmental factors that vary over different settings.
leader training at increasing interactions and impacting behaviors fits with diffusion theory, in which adoption is initiated by external factors, while internal, endogenous factors (such as personal
communication) support continued diffusion.39 Existing studies focus on actors that can be identified and trained at the outset of a project, such as health workers, village leaders, teachers, or students. Interventions that focus on training easily identified actors at the outset could be failing due to not training socially relevant individuals.40 By targeting individuals based on their title or profession, prior interventions are assuming that high visibility individuals, or those in positions of authority, are the most likely to be influential. Others have hypothesized that the most well connected and highest status individuals will capture benefits of projects, which would imply that there are no “natural” leaders. The CLTS concept of natural leaders, particularly the way they are allowed to emerge after triggering in Ghana, challenges that notion.
This is the first evaluation in WaSH in which a modification or addition to an intervention is compared to an existing approach within a randomized trial. No prior studies have been able to demonstrate impact of training local actors on sanitation or hygiene outcomes. There have been many randomized trials in WaSH, however, they all follow the approach of comparing an intervention to a “do nothing” control group, or comparing entirely different interventions.22,56–58 This study was designed to be a rigorous operational research study, in order to investigate ways to improve the efficiency and effectiveness of CLTS, and how effectiveness varies across settings in order to support recommendations regarding targeting.
Limitations
monitored monthly to make sure it occurred at similar intensity across regions, and adjustments were made where deviation occurred. Prior to each natural leader training session and review meeting, the project team wrote up a Terms of Reference for that event to ensure consistency. Training sessions led by regional Plan CLTS coordinators were always attended by the project manager to further ensure consistency.
This study does not include a baseline household survey, so balance resulting from
randomization could not be demonstrated using baseline descriptive statistics. Random assignment of villages by blocks in each region was used to eliminate selection bias and ensure balance across treatment groups. Variables that are slow to change and not likely influenced by the natural leader training were used to assess balance. Standard errors, confidence intervals, and p‐values include study design sampling error and clustering of outcomes within villages.
Conclusions
defecation, expanding capacity‐building in developing countries, and strengthening participation within communities.59
Behavior change programs in environmental health should consider training community
members after the intervention is underway. Waiting to identify trainees can allow for natural leaders to emerge, and to be identified through their demonstrating they are motivated, active, and able to
influence peers within their community.
CHAPTER 2. TEACHERS AND SANITATION PROMOTION: AN ASSESSMENT OF COMMUNITY‐LED TOTAL SANITATION IN ETHIOPIA
Introduction
While sanitation has improved dramatically in the past decade, globally 2.5 billion people lack access to improved sanitation. An estimated 1 billion lack access to any sanitation facility and practice open defecation,1 although the actual number is probably much higher.2,3 Fecal contamination of the environment from poor sanitation together with poor handwashing are responsible for an estimated 577,000 deaths annually.60 Additionally, there is growing evidence that, through environmental enteropathy, open defecation contributes to more malnutrition than previously thought,61,62 and could be responsible for approximately half of child stunting.4,63,64 There are also rationales for sanitation beyond health. Many households construct latrines for improved social status and dignity,6,7 there are potential gender‐equity benefits,8 increased school attendance for girls,9 and economic benefits from time savings and increased productivity.10
Community‐led total sanitation (CLTS) emerged in the year 2000 as a participatory approach to address open defecation, and draws on a variety of emotional triggers such as shame and disgust to elicit action on sanitation issues.15 CLTS is now a well‐established approach that has been implemented in over 50 countries.16 Many, such as Ethiopia, include it in national policy.17
systematic review of 115 gray literature documents found that project settings and processes are well‐ described, but that there is a preponderance of low quality study designs and data collection methods.67 As CLTS has already been applied in over 50 countries, research to inform policy and practice is valuable. Our study is designed as operational research, and focuses on an existing public health program with the aims of generating recommendations with immediate relevance for policy and practice. Our study was collaboratively designed by an implementation organization and a research institute—the non‐governmental organization Plan International (Plan) and the Water Institute at the University of North Carolina at Chapel Hill (UNC).
Health extension workers (HEWs) are tasked with facilitating CLTS in Ethiopia, where there have been dramatic reductions in open defecation since CLTS was introduced.1,17 Every kebele (community) in Ethiopia has one health post staffed by one to three HEWs who typically are from that geographic area, speak the local language, and share cultural background with residents. A kebele is an administrative unit comprising 20‐30 villages and approximately 5000 people. HEWs are responsible for 16 separate tasks including CLTS,68 so cannot commit much time to CLTS. Plan has explored training teachers as facilitators of CLTS to alleviate some of the burden on HEWs and enable more frequent follow‐up activities, with some signs of success.69 The catchment areas for schools and health posts are the same in Ethiopia—the kebele. This enables teachers to facilitate CLTS, as they too are known within their kebele and speak the local language.
Methods Program Description
CLTS implementation in Ethiopia consists of the standard three stages from the Handbook on CLTS15: pre‐triggering, triggering, and follow‐up. Pre‐triggering includes community entry and
acceptance by leaders. Triggering consists of a community meeting where outside facilitators use tools (such as sanitation mapping) designed to “trigger” an emotional response, and a collective desire to improve the situation. Typically, each individual village within a kebele is triggered separately. However, kebeles generally function as a single community. In follow‐up, facilitators visit villages to monitor progress and guide them in eliminating open defecation. In Ethiopia, follow‐up includes emphasis on hygiene.72 When ready, a kebele can request certification by the government of open defecation free (ODF) status.73
Study Design
This study uses a mixed‐methods approach, synthesizing quantitative data from a quasi‐ experimental design with qualitative data from interviews. Six kebeles were selected from two regions, and manually assigned to receive conventional or teacher‐facilitated CLTS (Figure 4). Non‐random assignment was chosen as it allowed pre‐matching on baseline latrine access, which with six study sites was more likely to result in similar comparison groups than random assignment. Pre‐matching is established as a valuable tool for evaluating community‐demand‐driven sanitation policies.75 This method is strengthened by using a difference‐in‐difference estimator and robust outcome and covariate indicators for analysis,75 which were employed in this study.
Figure 4. Timeline and sequence of the quasi‐experimental study design and execution.
collected from household surveys, were used to understand the implementation process and to explore possible explanations for differences in outcomes between interventions.
Sampling
Two regions where Plan had prior CLTS experience and government collaboration were selected—Oromia; and the Southern Nations, Nationalities, and People’s (SNNP) Regions. One district with no prior CLTS was selected from each region (Deksis and Dara districts respectively). Three road‐ accessible kebeles with no major towns and low reported latrine access in the 2011 census were selected from each district.
Seventy‐five villages were randomly sampled, all 2444 households within those villages were approached for surveying, and 2182 households at baseline and 2263 at follow‐up were surveyed (Figure 4, sampling details in the appendix). The sample size was set to detect a difference between a 30 and 40 percentage point (pp) reduction in open defecation (i.e. a 10 pp difference‐in‐difference, β=0.8, α=0.05). We used a conservative intra‐cluster correlation (ICC) of 0.2.20,50
Data Collection
Kebele characteristics and sanitation outcomes were measured using household surveys and latrine and hand washing station observations. Surveys covered demographics, sanitation, hygiene, interactions, and recall of CLTS events. Indicators were selected from review of prior WaSH
research15,20,51,52 and input from UNC and Plan. Sanitation outcomes were assessed by asking
experienced local surveyors. Household surveys were translated into the local languages (Oromo and Sidama) by the contractor, translations checked by an independent WaSH specialist and rechecked by Plan. Printed survey tools were pre‐tested during training, piloted in non‐project kebeles, and revised in consultation with UNC. The follow‐up survey tool is available in the appendix. Survey team leaders reviewed surveys each evening, and Plan staff were available to answer questions. Surveyors were audited by Plan re‐surveying one randomly selected village per kebele (23‐40 households per audited village) with 11 questions from the full survey.
The CLTS process was monitored with checklists filled out by Plan, interviews with Plan and district government, teacher and HEW surveys, and questions on interactions in household surveys. Interviews with Plan staff on process and challenges occurred three times during and once after the interventions. Interviews with district government on context occurred just before the interventions. Plan staff and government officers spoke English and were interviewed by the primary author. Surveys on CLTS‐related knowledge, attitudes, and practices were administered to teachers and HEWs in Amharic. ODF certification dates were collected from district officials. ODF certification by district government is part of implementation and was not validated by the researchers.73
Analysis
Descriptive statistics from household surveys and observations were used to assess differences between the comparison groups at baseline. The primary outcome was household‐level sanitation practice as an ordered categorical variable including (1) open defecation, and use of a (2) communal latrine, (3) shared latrine, or (4) private latrine. Self‐reported latrine use was validated by observing latrines, and full, collapsed, and unstable latrines were categorized as open defecation. Sanitation practice definitions and measures are available in the appendix. Latrine quality and access to
A difference‐in‐difference (or treatment‐time) estimator was used to account for baseline differences in outcome variables. Sanitation practice was modelled using an ordered logistic regression as a function of treatment, survey time point (time), treatment‐time, and a range of covariates. To avoid issues with potential endogeneity, only baseline values of covariates were used. Analysis was completed in STATA 12/13/SE. The sampling design, including clustering of outcomes within villages, unequal selection probabilities, and non‐response rates, was accounted for using the “svyset” command. This study was reviewed and approved by the UNC Office of Human Research Ethics (study #12‐ 1851). Study approval was obtained from zonal and district health offices within Ethiopia. Informed consent was received from all respondents.
Results Baseline Statistics
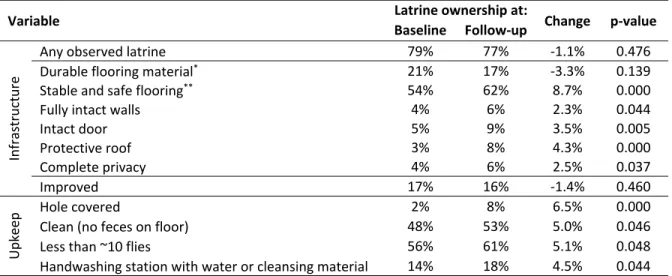
For most variables, the baseline differences between the comparison groups were insignificant (Table 7). In conventional CLTS kebeles, average household size was larger, water collection time was longer, metal roofing was more common, as was participation in village meetings and discussions regarding sanitation and hygiene with neighbors. Household ownership of a usable latrine and hand washing station was also higher in conventional CLTS kebeles, and fewer practiced open defecation. Pre‐ matching did not fully eliminate baseline sanitation differences likely because it was based on
government census data, which was not as accurate as our surveying.
Table 7. Household and respondent characteristics at baseline by comparison group.
Household or respondent characteristic Comparison group t‐stat p‐value Conventional Teacher‐fac.
Female respondent 73.2% 77.0% 1.74 0.087
Years of education* 2.03 1.72 ‐1.72 0.089
Household size (people) * 6.05 5.66 ‐3.64 0.001
Number of children* 0.94 0.94 0.02 0.981
with diarrhea in past 2 weeks* 0.18 0.19 0.27 0.787
Metal roof 28.2% 18.6% ‐3.53 0.001
Own radio 25.9% 26.6% 0.24 0.809
Own television 1.2% 0.7% ‐0.91 0.367
Number of cell phones* 0.35 0.44 2.40 0.019
Dirty household compound 33.0% 29.7% ‐1.19 0.238 Use improved water supply* 51.3% 51.0% ‐0.04 0.966 Water collection time (minutes) * 50.4 40.06 ‐3.77 0.000 Attended village meeting in past 2 months* 51.7% 38.1% ‐4.19 0.000 Visited health post in past 2 months* 32.6% 36.8% 1.59 0.117 Discussed sanitation or hygiene with a
neighbor in past 2 months* 51.2% 35.8% ‐6.15 0.000
Open defecation 37.7% 47.9% 3.75 0.000
Own a:
usable latrine 60.1% 50.9% ‐3.31 0.001
dirty latrine 19.0% 14.5% ‐2.01 0.048
clean latrine 28.8% 28.7% ‐0.01 0.993
clean latrine + handwashing station 12.3% 7.7% ‐2.74 0.008 Owns an improved latrine 22.7% 20.2% ‐1.58 0.120 Primarily uses neighbor’s latrine* 6.3% 5.4% ‐0.71 0.477 Primarily uses public latrine* 1.9% 2.6% 0.81 0.423
Want to own a latrine* 14.8% 23.4% 3.79 0.000
Plan to build a latrine in next year* 14.2% 22.5% 3.89 0.000 *Self‐reported by respondent. Remaining variables are surveyor observed. All figures account for unequal selection probability, non‐response rates, and village clustering.
Sanitation Outcomes
differences at baseline (Table 7), no multicollinearity (the highest variance inflation factor was 1.01), and could logically associate with household sanitation practices. Open defecation is measured as self‐ reported open defecation plus those with unobserved, full, or unstable‐floor latrines.
From baseline to follow‐up, the proportion of households practicing open defecation decreased in both the teacher‐facilitated and conventional CLTS groups (Figure 5). Conventional CLTS was
associated with a 6.9 percentage point greater decrease in open defecation than was teacher‐facilitated CLTS in the full sample (six kebeles in the Oromia and SNNP regions of Ethiopia) (p=0.084). The
difference‐in‐difference in open defecation was associated with minimal change in use of communal or shared latrines, and a 7.8 percentage point greater increase in use of private latrines associated with conventional CLTS (details and figure in the appendix). Outcomes varied dramatically between regions (Figure 5 and Table 9). In Oromia, conventional CLTS was associated with a 19.9 percentage point greater decrease in open defecation than was teacher‐facilitated CLTS (p=0.005). In the SNNP region, there were no significant changes in open defecation associated with either facilitation approach. Different outcomes between treatment groups cannot necessarily be solely attributed to the different facilitators, as pre‐matching does not guarantee baseline equivalency, and multivariate regression does not guarantee all differences are accounted for.
Figure 5. Open defecation before and after conventional and teacher‐facilitated CLTS interventions in Ethiopia.
Conventional includes 2 kebeles (54 villages). Teacher‐facilitated includes 4 kebeles (111 villages). Kebeles are split evenly between the Oromia and SNNP regions. Horizontal lines are baseline means. Bars are 95% confidence intervals. Open defecation is modeled from an ordered logistic regression parameters with covariates set to their means (full regressions in the appendix). Open defecation is based on survey responses and latrine observations. All analysis accounts for unequal selection probabilities, non‐response rates, and village clustering. ICC = 0.278 for open defecation at the village level. “DID” = difference‐in‐difference.
Across both interventions, open defecation decreased by 15.3 percentage points, through an increase in use of communal latrines (+ 1.9 pp), shared latrines (+4.7 pp), and private latrines (+8.7 pp) (Figure 6).
0% 10% 20% 30% 40% 50% 60% 70% 80%
Conventional Teacher‐facil. Conventional Teacher‐facil. Conventional Teacher‐facil.
Full sample Oromia SNNP
Percentage
o
f
househo
lds
practicing
open
d
efecation
Baseline Follow‐up
6.9 pp p=0.084
19.9 pp p=0.005
‐1.1 pp p=0.804 Region: