A COMPLEX PUBLIC HEALTH INTERVENTION TO IMPROVE DRINKING WATER SAFETY SHOWS CONTEXTUAL VARIABILITY IN HIGH-INCOME COUNTRIES
Karen E. Setty
A dissertation subm itted to the facult y at the Universit y of North Carolina at Chapel Hill in partial fulfillm ent of the requirem ents for the degree of Doctor of Philosoph y in the Departm ent of Environm ental Sciences and Engineering in the Gillings School of Global
Public Health .
Chapel Hill 2019
Approved b y: Jam ie Bartram A. Gu y Howard Peter J. Kolsk y
ABSTRACT
Karen E. Setty: A Complex Public Health Intervention to
Improve Drinking Water Safety Shows Contextual Variability in High-Income Countries (Under the direction of Jamie Bartram)
Risk management uses hazard identification, evaluation, and prioritization to develop and
implement active strategies for avoiding, mitigating, or reducing potential consequences. To reduce public health risks from unexpected drinking water contamination, the World Health Organization and
International Water Association have recommended proactive water safety planning since 2004. To evaluate whether and how these programs achieved expected outcomes, this research involved two observational studies that retrospectively measured changes in water quality, compliance, and health at water safety plan (WSP) implementation sites. Using a before-after associative study design, I confirmed that WSP implementation in two high-income countries corresponded to significantly improved rates of compliance with water quality standards. One location exhibited a significant 4% reduction in the incidence of acute gastroenteritis in the service area following WSP implementation, relative to a nearby comparison area with no WSP. The second study confirmed significant relationships between drinking water exposures (e.g., turbidity) and acute gastroenteritis rates at three locations, characterizing site-specific risks. A mixed-methods study at one location further illustrated changes in operational
TABLE OF CONTENTS
LIST OF TABLES ... xi
LIST OF FIGURES ... xiv
LIST OF ABBREVIATIONS... xvi
CHAPTER 1: INTRODUCTION ... 1
Background ... 1
Intervention... 2
Evaluation Frameworks ... 4
Research Questions and Dissertation Structure ... 7
CHAPTER 2: WATER QUALITY, COMPLIANCE, AND HEALTH OUTCOMES AMONG UTILITIES IMPLEMENTING WATER SAFETY PLANS IN FRANCE AND SPAIN ... 9
Introduction... 9
Methods... 11
Site Selection ... 11
Water Quality Analysis ... 15
Compliance Analysis ... 17
Health Analysis... 18
Informal Audits ... 19
Results ... 20
Water Quality... 20
Compliance ... 22
Discussion ... 29
Water Quality and Compliance Outcomes ... 29
Health Outcomes ... 31
Relationship between Water Quality and Health Outcomes ... 33
Comparison among Locations ... 33
Limitations and Future Recommendations ... 34
Conclusions ... 36
Declaration of Interest ... 36
Acknowledgements ... 37
CHAPTER 3: TIME SERIES STUDY OF WEATHER, WATER QUALITY, AND ACUTE GASTROENTERITIS AT WATER SAFETY PLAN IMPLEMENTATION SITES IN FRANCE AND SPAIN ... 38
Introduction... 38
Methods... 40
Site Selection and Description ... 40
Data Compilation ... 42
Data Analysis ... 44
Sensitivity Testing ... 46
Results ... 47
Sensitivity Testing ... 57
Discussion ... 57
Level of Risk ... 58
Weather ... 58
Multiyear Trends ... 59
WSP Implementation Status ... 61
Comparison with Other Studies ... 62
Limitations ... 63
Implications and Recommendations ... 64
Conclusions ... 66
Acknowledgments ... 67
Declaration of Interest/Role of Funding Source ... 67
CHAPTER 4: ASSESSING OPERATIONAL PERFORMANCE BENEFITS OF A WATER SAFETY PLAN IMPLEMENTED IN SOUTHWESTERN FRANCE ... 69
Introduction... 69
Methods... 71
Site Description ... 71
Data Collection and Analysis ... 72
Results ... 75
Discussion ... 80
Limitations and Recommendations ... 83
Conclusions ... 84
Acknowledgements ... 84
Declaration of Conflicting Interests ... 85
Funding ... 85
CHAPTER 5: COMPARATIVE EVALUATION OF RISK MANAGEMENT FRAMEWORKS FOR US SOURCE WATERS ... 86
Introduction... 86
Methods... 88
External Utility Interviews ... 91
Evaluation Criteria ... 91
Data Synthesis ... 92
Results ... 93
Evaluation Criteria ... 93
Framework Comparison ... 97
Discussion ... 104
Limitations ... 107
Recommendations ... 109
Conclusions ... 111
Acknowledgements ... 112
CHAPTER 6: OVERARCHING CONCLUSIONS... 113
Research Summary ... 113
Implications ... 115
Context and Complexity ... 115
Adapting the Intervention ... 116
Human-Centeredness ... 118
Spread and Scale-Up ... 120
Scope of Implications ... 123
Recommendations ... 123
Research ... 123
Practice ... 128
APPENDIX A: METHODOLOGICAL DETAIL FOR MEASURING WATER
QUALITY, COMPLIANCE, AND HEALTH OUTCOMES ... 134 APPENDIX B. RESULTS DETAIL FOR WATER QUALITY, COMPLIANCE,
AND HEALTH OUTCOMES... 136 APPENDIX C: REVIEWED LITERATURE FOR COMPARATIVE EVALUATION
OF RISK MANAGEMENT FRAMEWORKS AND TOOLS ... 149 APPENDIX D: EXTERNAL UTILITY INTERVIEW GUIDE FOR
COMPARATIVE EVALUATION OF RISK MANAGEMENT FRAMEWORKS
AND TOOLS ... 155 APPENDIX E: INPUT FROM PARTICIPATING UTILITY SURVEY USED TO
LIST OF TABLES
Table 1. Characteristics of each study location, including the number of matched municipalities included in health effects analysis for locations
1, 3, and 5 ... 12 Table 2. Time periods of water quality and health/population data availability at
each location, trimmed to 12-month intervals before and after WSP
implementation ... 15 Table 3. Summary of statistically significant water quality outcomes reported in
tables 26 through 30, grouped by improvement, degradation, and
neutral changes ... 20 Table 4. Summary of statistically significant changes in compliance after WSP
implementation at each intervention location. ... 24 Table 5. Incidence of acute gastroenteritis before and after WSP
implementation at both intervention and comparison (“comp”) areas
and model interaction term between time and site ... 26 Table 6. Incidence of acute gastroenteritis by age group at location 1, 3, and 5
intervention and comparison (“comp”) areas ... 27 Table 7. Sensitivity test of acute gastroenteritis outcomes in the overall
population and by age group at location 3 intervention and comparison (“comp”) areas, adding health data from two municipalities with less
than 30% water coverage to the intervention area ... 28 Table 8. Characteristics of study locations including country, population served,
water source, and treatment scheme ... 40 Table 9. Time periods of data availability at each study location ... 41 Table 10. Data availability at each study location ... 43 Table 11. Descriptive statistics for continuous and count variables considered
for inclusion in the models at each location ... 47 Table 12. Significance1 of linear parameter estimates regressing acute
gastroenteritis rates on individual exposure variables over tested lag times (in days prior to case reporting) prior2 to introduction of control
variables at locations 1 and 3 ... 51 Table 13. All-ages acute gastroenteritis incidence rate ratios for the linear
component of only significant exposure variables (at specified lag
times prior to case reporting) from the final model at each location ... 53 Table 14. All-ages acute gastroenteritis incidence rate ratios for the linear
component of relevant variables (at specified lag times prior to case reporting) tested after stratification of data into time periods before and
after WSP implementation at each location ... 56 Table 15. Partial list of performance indicators tracked by the utility across the
Table 16. Readings out of compliance, low-chlorine events, average free chlorine concentration, and event duration before and after WSP
implementation (2010-2017) ... 76 Table 17. Inclusion and exclusion criteria for source water risk management
literature review ... 90 Table 18. Evaluation criteria and relationship to Consolidated Framework for
Implementation Research (CFIR) Intervention Characteristics ... 94 Table 19. Summary of reviewed literature and interviews by framework ... 97 Table 20. Sample entries from evaluation matrix comparing the primary
framework guidance document to two of the 24 evaluation criteria ... 98 Table 21. Risk management framework applicability for surface waters in the
US, summarizing scores assigned to included framework guidance
documents and external utility interviews for 24 evaluation criteria ... 100 Table 22. Criteria for selection of paired comparison areas at locations 1, 3,
and 5 ... 134 Table 23. Detection limits for left- and right-censored data applicable to
monitoring equipment/test procedures used during the study period
and data cleaning procedures ... 135 Table 24. A comparison of median water quality values (based on manually
collected treated water samples) for each parameter across
intervention locations prior to WSP implementation ... 136 Table 25. All reported significant events occurring during the study period (prior
to, during, and after WSP implementation) at each intervention location ... 136 Table 26. Utility managers’ expectations of change at each location (“Should
the water quality parameter increase, decrease, or stay the same
following WSP implementation?”) ... 138 Table 27. Minimum, maximum, and mean water quality values before and after
WSP implementation, along with the number of samples,
direction/magnitude of change, variance ratio, and raw and adjusted p-value for regression model interaction term at location 1 intervention
and comparison (“comp”) sites ... 138 Table 28. Minimum, maximum, and mean water quality values before and after
WSP implementation, along with the number of samples,
direction/magnitude of change, variance ratio, and raw and adjusted p-value for regression model time parameter among location 2
intervention site production samples ... 140 Table 29. Minimum, maximum, and mean water quality values before and after
WSP implementation, along with the number of samples,
direction/magnitude of change, and raw and adjusted p-value for model interaction term at location 3 intervention and comparison
Table 30. Minimum, maximum, and mean water quality values before and after WSP implementation, along with the number of samples,
direction/magnitude of change, and raw and adjusted p-value for
model time parameter at the location 4 intervention site ... 142 Table 31. Minimum, maximum, and mean water quality values before and after
WSP implementation, along with the number of samples,
direction/magnitude of change, and raw and adjusted p-value for model interaction term at location 5 intervention and comparison
(“comp”) sites ... 142 Table 32. Detailed results of compliance analysis involving relevant internal
and external thresholds ... 144 Table 33. Ranked criteria out of 12 multiple-choice options based on four
participating utility responses to the baseline survey question, “How important are the following criteria to your utility when selecting a
source water protection and management program?” ... 159 Table 34. Ranked criteria based on qualitative coding of three participating
utility responses to the open-ended baseline survey question, “Which other criteria, if any, are important to your utility when selecting a
LIST OF FIGURES
Figure 1. Water Safety Plan evaluation framework proposed by Gelting et al.
(2012) ... 6 Figure 2. Conceptualization of relationship among four dissertation
components ... 8 Figure 3. Daily acute gastroenteritis incidence rates (cases/day) comprising all
exposure pathways at location 1 ... 49 Figure 4. Daily acute gastroenteritis incidence rates (cases/day) comprising all
exposure pathways at location 3 ... 49 Figure 5. Monthly acute gastroenteritis incidence rates (cases/month)
comprising all exposure pathways at location 5 ... 50 Figure 6. Trended nonlinear relationship between 6-8-day precipitation moving
average and acute gastroenteritis rate ratio at location 1, with 95%
confidence band (spline χ2=4.82, p=0.443) ... 54 Figure 7. Trended nonlinear relationship between the one-day lag of air
temperature and acute gastroenteritis rate ratio at location 3, with 95%
confidence band (spline χ2=10.83, p=0.013) ... 54 Figure 8. Trended nonlinear relationship between the 0-15 day moving average
of daily maximum turbidity in finished water and acute gastroenteritis rate ratio at location 3, with 95% confidence band (spline χ2=10.53,
p=0.015) ... 55 Figure 9. Record of low-chlorine alarms at all production facilities (objective
2.3) from the onset of the WSP implementation period, including a
linear trend line ... 77 Figure 10. Monthly customer complaints for water quality reasons recorded in
the full service area (objective 3.5) from the onset of WSP implementation in 2013 (2012 and prior values not consistently
recorded) ... 78 Figure 11. Monthly water-quality specific customer complaints for a single
facility recorded from the onset of WSP implementation in 2013,
including linear trend line ... 79 Figure 12. Comparison of the rate of real-time water quality monitoring sensor
availability (objective 3.4) reported each year before, during, and after
WSP implementation ... 80 Figure 13. Comparison of the rate of completion of public utility declarations
(objective 1.1) each year before, during, and after WSP
Figure 15. Summary of participant rankings of risk management framework applicability for surface waters in the US (highest ranking = 1; not
applicable = N/A) ... 102 Figure 16. Examples of supplementing steps of the WSP evaluation logic
model (Gelting et al., 2012) with implementation science concepts to
LIST OF ABBREVIATIONS
ADWG Australian Drinking Water Guidelines AWWA American Water Works Association
CDC Centers for Disease Control and Prevention CEC Contaminant of emerging concern
CFIR Consolidated Framework for Implementation Research
EU European Union
FTE Full-time equivalent GAC Granular activated carbon
HACCP Hazard Analysis and Critical Control Points ISO International Organization for Standardization IWA International Water Association
JMP WHO/UNICEF Joint Monitoring Programme for Water Supply, Sanitation and Hygiene QMRA Quantitative microbial risk assessment
SDG Sustainable Development Goal
STEM Science, technology, engineering, and mathematics THM Trihalomethane
UN United Nations
UNICEF United Nations Children's Fund
US EPA United States Environmental Protection Agency UV Ultraviolet light
CHAPTER 1: INTRODUCTION
Background
Water, sanitation and hygiene (WaSH) are important prerequisites for human health in terms of both physical and social wellbeing, leading to better access to education, poverty reduction, and socio-economic development (Mills & Cumming, 2016). Continued efforts to improve access to safe WaSH services can help to further reduce the global burden of disease (Troeger et al., 2017; Wolf et al., 2018) and ensure basic human rights are met (United Nations General Assembly Resolution 64/292, 28 July 2010). From 2015 to 2030, the United Nations’ Sustainable Development Goal (SDG) 6 seeks to “ensure availability and sustainable management of water and sanitation for all” (UN General Assembly, 2015). Unlike the previous Millennium Development Goal targets, SDG 6 directly applies to all people, including hard-to-reach populations, in all countries. It similarly establishes a higher expectation for the level of drinking water services as “safely managed,” which requires that the water is accessible on premises, available when needed, and free from contamination, according to the World Health Organization (WHO) and United Nations Children's Fund (UNICEF) Joint Monitoring Programme for Water Supply, Sanitation and Hygiene (JMP) (WHO, 2017). An estimated 29% of the global population lacks drinking water that meets these criteria (WHO & UNICEF, 2017). Through 2030 and beyond, governments, WaSH researchers, service providers, development workers, and others will dedicate substantial effort to ensuring equity, sustainability, and sufficient access to water and sanitation services.
Intervention
This research centers on evaluation of one WaSH intervention – risk management among drinking water suppliers – intended to reduce health risks from unexpected failures or contamination events. The early roots of health risk assessment for public water supplies included sanitary inspection in the early 20th century (Wolman, 1921). Prevention of hazards, rather than retrospective product testing, represents a paradigm shift with origins in preparation of military artillery shells during WWII and food products for astronauts in the 1960s. The concept had spread to food safety applications for public consumption (especially for meat and poultry) by 1994, when the International Hazard Analysis and Critical Control Points (HACCP) Alliance formed. Iceland was the first country to legislate application of HACCP concepts to public drinking water supplies in 1995 (Gunnarsdottir & Gissurarson, 2008). Following a decade-long global consultation process, the third edition of the World Health Organization (WHO) Guidelines for Drinking Water Quality recommended Water Safety Plans (WSPs) as a proactive risk management approach for all drinking water utilities in 2004 (Bartram et al., 2009; WHO, 2004). These programs have since been adopted in more than 90 countries, and legally required in many, including Australia and the United Kingdom (WHO & IWA, 2017). Risk management requires both identifying high-priority risks and implementing proactive steps to mitigate hazards. Program components (adapted from Bartram et al., 2009) may include:
1. Assemble a team.
2. Describe the water supply system.
3. Identify hazards and hazardous events and assess their corresponding risks (e.g., based on likelihood and consequences), considering existing control measures.
4. Prioritize the risks and develop new control measures for high-priority risks. 5. Define operational and compliance monitoring.
6. Identify and implement needed infrastructure improvements or upgrades. 7. Verify effectiveness of the risk management plan.
8. Prepare and document management procedures (e.g., standard operating procedures, emergency response plans).
10. Carry out review (e.g., audits) periodically and following incidents or near-misses. 11. Update and revise the risk management plan.
Multiple permutations and adaptations of risk management guidance have been developed, from governmental directives to third-party standards, at international, national, and subnational levels. While the WHO’s WSP guidance recommends managing risks from source to tap, some risk management programs address only subcomponents of the water system, such as source waters, water treatment facilities, and/or distribution systems. Local authority or circumstances (e.g., water transfers between utilities, property rights) may restrict the scope of programming or utility’s influence over risks. Alternatively, budget, expertise, or human resources capacity constraints may limit risk management programs. Flexibility in implementation approaches is often needed to adapt the intervention to a particular setting or context; however, excessive liberties could also lead to poor fidelity to the intervention, which may ultimately affect its outcomes and degree of social impact.
In WaSH applications, simple interventions promote use of a single desired behavior or technology, such as a point-of-use water filtration device, among a specific group of people. Although definition might depend on the lens of analysis (Craig et al., 2013; Petticrew, 2011), “complex”
interventions instead target multiple desired behaviors across multiple groups of people or levels of scale, such as vigilance toward diverse drinking water system hazards among utility employees, managers, and the wider community. Simple interventions are often narrowly specified and homogenous, while complex interventions such as WSPs have some degree of flexibility and heterogeneity, requiring users to balance fidelity to the original concept with adaptation to their particular context and setting (Allen, Shelton, Emmons, & Linnan, 2017; Bauman, Stein, & Ireys, 1991; Baumann, Cabassa, & Stirman, 2017). For example, the same basic steps to identify, prioritize, and manage risks may be followed, allowing case-by-case determination of the number and type of risks actively managed, or the degree of documentation required (e.g., depending on the size and complexity of the system).
and high-income countries (IWA, 2004; WHO, 2004). WSPs are not included in the JMP definition of “safely managed” drinking water used to measure progress toward SDG 6 (WHO, 2017), but their status has been assessed separately (WHO & IWA, 2017). Low-and middle-income countries potentially have the most to gain from improved drinking water safety; however, this topic may similarly suffer from low political priority in high-income countries where the health and economic burdens of disease are less evident (Bartsch, Lopman, Ozawa, Hall, & Lee, 2016). A heavily regulated and technical culture, along with an entrenched individual contaminant monitoring approach, may reinforce widely standardized and reactive management (Amjad, Luh, Baum, & Bartram, 2016; Baum, Bartram, & Hrudey, 2016; Gullick, 2014; Takala & Heino, 2017), forestalling investment in innovative or site-specific approaches. Public officials in high-income countries may not perceive drinking water as a prominent contributor to health risk, despite the preventable nature of waterborne disease, chronic lack of investment in aging infrastructure, and periodic high-profile incidents (Allaire, Wu, & Lall, 2018; Hupp Williamson, 2018; MacKenzie et al., 1994; Pieper, Tang, & Edwards, 2017; Thomasson et al., 2017). Recognition of the disparities within high-income countries is growing (Alston, 2018; Bain, Johnston, Mitis, Chatterley, & Slaymaker, 2018; Stillo & Macdonald Gibson, 2017). WSPs represent one option for improving standards of service in a manner adaptable to a variety of settings and resource levels (World Health Organization, 2012), which could drive more equitable services (Ross, Winterford, & Willetts, 2019).
Evaluation Frameworks
exploration, adoption/preparation, implementation, and sustainment (Brown et al., 2017). Some scholars argue that the boundaries between these distinct research traditions need not be strict, as this
excessively widens the science-to-service gap. Instead, research types can be executed concurrently or blended into hybrid study designs (Chambers & Norton, 2016; Curran, Bauer, Mittman, Pyne, & Stetler, 2012).
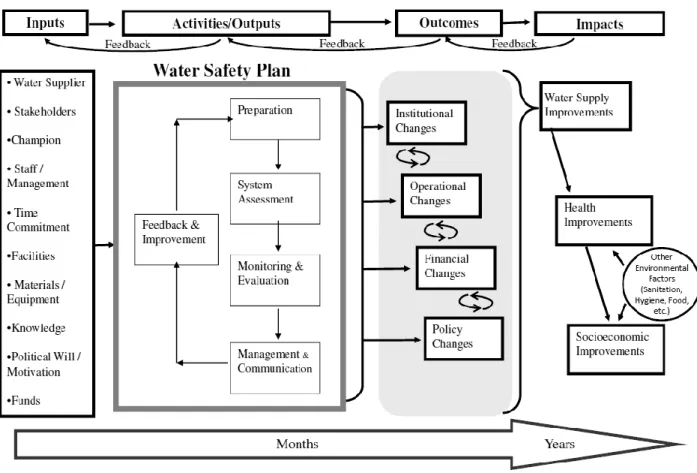
Developing capacity for evaluation research and WSP scale-up requires sustainable and comparable metrics suited for a complex intervention. As a starting point, the US Centers for Disease Control and Prevention (CDC) developed an evaluation framework for WSPs (Gelting, Delea, & Medlin, 2012), which follows a commonly used logic model, describing how WSP inputs and activities should theoretically lead to outcomes and impacts (Figure 1). Lockhart et al. (2014) further developed
Figure 1. Water Safety Plan evaluation framework proposed by Gelting et al. (2012)1
Building on efforts to evaluate WSP effectiveness, consideration of context and implementation processes is recommended when scaling up potentially effective but complex public health interventions into common practice (C. R. May, Johnson, & Finch, 2016; Pfadenhauer et al., 2017). Improved
understanding of the interplay among inputs, setting, context, and expected outcomes would contribute to the current state of knowledge about WSPs and aid future scale-up efforts. A number of frameworks from the field of implementation science draw attention to how variations in implementation can affect
intervention outcomes (Bauer, Damschroder, Hagedorn, Smith, & Kilbourne, 2015; Hering, 2018). These factors or “constructs” fall into domains including the intervention characteristics, inner (local or
organizational) setting, outer (broader regional, national, or global) setting, characteristics of individuals involved, and the implementation process (Damschroder et al., 2009).
Research Questions and Dissertation Structure
This body of research focuses on drinking water risk management interventions in high-income countries. Ultimately, the dissertation aims to inform scale-up and transfer of this complex WaSH
intervention into new settings and contexts. Setting is defined as the physical location, while context more broadly encompasses geography, culture, economy, ethics, and politics (Pfadenhauer et al., 2017). It addresses multiple stages of the translational research pipeline, from effectiveness to implementation research. The overarching dissertation research questions are:
Do setting, context, and implementation approaches affect the outcomes of drinking water safety programs in high-income countries?
How might drinking water safety programs be scaled up or spread in high-income countries? Within the broader global goal of scaling up programming for drinking water safety, this work consists of four distinct research studies focusing on WSP application in high-income countries (Figure 2). It builds on early WSP pilot studies in Iceland, which first demonstrated beneficial water quality and health outcomes, on the order of a 14% reduction in diarrheal disease (Gunnarsdottir, Gardarsson, Elliott, et al., 2012). The first two studies evaluate the effectiveness of the WSP intervention as implementation spread into France and Spain, focusing on investigating links to water quality and health impacts on the far right of the evaluation framework (Figure 1). The third study matches information about implementation strategies and experiences (activities/outputs) with indicators of operational performance (found in the middle of the evaluation framework). The fourth synthesizes knowledge about the potential for WSP implementation (inputs in Figure 1) in less established settings, such as the United States and Canada. The individual research study approaches were:
1. A retrospective observational study of the water quality, compliance, and health outcomes of WSPs at five European locations;
2. A retrospective observational time series studies of how weather and water supply dynamics related to health outcomes (at a nested sample of WSP locations in France and Spain); 3. A mixed methods study linking implementation approaches with indicators of operational
4. A comparative evaluation involving systematic review of risk management frameworks, and ranking their applicability for managing source water risks in the United States.
Figure 2. Conceptualization of relationship among four dissertation components
The first research component examines the big-picture water quality, compliance, and health impacts of WSPs using an epidemiological study design. Statistical models measured changes at representative water utilities in two high-income countries, seeking to determine whether outcomes were consistent across locations and how this new evidence might influence future WSP implementation. The second research component involved secondary analysis of the same health data with supplementary weather and water supply data at a nested sample of locations from the first study. To confirm potential mechanisms for WSPs to affect health outcomes, generalized additive models investigated whether observed changes in disease rates were associated with specific drinking water exposures on a daily or monthly timescale. The third research component applied mixed methods to examine how qualitative descriptions of WSP implementation practices related to quantitative measures of operational performance outcomes at one nested study location. The fourth component entailed comparative
CHAPTER 2: WATER QUALITY, COMPLIANCE, AND HEALTH OUTCOMES AMONG UTILITIES IMPLEMENTING WATER SAFETY PLANS IN FRANCE AND SPAIN2
Introduction
In 2004, the World Health Organization Guidelines for Drinking Water Quality recommended that water suppliers develop and implement Water Safety Plans (WSPs) to help proactively maintain safe public drinking water supplies and reduce health impacts from water contamination events (Bartram et al., 2009). WSPs are now used in many world regions and required by national legislation in some countries. They were introduced into the European Union Drinking Water Directive in 2015 (Commission Directive (EU) 2015/1787) and may be required as early as 2018. In contrast to reactive approaches to water quality surveillance and management, water purveyors who use WSPs seek to comprehensively prevent problems from occurring. This management (“software”) intervention involves a continuous feedback loop of risk identification, implementation of controls, and evaluation of whether risks are under control, stemming from the hazard analysis and critical control point (HACCP) approach used widely to ensure food safety. WSPs may or may not involve concurrent infrastructure (“hardware”) upgrades or changes, depending on which risks are identified and prioritized for each system. The W SP team, once formed, conducts a thorough analysis of all potential risks to the drinking water supply from source to tap, prioritizes these risks, and establishes critical control points where ongoing monitoring should take place (Bartram et al., 2009).
2This chapter previously appeared as an article in the International Journal of Hygiene and Environmental
Health. The original citation is as follows:
Setty, K.E., Kayser, G.L., Bowling, M., Enault, J., Loret, J.F., Serra, C.P., Alonso, J.M., Mateu, A.P., & Bartram, J. (2017). Water quality, compliance, and health outcomes among utilities implementing Water Safety Plans in France and Spain. International Journal of Hygiene and Environmental Health, 220, 513–
530. doi: 10.1016/j.ijheh.2017.02.004
More recently, evaluation frameworks and indicators have been proposed to measure progress toward WSP goals and evaluate gains. Numerous indicators can relay the effectiveness of WSPs, broadly spanning inputs (e.g., funding and time commitment), activities/outputs (e.g., number of team meetings), outcomes (e.g., operational efficiency or cost savings), and impacts (e.g., water quality or health
improvements) (Gelting et al., 2012). Changes related to the WSP process can take place across all categories, although the former categories may show earlier and more measurable change when compared to more distal outcomes and impacts. Lockhart et al. (2014) recommend evaluating specific indicators within four categories: institutional, operational, financial, and policy outcomes. A review of WSP evaluations to date (Kot et al., 2015) found primary reported benefits of the WSP approach to include improvements in organizational structure or daily procedures, better risk awareness among water operators, more efficient water management practices, improved compliance with water regulations, and a reduction in customer complaints. Another systematic review suggested financial outcomes of WSPs have the clearest evidence base, even though operational outcomes are more frequently documented (String & Lantagne, 2016). The review concludes that outcome and impact evaluation data demonstrating WSP value remain weak.
Although a central goal of WSPs is to reduce the risk of water contamination events, limited evaluation data are available to demonstrate WSP effectiveness at decreasing drinking water pathogen or chemical exposures, as well as corresponding health improvements.3 The impact of WSPs on human health has been investigated in Iceland, one of the first countries to legislate their use in 1995. Data collected before and after WSPs were introduced showed measurably less contaminated water, significantly fewer cases of diarrhea, and improved compliance with drinking water standards
(Gunnarsdottir, Gardarsson, Elliott, et al., 2012). Iceland is a unique developed country with a high quality groundwater supply, where chlorination is not used to disinfect drinking water supplies. We sought to repeat this type of investigation at five locations in France and Spain, with a focus on generalizing outcomes across large population centers in developed nations served by chlorinated surface water and
surface-influenced groundwater supplies. These regions have relatively low burdens of diarrheal disease compared to developing nations (WHO, 2010); still, the population experiences a costly annual health burden from viral gastroenteritis (especially norovirus) transmission, some of which stems from water-related outbreaks (Beaudeau et al., 2008; Flahault & Hanslik, 2010; Kowalzik, Riera-Montes, Verstraeten, & Zepp, 2015; Lopman et al., 2003). Surface drinking water sources in France and Spain are affected by diverse human and animal fecal influences, such as overland runoff and cross-contamination from wastewater pipes (Therre, de Valk, Vaillant, Beaudeau, & Mouly, 2008). Cryptosporidiosis and giardiasis remain a concern for drinking water managers, especially in spring and autumn periods of heavy rainfall.
The primary goals of this study were to characterize changes in water quality, compliance, and gastrointestinal disease incidence following WSP implementation. We aimed to demonstrate the impacts of WSPs, as well as to note the presence of factors that might be used to improve WSP implementation and performance in the future. A secondary goal was to evaluate the outcomes of full versus partial WSPs, where the scope is limited to only the production or distribution system. This project followed an earlier phase of research into WSP inputs and outcomes within the Suez network of utilities. Suez is a large multinational company based in France, named for their involvement in building the Suez Canal. A 2014 study, which quantified costs and ranked perceived benefits of WSPs by surveying utility managers, helped to narrow the goals and possible study locations for this project (Loret et al., 2016). It led to a ranking of reported WSP benefit categories among 21 drinking water utility managers as well as an average WSP labor investment estimate of 10.5 person-months (full-time equivalent) for implementation and four person-months/year for ongoing WSP maintenance.
Methods
Site Selection
of 15 drinking water treatment plants and groundwater treatment facilities (Table 1). Inclusion criteria specified either surface water or influenced groundwater sources, WSP implementation in the production and/or distribution system, and water quality data available for at least two years before and after WSP implementation. Each system had obtained ISO 22000 food safety management certification at the end of the WSP implementation period, one of several existing WSP models (ISO, 2005). At locations 1, 2, and 4, only the production system was certified (the drinking water treatment plants and/or groundwater treatment facilities). Location 5 included two intervention areas: a “full WSP” where the production and distribution systems were certified and a “partial WSP” certifying only the distribution system. In the partial WSP area, water from another purveyor’s drinking water treatment plant is delivered to the local service area via a main pipe. Most locations provided both production and distribution network water quality monitoring data; location 2 was limited to production samples only and the partial WSP area of location 5 was limited to distribution samples only.
Table 1. Characteristics of each study location, including the number of matched municipalities included in health effects analysis for locations 1, 3, and 5
Location (and nature of WSP intervention)
Population Served (rounded to nearest thousand)
Municipalities Served (and percent exposure to water supply)
Water Source Treatment Scheme1
1 645,000
Intervention (production only)
43,000 1 (100%) Surface water Coagulation/sedimentation, rapid sand filtration, ozonation, GAC filtration, utrafiltration, pH stabilization, chlorination Comparison
(no WSP)
602,000 10 (60%) Surface water Coagulation/sedimentation, rapid sand filtration, ozonation, GAC filtration, chlorination
2 1,000,000
Intervention (production only)
Surface water Coagulation/sedimentation, GAC filtration, ozonation, GAC filtration, UV, chlorination
Surface water Coagulation/sedimentation, GAC filtration, ozonation, ultrafiltration and chlorination
Surface water Coagulation/sedimentation, GAC filtration, ozonation, GAC filtration, UV, chlorination
Groundwater GAC filtration, chlorination
3 77,000
Intervention (production/ distribution)
43,000 4 (2 at 60%, 2 at 20-30%)
Influenced groundwater
Direct GAC filtration, UV, chlorination
Comparison (no WSP)
24,000 1 (100%) Protected groundwater
Iron removal, chlorination
4 73,000
Intervention (production only)
Surface water Coagulation/sedimentation, rapid sand filtration, ozonation,
chlorination Groundwater
(summer only)
Iron removal, filtration, and chlorination
Groundwater (summer only)
Chlorination
5 325,000
Intervention (production/ distribution)
148,000 2 (100%) Surface and groundwater
Pre-oxidation (ClO2),
coagulation/sedimentation, rapid sand filtration, (50% to line 1)
ozonation/GAC filtration, (50% to line 2) ultrafiltration/reverse osmosis, chlorination
Intervention (distribution only)
117,000 4 (100%) Surface water Pre-oxidation (Cl2 + ClO2), coagulation/sedimentation, GAC filtration, chlorination
Comparison (no WSP)
60,000 1 (100%) 1GAC=granular activated carbon
considered the minimum coverage percentage, so the main health results (Table 5Table 6) exclude the two municipalities with less than 30% exposure to the drinking water intervention, although they were considered for sensitivity analysis.
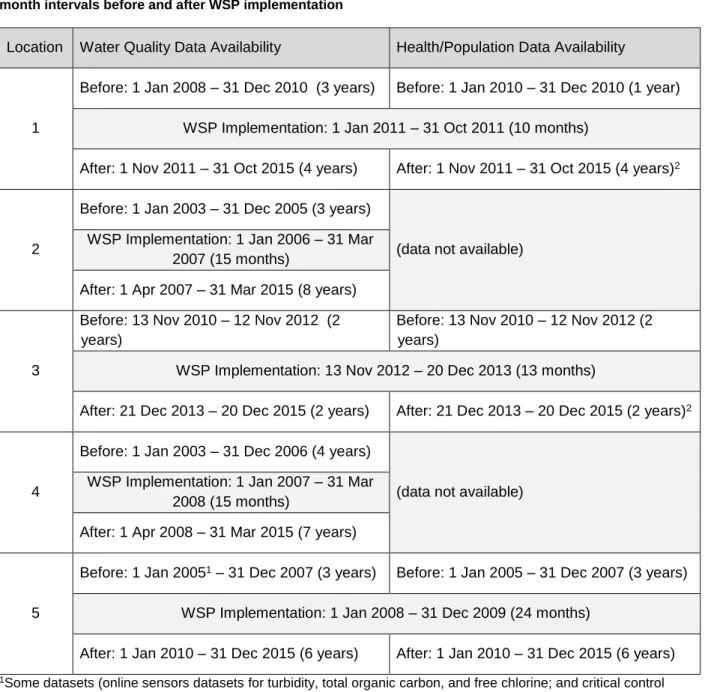
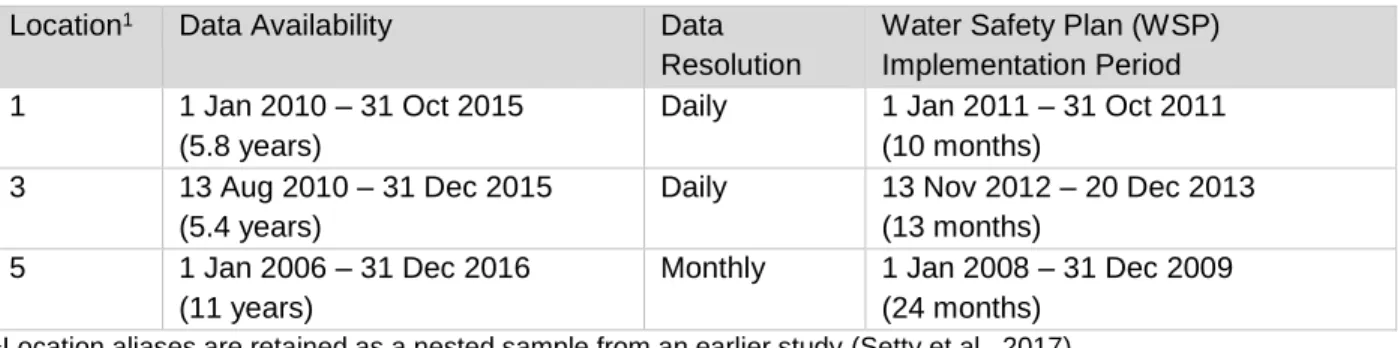
Table 2. Time periods of water quality and health/population data availability at each location, trimmed to 12-month intervals before and after WSP implementation
Location Water Quality Data Availability Health/Population Data Availability
1
Before: 1 Jan 2008 – 31 Dec 2010 (3 years) Before: 1 Jan 2010 – 31 Dec 2010 (1 year) WSP Implementation: 1 Jan 2011 – 31 Oct 2011 (10 months)
After: 1 Nov 2011 – 31 Oct 2015 (4 years) After: 1 Nov 2011 – 31 Oct 2015 (4 years)2
2
Before: 1 Jan 2003 – 31 Dec 2005 (3 years)
(data not available) WSP Implementation: 1 Jan 2006 – 31 Mar
2007 (15 months)
After: 1 Apr 2007 – 31 Mar 2015 (8 years)
3
Before: 13 Nov 2010 – 12 Nov 2012 (2 years)
Before: 13 Nov 2010 – 12 Nov 2012 (2 years)
WSP Implementation: 13 Nov 2012 – 20 Dec 2013 (13 months)
After: 21 Dec 2013 – 20 Dec 2015 (2 years) After: 21 Dec 2013 – 20 Dec 2015 (2 years)2
4
Before: 1 Jan 2003 – 31 Dec 2006 (4 years)
(data not available) WSP Implementation: 1 Jan 2007 – 31 Mar
2008 (15 months)
After: 1 Apr 2008 – 31 Mar 2015 (7 years)
5
Before: 1 Jan 20051 – 31 Dec 2007 (3 years) Before: 1 Jan 2005 – 31 Dec 2007 (3 years) WSP Implementation: 1 Jan 2008 – 31 Dec 2009 (24 months)
After: 1 Jan 2010 – 31 Dec 2015 (6 years) After: 1 Jan 2010 – 31 Dec 2015 (6 years) 1Some datasets (online sensors datasets for turbidity, total organic carbon, and free chlorine; and critical control
parameters used for compliance analysis including trichloroethylene/tetrachloroethylene, nickel, chromium VI, and iodine absorption) begin 1 Jan 2006 for a total of two years in the before period.
2For locations 1 and 3, extrapolated population data was used during the after period to enable comparison with case numbers for 2014 and 2015.
Water Quality Analysis
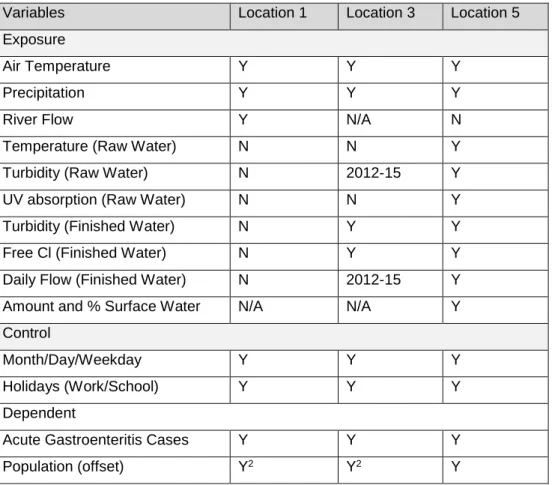
pooled while data sets from online sensors were considered separately where available (locations 3 and 5). We selected twelve water quality parameters to evaluate water quality, treatment process
effectiveness, and possible human health risk, including E. coli, fecal streptococci, total coliform,
heterotrophic plate count, trihalomethanes (THMs), bromate, free residual chlorine, total residual chlorine, aluminum, total organic carbon, turbidity, and pH. Data cleaning involved attribution of the study location, time period (before, during, or after the intervention), and presence or absence of a WSP intervention, comprising about 240,500 manual samples and more than 1.24 million online sensor readings for a total of nearly 1.5 million water quality data points.
Detection limits for the equipment and/or test method used in water quality data collection are listed in Table 23. Left-censored data with detection limits of one or lower were set to zero (to match pre-processing of the French data), while left-censored data with detection limits above one were set to half the detection limit. Right-censored data were set to the detection limit. For microbial water quality parameters that were not quantified, absence was set to zero and presence was set to one. Data points that were blank or otherwise could not be resolved were left as missing data. In some cases, water quality data represented water that did not reach the consumer, (e.g., an alarm or scheduled maintenance event might trigger containment and disposal of a water batch and/or emergency cross-connection with
alternate water supplies), but it was nevertheless included as an event relevant to the WSP and
performance history. Precise historical records of maintenance, pipe flushing, spiking, equipment failure and other events/activities that potentially affected individual samples were not available; therefore, suspected outliers remained in the dataset.
All statistical analyses were performed using SAS 9.4 software. For chemical parameters, multiple regression was applied to detect significant differences between the pre-intervention (“before”) and post-intervention (“after”) time periods. The model controlled for a clustered sampling design
with a corresponding Poisson regression model (based on the natural log of the dependent variable, value), owing to the non-continuous count nature of the data.
For the locations with comparison areas, beta coefficients are reported for the interaction term consisting of time period (before/after) and WSP presence (no/yes) (equation 1). For locations 2 and 4, the beta value represents the effect of time period alone (equation 2). For location 5, two sets of dummy and interaction variables were used to represent the full (production and distribution) WSP versus the partial (distribution only) WSP intervention (equation 3). To determine significance, a p-value correction was applied within each location’s family of water quality statistical tests using the adaptive Holm procedure. Sensitivity testing examined the effect of suspicious extreme values in the data set that may have been affected by maintenance or other events, even though imperfect historical records were available to justify data removal. Finally, variance ratios were computed between the pre- and post-intervention period as another indicator of water quality control.
Value or ln(Value) = β0 + β1*Time + β2*Proximity + β3*Site + β4*Time*Site (eq. 1)
Value or ln(Value) = β0 + β1*Time + β2*Proximity (eq. 2)
Value or ln(Value) = β0 + β1*Time + β2*Proximity + β3*Full Site + β4*Partial Site (eq. 3) + β5*Time*Full Site + β6*Time*Partial Site
Compliance Analysis
The compliance analysis compared water quality data before and after WSP implementation to relevant thresholds, including: European Union (EU) Drinking Water Directive quality limits and quality references, national quality limits and quality references, Suez internal recommended practices (for France), location-specific WSP critical limits, and location-specific WSP operational limits. National quality limits and references for France and Spain often closely matched the EU Drinking Water Directive
We evaluated compliance for the same set of 12 parameters used for water quality modeling, as well as any additional parameters relevant to critical control points (at location 5 only). Between 9 and 22 relevant thresholds existed and were investigated at each location. A 2x2 table was constructed using the number of passes and fails in each time period. Significant differences in cell sizes were then evaluated using either a chi-squared or Fisher’s exact test for unequal proportions (Fisher’s exact test was used when any cell size was five or less). A p-value correction was again applied within each location’s family of compliance statistical tests using the adaptive Holm procedure. Data analysis definitions of
“compliance” were matched as closely as possible to the utility managers actual use of the data (e.g., reporting of manual monitoring data to regulatory bodies and use of real-time online sensor data for internally maintained critical control points), but needed to be simplified in some cases to permit analysis of incomplete historical data records. These analyses are denoted as “simplified” in tables 4 and 31. For example, if the time resolution of historic sampling was twice daily, the data could not be analyzed for hourly changes. Therefore, analysis results may differ from the utilities’ self-reported compliance records, since more complex verifications involving time persistence, equipment substitution, and repeat sampling apply to some thresholds in practice.
Health Analysis
released after a two-and-a-half-year time lag, population estimates needed to be extrapolated for the years 2014-2015 to enhance or enable comparison with cases reported at locations 1 and 3, respectively. Extrapolations were based on linear estimates of growth for each municipality using 2010-2013 data.
Because the number of years in each time period varied, acute gastroenteritis was characterized as a rate: the incidence (number of new cases) per 1,000 person-years. Population data could further be matched to existing age divisions in the health data to stratify the analysis by ages under 5, 5-14, 15-64, and over 65 years at locations 1 and 3, and by ages 0-14 and over 15 at location 5. To statistically compare acute gastroenteritis incidence before and after WSP implementation, a Poisson regression model was applied with population as the offset (person-years) and controlling for the comparison area conditions (the base level of the site variable; equation 4). Comparison area values were included to isolate the effect of the drinking water intervention, as opposed to data reporting, overall health, or other changes that may have affected the whole region. The location 5 model separated the full WSP
(production and distribution) and partial WSP (distribution only) intervention areas (equation 5). Cases reported by municipality were pooled within each area and clustering was not considered in the model. Finally, sensitivity of the model was tested relative to assumptions of population extrapolation and service area coverage.
ln(Cases/Person-Year) = β0 + β1*Time + β2*Site + β3*Time*Site (eq. 4) ln(Cases/Person-Year) = β0 + β1*Time + β2*Full Site + β3*Partial Site (eq. 5)
+ β4*Time*Full Site + β5*Time*Partial Site
Informal Audits
however, information was specifically requested on significant events that took place during the study period, and expectations of change in water quality or health data as a result of the WSP (reported in Table 25Table 26, respectively). Shorter questionnaires adapted for electronic rather than in-person delivery were then developed and completed by a member of the Suez research team for locations 2 and 4 in August 2016.
Results
Water Quality
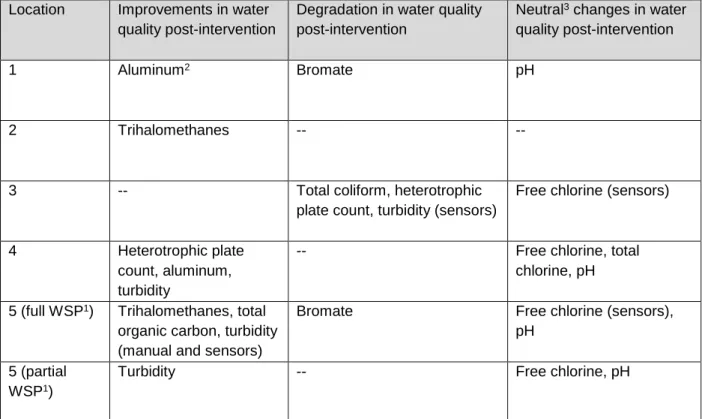
Table 3. Summary of statistically significant water quality outcomes reported in Table 27Table 31, grouped by improvement, degradation, and neutral changes
Location Improvements in water quality post-intervention
Degradation in water quality post-intervention
Neutral3 changes in water quality post-intervention
1 Aluminum2 Bromate pH
2 Trihalomethanes -- --
3 -- Total coliform, heterotrophic
plate count, turbidity (sensors)
Free chlorine (sensors)
4 Heterotrophic plate
count, aluminum, turbidity
-- Free chlorine, total
chlorine, pH 5 (full WSP1) Trihalomethanes, total
organic carbon, turbidity (manual and sensors)
Bromate Free chlorine (sensors),
pH 5 (partial
WSP1)
Turbidity -- Free chlorine, pH
1The full WSP applied to both the production and distribution system; the partial WSP applied to the distribution system only.
2Remained constant relative to comparison area.
3“Neutral” changes may or may not be considered desirable depending on the individual needs of the drinking water utility.
The water quality parameters that changed significantly varied from one location to the next, and few patterns were observed (Table 3). Several microbial water quality parameters demonstrated little variation from zero and models could not be fit (Table 27Table 31). Heterotrophic plate count and total coliform worsened at location 3, while heterotrophic plate count improved at location 4. Likewise, turbidity increased at location 3, but decreased at locations 4 and 5 (full and partial WSPs). Bromate (a byproduct of using ozonation to treat water) increased at locations 1 and 5 while trihalomethanes (a byproduct of chlorination) decreased at locations 2 and 5 (full WSP). In the neutral category, free residual chlorine increased at locations 3 and 4 while it decreased at location 5 (full and partial WSPs), although free chlorine levels at location 5 were intentionally kept higher than locations 3 and 4 due to a difference in local regulatory standards (see typical median values in Table 24).
sample means were observed with descriptive statistics but not found to be statistically significant, possibly due to relatively low power or low numbers of non-zero data points. Examples included a decrease in heterotrophic plate counts, turbidity, and trihalomethanes at location 1 and a decrease in heterotrophic plate count and aluminum at location 5 (full WSP) (detailed in tables 26 and 30). As another indicator of water quality control, the WSP intervention sometimes resulted in changes in the distribution of data around the mean, reported as the variance and variance ratio (F-value) in tables 26 through 30. Both increases and reductions in variance were observed; variance declined notably (with a variance ratio equal to or exceeding 4:1) for turbidity at location 1, heterotrophic plate count at locations 4 and 5 (full WSP), and trihalomethanes at location 5 (full WSP).
With regards to sensitivity testing, exclusion of extreme values did not alter significance of the statistical test for free chlorine or turbidity at location 2, free chlorine and free chlorine sensors at location 3, total chlorine at location 4, or free chlorine and turbidity sensors at location 5. Testing did indicate a potential reduction in free and total chlorine levels (neutral management outcomes) at location 1.
Exclusion of four extreme values for total chlorine at the location 1 intervention area showed a statistically significant reduction where it was not found to change originally (β=-0.044, raw p-value<0.001). Likewise, dropping two extreme values for free chlorine at the location 1 comparison area improved the model fit and made the reduction statistically significant (β=-0.047, raw p-value<0.001). Additional sensitivity testing at locations 2 and 4 examined the effects of seasonality, since several months of additional partial-year data was available in the after period. It showed no changes in the significance of test results when this data was included.
Compliance
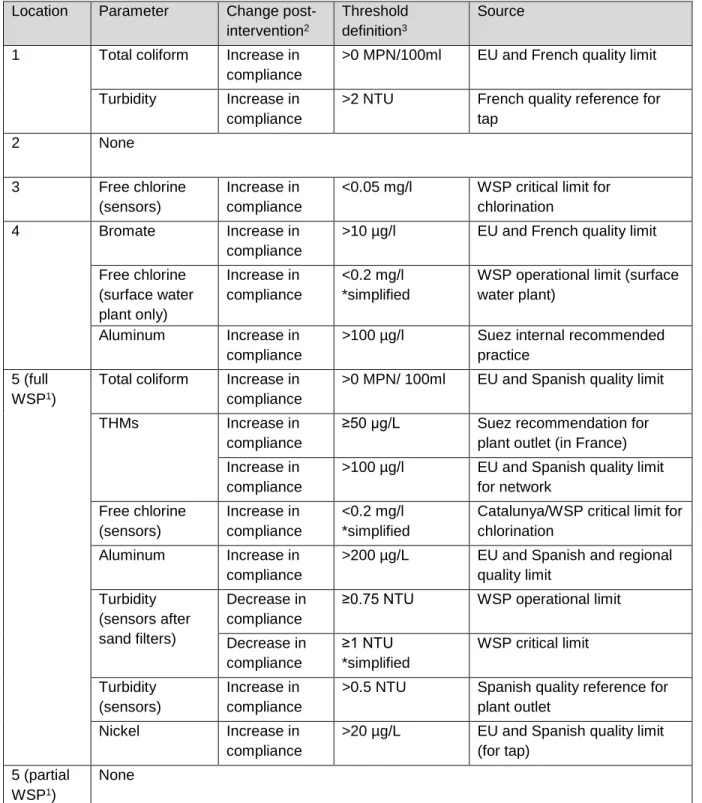
Table 4. Summary of statistically significant changes in compliance after WSP implementation at each intervention location.
Location Parameter Change post-intervention2
Threshold definition3
Source
1 Total coliform Increase in compliance
>0 MPN/100ml EU and French quality limit
Turbidity Increase in compliance
>2 NTU French quality reference for tap
2 None
3 Free chlorine
(sensors)
Increase in compliance
<0.05 mg/l WSP critical limit for chlorination
4 Bromate Increase in
compliance
>10 µg/l EU and French quality limit
Free chlorine (surface water plant only) Increase in compliance <0.2 mg/l *simplified
WSP operational limit (surface water plant)
Aluminum Increase in compliance
>100 µg/l Suez internal recommended practice
5 (full WSP1)
Total coliform Increase in compliance
>0 MPN/ 100ml EU and Spanish quality limit
THMs Increase in
compliance
≥50 µg/L Suez recommendation for plant outlet (in France) Increase in
compliance
>100 µg/l EU and Spanish quality limit for network Free chlorine (sensors) Increase in compliance <0.2 mg/l *simplified
Catalunya/WSP critical limit for chlorination
Aluminum Increase in compliance
>200 µg/L EU and Spanish and regional quality limit Turbidity (sensors after sand filters) Decrease in compliance
≥0.75 NTU WSP operational limit
Decrease in compliance
≥1 NTU *simplified
WSP critical limit
Turbidity (sensors)
Increase in compliance
>0.5 NTU Spanish quality reference for plant outlet
Nickel Increase in
compliance
>20 µg/L EU and Spanish quality limit (for tap)
5 (partial WSP1)
None
1The full WSP applied to both the production and distribution system; the partial WSP applied to the distribution system only.
2 Detailed noncompliance rates and other test results can be found in Table 32.
Health
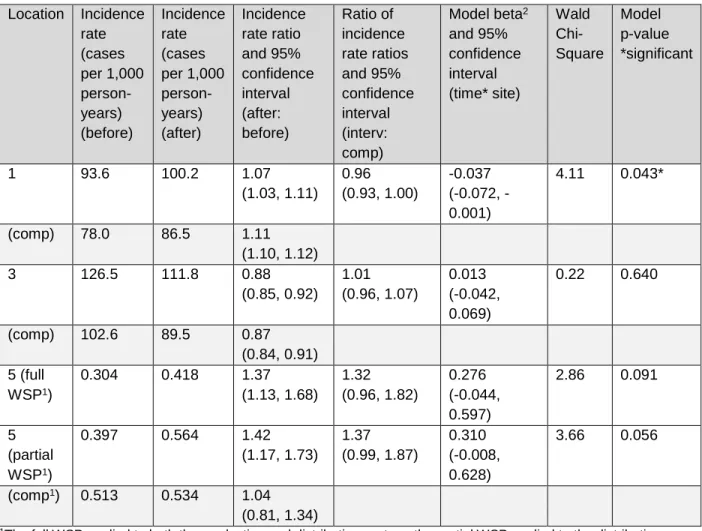
Table 5. Incidence of acute gastroenteritis before and after WSP implementation at both intervention and comparison (“comp”) areas and model interaction term between time and site
Location Incidence rate (cases per 1,000 person-years) (before) Incidence rate (cases per 1,000 person-years) (after) Incidence rate ratio and 95% confidence interval (after: before) Ratio of incidence rate ratios and 95% confidence interval (interv: comp)
Model beta2 and 95% confidence interval (time* site) Wald Chi-Square Model p-value *significant
1 93.6 100.2 1.07
(1.03, 1.11) 0.96 (0.93, 1.00) -0.037 (0.072, -0.001)
4.11 0.043*
(comp) 78.0 86.5 1.11
(1.10, 1.12)
3 126.5 111.8 0.88
(0.85, 0.92) 1.01 (0.96, 1.07) 0.013 (-0.042, 0.069)
0.22 0.640
(comp) 102.6 89.5 0.87 (0.84, 0.91) 5 (full
WSP1)
0.304 0.418 1.37 (1.13, 1.68) 1.32 (0.96, 1.82) 0.276 (-0.044, 0.597)
2.86 0.091
5 (partial WSP1)
0.397 0.564 1.42
(1.17, 1.73) 1.37 (0.99, 1.87) 0.310 (-0.008, 0.628)
3.66 0.056
(comp1) 0.513 0.534 1.04 (0.81, 1.34)
1The full WSP applied to both the production and distribution system, the partial WSP applied to the distribution system only, and the comparison area had no WSP. All areas of location 5 have much lower case numbers due to the differences in public health surveillance methods between France and Spain.
2Negative beta values correspond to a reduction in acute gastroenteritis in the intervention area.
be expected to exhibit greater changes in health outcomes, but this held true only for the 65+ age group. It should be noted that for French data (locations 1 and 3), the reported case numbers of acute
gastroenteritis (numerators of the rates) in the under 5 age group exclude infants (under age 1), because they are not expected to consume tap water. The population data (denominators of the rates) does include infants, serving to artificially reduce incidence rates for this age group at locations 1 and 3 across both intervention and comparison areas.
Table 6. Incidence of acute gastroenteritis by age group at location 1, 3, and 5 intervention and comparison (“comp”) areas
Location Age group Incidence rate (cases per 1,000 person-years) (before) Incidence rate (cases per 1,000 person-years) (after) Incidence rate ratio and 95% confidence interval (after: before)
Ratio of incidence rate ratios and 95% confidence interval (interv: comp)
Model beta3 and 95% confidence interval (time* site) Wald Chi-Square Model p-value *signif.
1 1-4/
0-42
236.9 301.2 1.27
(1.18, 1.37)
1.02 (0.94, 1.10)
0.017
(-0.057, 0.091)
0.21 0.644
(comp) 235.5 294.3 1.25
(1.22, 1.28)
1 5-14 168.5 174.9 1.04
(0.97, 1.11)
0.95 (0.88, 1.02)
-0.051 (-0.123, 0.020)
1.97 0.160
(comp) 141.1 154.2 1.09
(1.07, 1.12)
1 15-64 70.8 70.8 1.00
(0.95, 1.05)
0.94 (0.89, 0.99)
-0.062
(-0.112, -0.011)
5.78 0.016*
(comp) 57.1 60.7 1.06
(1.05, 1.08)
1 65+ 24.9 26.4 1.06
(0.87, 1.29)
0.90 (0.73, 1.10)
-0.109 (-0.313, 0.095)
1.09 0.296
(comp) 21.5 25.4 1.18
(1.12, 1.25)
3 1-4/
0-42
398.4 353.7 0.89
(0.81, 0.97)
0.96 (0.84, 1.09)
-0.043 (-0.169, 0.083)
0.45 0.505
(comp) 388.2 359.7 0.93
(0.85, 1.01)
3 5-14 238.8 198.1 0.90
(0.83, 0.97)
1.03 (0.92, 1.16)
0.032
(-0.083, 0.148)
0.30 0.583
(comp) 198.1 172.6 0.87
(0.80, 0.95)
3 15-64 97.3 84.7 0.87
(0.83, 0.92)
1.03 (0.95, 1.12)
0.032
(-0.047, 0.110)
0.63 0.429
(comp) 79.7 67.2 0.84
(0.79, 0.89)
3 65+ 55.4 55.0 0.99
(0.86, 1.15)
1.12 (0.91, 1.37)
0.109
(-0.094, 0.313)
1.11 0.293
(comp) 43.8 39.1 0.89
5 (full WSP1)
0-14 1.025 1.128 1.10
(0.83, 1.46)
0.96 (0.55, 1.69)
-0.039 (-0.602, 0.523)
0.02 0.891
5 (partial WSP1)
1.535 1.734 1.13
(0.87, 1.47)
0.99 (0.57, 1.71)
-0.014 (-0.565, 0.537)
0.00 0.961
(comp1) 0.871 0.997 1.14
(0.70, 1.86) 5 (full
WSP1)
15+ 0.174 0.276 1.58
(1.19, 2.10)
1.59 (1.06, 2.38)
0.462 (0.055, 0.869)
4.95 0.026*
5 (partial WSP1)
0.192 0.335 1.74
(1.29, 2.35)
1.74 (1.15, 2.65)
0.557 (0.138, 0.975)
6.80 0.009*
(comp1) 0.449 0.448 1.00
(0.75, 1.34)
1The full WSP applied to both the production and distribution system, the partial WSP applied to the distribution system only, and the comparison area had no WSP. All areas of location 5 have much lower case numbers due to the differences in public health surveillance methods between France and Spain.
2For French data (locations 1 and 3), the number of acute gastroenteritis cases exclude infants under age one, because they are not expected to be exposed to tap water consumption. The population data includes infants. 3Negative beta values correspond to a reduction in acute gastroenteritis in the intervention area.
Regarding sensitivity analyses, exclusion of extrapolated 2014–2015 population data from the location 1 analysis did not substantially affect the outcome. Assessing only data reported through 2013 resulted in a similar approximately 5% reduction in acute gastroenteritis incidence at the intervention area relative to the comparison area (β=-0.055, p=0.005). Further, where health data and water supply
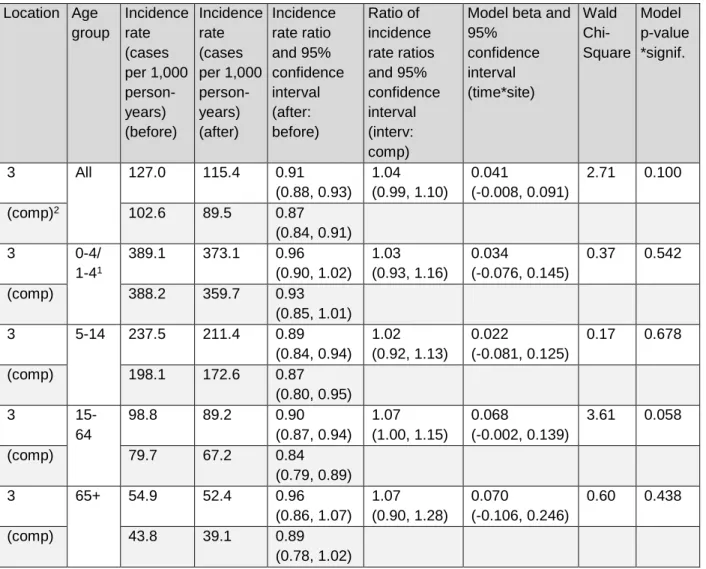
Table 7. Sensitivity test of acute gastroenteritis outcomes in the overall population and by age group at location 3 intervention and comparison (“comp”) areas, adding health data from two municipalities with less than 30% water coverage to the intervention area
Location Age group Incidence rate (cases per 1,000 person-years) (before) Incidence rate (cases per 1,000 person-years) (after) Incidence rate ratio and 95% confidence interval (after: before) Ratio of incidence rate ratios and 95% confidence interval (interv: comp)
Model beta and 95% confidence interval (time*site) Wald Chi-Square Model p-value *signif.
3 All 127.0 115.4 0.91
(0.88, 0.93) 1.04 (0.99, 1.10)
0.041
(-0.008, 0.091)
2.71 0.100
(comp)2 102.6 89.5 0.87
(0.84, 0.91)
3 0-4/
1-41
389.1 373.1 0.96 (0.90, 1.02)
1.03 (0.93, 1.16)
0.034
(-0.076, 0.145)
0.37 0.542
(comp) 388.2 359.7 0.93
(0.85, 1.01)
3 5-14 237.5 211.4 0.89
(0.84, 0.94) 1.02 (0.92, 1.13)
0.022
(-0.081, 0.125)
0.17 0.678
(comp) 198.1 172.6 0.87
(0.80, 0.95)
3
15-64
98.8 89.2 0.90
(0.87, 0.94) 1.07 (1.00, 1.15)
0.068
(-0.002, 0.139)
3.61 0.058
(comp) 79.7 67.2 0.84
(0.79, 0.89)
3 65+ 54.9 52.4 0.96
(0.86, 1.07) 1.07 (0.90, 1.28)
0.070
(-0.106, 0.246)
0.60 0.438
(comp) 43.8 39.1 0.89
(0.78, 1.02)
1For French data (locations 1 and 3), the number of acute gastroenteritis cases exclude infants under age 1, because they are not expected to be exposed to tap water consumption. The population data includes infants.
2Comparison area values remain unchanged relative to Table 6.
Discussion
Water Quality and Compliance Outcomes
therefore, statistical power to detect changes varied among data sets. Individual parameter models at each site had a sample size ranging from 12 (for bromate at location 3, where a model could not be fit) to 16,203, with an average of about 4,296 samples (Table 27Table 31). Significant changes were more easily detected in online sensor datasets with sample numbers up to 531,603. Some undesirable changes were observed at some locations (Tables 3 and 4), but a widespread harmful effect was not indicated over the period of the intervention.
In particular, microbial indicator levels at location 3 appeared to worsen following the WSP intervention. This might be explained by the utility managers’ desire to keep chlorine levels as low as possible in response to concerns about disinfection by-products and their potential adverse health effects. Due to local socio-political pressure to eliminate chlorine usage, this location is looking to pilot an
unchlorinated water supply in the near future. The WSP at this location did not emphasize control of microbial contamination due to the perceived high quality of the groundwater source. At location 5, interim turbidity compliance (after the sand filters) worsened, although the finished water saw the opposite effect, with an improvement (decrease) in turbidity levels and improved compliance based on manually sampled and sensor water quality data. Finally, bromate formation increased at locations 1 and 5, potentially due to changes in ozonation practices.
Drinking water utilities may adopt rapid testing methods in the future as the technology becomes more refined and widely available.
Among the four measured microbial water quality indicators, total coliform and heterotrophic plate counts showed greater variability than E. coli and fecal streptococci, demonstrating significant changes in some cases. Total coliform compliance improved significantly at locations 1 and 5 (full WSP), while levels worsened at location 3. Heterotrophic plate counts decreased significantly at only one of the five
locations, and were not examined in the compliance portion of our study (owing to the lack of applicable compliance thresholds for piped water supplies in France and Spain). This finding corresponds somewhat with results from Iceland, where two out of the five locations examined individually showed significant drops in mean heterotrophic plate counts (Gunnarsdottir, Gardarsson, Elliott, et al., 2012). When pooled across locations included in the Iceland study, heterotrophic plate counts exceeding 10 colony-forming units were significantly less likely following the WSP intervention (Gunnarsdottir, Gardarsson, Elliott, et al., 2012). The Iceland study examined unchlorinated drinking water suppliers and also included smaller water suppliers (<5,000 inhabitants) that typically have higher initial non-compliance rates.
Health Outcomes
Changes in the incidence of acute gastroenteritis are generally difficult to discern due to public health surveillance data limitations and the existence of multiple exposure routes (CDC, 2011). Bottled water consumption and self-treatment of gastrointestinal disease apply to large swaths of the population in France and Spain, inhibiting the ability to associate WSPs and health outcomes. Only about two-thirds of the population is expected to consume tap water (Therre et al., 2008), and the majority of acute gastroenteritis cases are self-treated or resolve without treatment (Lopman et al., 2003). Large
background fluctuations in acute gastroenteritis stem from the dominance of other pathogen transmission routes, especially the annual winter peak in person-to-person norovirus transmission (Arena et al., 2014; Chikhi-Brachet et al., 2002), making drinking water exposure a relatively minor contributor to the burden of disease (Lopman et al., 2003).
strengthened the location 1 and 3 analyses by capturing about 32-33% of total cases (Bounoure et al., 2011). Our estimates of acute gastroenteritis incidence were generally on the same order of magnitude as others in the literature (Chikhi-Brachet et al., 2002; Kowalzik et al., 2015; Van Cauteren, De Valk, Vaux, Le Strat, & Vaillant, 2012). The overall incidence rates found in France were somewhat higher than other sources, while the incidence rates found in Spain were somewhat lower, illustrating differences in surveillance methods. Performing pooled analysis across locations (e.g., via a multi-level model) would be useful, but is precluded by the small number of case studies and differences in data collection methods. A prospective, randomized controlled study design might be recommended as the gold standard for
overcoming confounding and data consistency constraints.
One of the three case studies did demonstrate a reduction in acute gastroenteritis incidence following WSP implementation, corresponding to about a 4% decrease in acute gastroenteritis incidence in the overall population, or 6% in the 15-64 age group (Tables 6 and 7). This occurred at location 1, which had the largest health dataset. Location 5 full (production and distribution) and partial (distribution only) WSPs showed the opposite of the expected effect, with significantly higher post-implementation rates of acute gastroenteritis among adults in both intervention areas, relative to the comparison area. Of the three locations examined, location 5 had the lowest reported case numbers, leading to low statistical power and wide confidence intervals. Unfortunately, the low number of cases per municipality could have been driven by outbreak events, whether stemming from drinking water, foodborne, or other exposures. CatSalut was unable to share any additional information about possible outbreaks during the after-WSP study period.