REGULATION OF MCM HELICASE LOADING DURING EARLY DIFFERENTIATION AND CELL CYCLE RE-ENTRY
Jacob Peter Matson
A dissertation submitted to the faculty at the University of North Carolina at Chapel Hill in partial fulfillment of the requirements for the degree of Doctor of Philosophy in the Department of
Biochemistry and Biophysics.
Chapel Hill 2019
ABSTRACT
Jacob Peter Matson: Regulation of MCM helicase loading during early differentiation and cell cycle re-entry
(Under the direction of Jeanette G. Cook)
Cells initiate DNA replication at thousands of DNA replication origins every cell cycle. Minichromosome maintenance complexes (MCM) unwind DNA to initiate replication in S phase. MCM loading onto DNA, called “origin licensing”, occurs in G1 phase. Multiple mechanisms restrict origin licensing to G1 phase to prevent aberrant MCM loading and genotoxic re-replication in S phase. For this reason, cells load 5-10 fold excess MCM in G1 as dormant origins to protect against replication stress in S phase. The origin licensing checkpoint ensures sufficient MCM loading before S phase entry. MCM loading occurs in G1, yet cells have a variety of G1 lengths. Stem cells have short G1s while differentiated cells have long G1 phases. Additionally, cells may exit the cell cycle to quiescence, a state without division. Cells
re-entering the cell cycle from quiescence have longer G1s than actively proliferating cells. How cells accomplish the same MCM loading under these different G1 lengths is poorly understood.
We used quantitative single cell flow cytometry and live cell imaging to measure MCM loading across varying G1 lengths. We found that stem cells with short G1s load MCM
ACKNOWLEDGEMENTS
Thank you to my mentor Dr. Jean Cook. I have learned quite a lot about being a scientist from you, including experimental design, writing, and thinking a few steps ahead. Your career advice has been valuable, as has your scientific expertise and guidance, particularly allowing me to try new things and supporting scientific collaborations. I enjoyed our animated
discussions about science and the push to make new discoveries. Thank you to my thesis committee, Dr. Dale A Ramsden, Dr. Henrik G Dohlman, Dr. Robert J. Duronio, Dr. Michael Ben Major, and Dr. Jeremy E. Purvis for your insightful advice and suggestions over the years.
Thank you to all the current and past Cook lab members that I have worked with over my graduate career. In particular, thank you to my rotation mentor Dr. Kate Coleman for teaching me many experimental techniques and for the good advice. Thank you Dr. Pedro Pozo for talking about the struggles of grad school and always being excited about MCM. Thank you Huaitong Wu for your dedicated help with my experiments. Thank you Juanita Limas for being a character and rooting for Megan. Thank you to the collaborators over my graduate career, Dr. Kathleen Mulvaney and the Major Lab, Dr. James Shellhammer and the Dohlman lab, Dr. Ryan Baxley and the Bielinsky lab at Univ. of Minnesota, and Phil Coryell and the Purvis lab.
TABLE OF CONTENTS
LIST OF FIGURES ... ix
LIST OF ABBREVIATIONS ... xi
CHAPTER 1: INTRODUCTION ... 1
Cell cycle structures ... 1
Minichromosome Maintenance Complexes and origin licensing ... 4
DNA Replication Origins ... 6
MCMs in S phase ... 7
The Origin Licensing Checkpoint ... 8
How does CDK activity affect MCM loading? ... 9
What are the MCM loading dynamics in G1? ... 9
CHAPTER 2: CELL CYCLE PROLIFERATION DECISIONS: THE IMPACT OF SINGLE CELLANALYSES ... 12
Introduction ... 12
Methods to assess proliferation in individual cells. ... 14
Cell cycle proliferation and the restriction point phenomenon ... 17
Cell cycle commitment during re-entry to G1 from quiescence ... 19
Cell cycle decisions in actively-proliferating populations. ... 27
Multiple proliferation decision points – multiple mechanisms? ... 30
Outlook ... 33
CHAPTER 3: RAPID DNA REPLICATION ORIGIN LICENSING PROTECTS STEM CELLPLURIPOTENCY ... 35
Introduction ... 35
Results ... 38
Differentiation, G1 length, and MCM loading rate are coupled ... 46
Fast loading hESCs have more Cdt1 in G1... 53
Manipulating MCM loading factors alters MCM loading rates ... 57
Rapid MCM loading protects hESC pluripotency ... 60
Discussion ... 64
Materials and Methods ... 70
Cell Culture ... 70
Total lysate and chromatin fractionation ... 71
Immunoblotting ... 72
Flow Cytometry ... 73
Doubling Time ... 74
Cell Synchronization and treatments ... 74
Cloning ... 75
Cell Line construction and inducible protein production ... 76
siRNA transfections ... 77
Differentiation ... 77
Phase contrast microscopy ... 79
Immunofluorescence Microscopy ... 79
qPCR (Figure 3.7) ... 80
Generating ARPE-19-iPS cells ... 81
Immunofluorescence characterization of ARPE-19-iPS cells ... 81
Bisulfite sequencing and methylation analysis ... 82
Quantitative reverse transcriptase PCR (Figure 3.3) ... 82
Teratoma analysis ... 83
Ergodic Rate Analysis ... 83
Quantification and Statistical Analysis ... 84
Introduction ... 85
Results ... 88
G0 cells re-entering the cell cycle are underlicensed compared to actively proliferating cells ... 88
Cells re-entering S phase from G0 are hypersensitive to replication stress ... 95
Proliferating epithelial cells have a robust p53-dependent origin licensing checkpoint ... 98
The first G1 phase after G0 has an impaired origin licensing checkpoint. ... 106
G0 cells re-entering the first cell cycle load MCM to license origins slowly ... 108
Extending the first G1 after G0 substitutes for the impaired licensing checkpoint ... 111
Discussion ... 117
Materials and Methods ... 123
Cell culture and synchronization ... 123
DNA Cloning and cell lines ... 124
siRNA transfections and drug treatment... 125
Total protein lysate and chromatin fractionation ... 126
Immunoblotting ... 127
Flow cytometry ... 127
Doubling time ... 129
Live cell imaging ... 129
CHAPTER 5: CONCLUSIONS AND FUTURE DIRECTIONS ... 131
Does chromatin influence the rapid MCM loading in stem cells? ... 132
How does the origin licensing checkpoint measure the amount of loaded MCM? ... 133
LIST OF FIGURES
Figure 2.1. Advantages of single cell analysis ... 16
Figure 2.2. The restriction point during re-entry to G1 from quiescence ... 21
Figure 2.3 Multiple proliferation decisions in actively dividing cells ... 32
Figure 3.1. Pluripotent stem cells load MCMs faster than differentiated cells... 37
Figure 3.2. Flow Cytometry Gating ... 40
Figure 3.3. Validation of MCM antibodies for chromatin flow cytometry ... 41
Figure 3.4. Characterization of pluripotent and differentiated cells ... 44
Figure 3.5. Quantification of MCM loading rate by ergodic rate analysis ... 47
Figure 3.6. Ergodic Rate Analysis binning ... 48
Figure 3.7. Differentiation universally decreases MCM loading rate ... 49
Figure 3.8. Stem cell differentiation ... 50
Figure 3.9. Cyclin E overproduction uncouples MCM loading and G1 length ... 52
Figure 3.10. G1 Cdt1 levels remain constant with Cyclin E overproduction ... 54
Figure 3.11. hESCs have high levels of Cdt1 in G1 ... 55
Figure 3.12. Fast MCM loading rate promotes short G1 length in hESCs ... 58
Figure 3.13. Manipulating MCM loading factors alters MCM loading rates ... 59
Figure 3.14. Slow MCM loading promotes differentiation ... 61
Figure 3.15. Complete microscopy dataset and endoderm differentiation ... 63
Figure 3.16. Slow MCM loading promotes differentiation ... 65
Figure 3.17. Reducing MCM loading rate by an alternative siRNA ... 67
Figure 4.1. The first S phase after cell cycle re-entry from quiescence (G0) is underlicensed. ... 89
Figure 4.2. Flow cytometry gating and alternate cell lines ... 91
Figure 4.3. The first S phase after G0 is hypersensitive to replication stress. ... 96
Figure 4.4. Repeated transitions between G0 and proliferation trend towards an increased replication stress sensitivity ... 97
Figure 4.6. Flow cytometry plots of siRNA in proliferating cells. ... 102
Figure 4.7 p53 knockout cripples the licensing checkpoint, causing underlicensing ... 105
Figure 4.8. Cells re-entering the first G1 after G0 lack a checkpoint-induced G1 arrest... 107
Figure 4.9. Live cell imaging of Cdc6 in first and second cycles after G0. ... 110
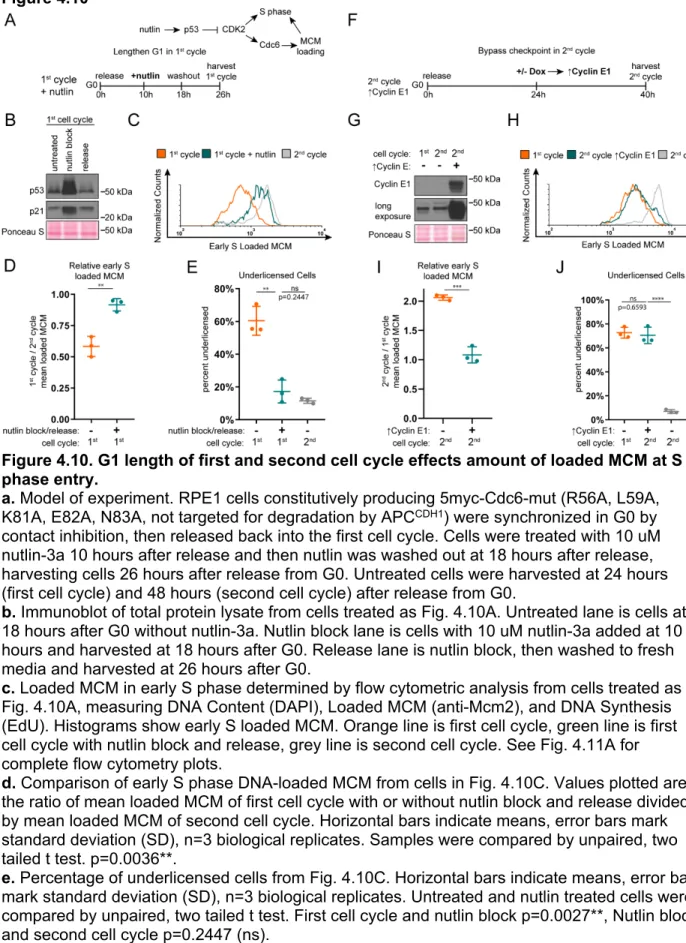
Figure 4.10. G1 length of first and second cell cycle effects amount of loaded MCM at S phase entry. ... 112
Figure 4.11 Overproduction of Cdt1 and a stable Cdc6 mutant do not rescue underlicensing in the first cell cycle after G0. ... 115
LIST OF ABBREVIATIONS APC – Anaphase promoting complex
BSA – Bovine serum albumin CDC6 – Cell division cycle 6 CDK – Cyclin dependent kinase CDT1 - Cdc10 dependent transcript 1 CDX2 - Caudal Type Homeobox 2 CMG – Cdc45 MCM GINS
CSK – cytoskeleton buffer DDK – Dbf4-dependent kianse
DMEM - Dubecco’s modified Eagle’s medum DNA – Deoxyribonucleic acid
DOX - doxycycline
EDU - 5-ethynyl-2'-deoxyuridine FBS- Fetal bovine serum
FUCCI – Fluorescent ubiquitin cell cycle indicator HBO1 – Histone acetyltransferase binding to ORC1 hESC – human embryonic stem cell
HRP – Horseradish peroxidase iPSC – induced pluripotent stem cell KO - knockout
MCM – Minichromosome maintenance complex MEM – Minimum eagle’s medium
NPC – Neural progenitor cells ORC – Origin recognition complex
PBS- Phosphate buffered saline
PCNA – Proliferating cell nuclear antigen PCR – Polymerase chain reaction
PP2A – Protein phosphatase 2A RB – Retinoblastoma protein RNA – Ribonucleic acid
CHAPTER 1: INTRODUCTION Cell cycle structures
The eukaryotic cell cycle consists of four phases: G1, S, G2, and M phase. However, all cells do not have the exact same cell cycle structure, with some cells having large variations in G1 lengths. Additionally, some cell cycles are missing phases altogether such as
endoreduplication cycles which lack M phase (Edgar and Orr-Weaver, 2001). My research has focused on events in G1 and S phase. My overall goal is to understand how cells with different cell cycle structures progress through the same molecular pathways in G1 phase and enter into S phase. G1 length varies between cell cycles during development, where stem cells have rapid cell cycles with short G1 lengths and differentiated cells have slow cell cycles with long G1 lengths (VanOudenhove et al., 2016). I compared these two cell cycles to understand how a change in G1 length changes regulation of G1 events and regulates development. Cells in G1 phase may leave the cell cycle and exit to quiescence, a state outside the cell cycle without cell division. Quiescent cells can re-enter the cell cycle in G1 phase to begin dividing again. I
compared cells transitioning from quiescence back into G1 phase and actively proliferating cells to understand how active cell cycle regulation differs from cell cycle re-entry from quiescence. I found that G1 regulation is critical for maintaining pluripotency in stem cells and that abnormal G1 regulation during cell cycle re-entry makes the first cell cycle a high risk cycle compared to proliferating cell cycles. Thus, understanding unique cell cycle structures will provide insight into how their structure influences cell fate decisions and the lifecycle of a cell.
2016). The cell cycle is linked to the probability of a stem cell to become a differentiated cell. Studies show that stem cells treated with a differentiation stimulus tend to differentiate
asynchronously, suggesting that stem cells only respond to a stimulus at certain times. Pauklin and Vallier showed that pluripotent cells respond to differentiation cues only in G1 phase and that cells in early G1 phase respond to endoderm and mesoderm cues and cells in late G1 phase respond to ectoderm cues (Pauklin and Vallier, 2013). Further studies revealed that key cell cycle regulators in S, G2, and M phase including Checkpoint kinase 2 and Cyclin B are refractory to differentiation cues, restricting the stem cell responses to differentiation cues to G1 phase (Gonzales et al., 2015). Taken together, these studies demonstrate the reason stem cells differentiate asynchronously is because their cell cycles are asynchronous and some cells must progress through the cycle into G1 before responding to a stimulus. Thus, a short G1 phase balances self-renewal and differentiation by limiting the time for differentiation.
commitment to S phase (Cappell et al., 2016). APCCdh1 activity is attenuated and almost completely inactive in pluripotent stem cells due to inhibitory phosphorylation by CDK2, high levels of the APC inhibitor Emi1, and high levels of Skp2 (which targets APC subunits for degradation) (Ballabeni et al., 2011; Bar-On et al., 2010). All of these deregulations of G1 control in pluripotent stem cells drive an abbreviated G1 phase of only 2-3 hours. Once stem cells begin differentiation, they regain a long G1 phase by increasing CDK inhibitor proteins, increasing APC activity, and decreasing CDK2 activity (VanOudenhove et al., 2016; Boward et al., 2016). Thus, pluripotent cells maintain a short G1 phase by deregulation of G1 cell cycle control and gain a longer G1 phase upon differentiation.
Quiescent cells re-entering the cell cycle into G1 phase must first reset all the restrictive regulations that maintain quiescence and prevent proliferation. One key hurdle to re-enter the cycle is Rb hyperphosphorylation, which activates E2F transcription as part of the restriction point. The deeper the quiescence, the longer it takes to activate E2F gene expression, making the first G1 phase during cell cycle re-entry longer than G1 of proliferating cells (Kwon et al., 2017). Cells must alter regulatory pathways upstream and downstream of Rb to fully re-enter G1 phase. In proliferating cells, Rb is monophosphorylated in G1 phase, but in quiescent cells Rb is unphosphorylated requiring the extra step of CDK4/Cyclin D phosphorylation of Rb during cell cycle re-entry (Narasimha et al., 2014). Next, CDK2 would hyperphosphorylate Rb to activate E2F gene expression but that also has additional steps. CDK2 is cytoplasmic in quiescent cells and must translocate to the nucleus (Dietrich et al., 1997; Nevis et al., 2009). Additionally, the CDK2 inhibitor p27 is upregulated in quiescence and must be degraded by specialized ubiquitin ligases during the transition from G0 to G1 (Kamura et al., 2004; Susaki et al., 2007). The program of cell cycle gene repression in G0 is mediated by the DREAM
complex, which includes the Rb related protein p130 and requires the Dyrk1a kinase activity for DREAM complex assembly (Litovchick et al., 2007, 2011). To re-enter the cell cycle, G0 cells must disassemble the DREAM complex and decrease Dyrk1a kinase activity, presumably through protein degradation (Liu et al., 2016; Chen et al., 2013; Bhattacharya et al., 2003). Taken together, all of these hurdles cause G1 during cell cycle re-entry to be longer than G1 in proliferating cells.
Minichromosome Maintenance Complexes and origin licensing
MCM loading is also referred to as “origin licensing” (DePamphilis et al., 2006). Once cells enter S phase, replication origins “fire” when MCM (along with other proteins) unwinds DNA to begin replication (Remus and Diffley, 2009). MCM travels with replication forks to unwind DNA ahead of the DNA polymerase that replicates DNA. MCMs are unloaded off DNA once replication forks terminate (Moreno et al., 2014; Maric et al., 2014). Thus, MCM regulation is divided into two phases – origin licensing occurs in G1 phase and origin firing occurs in S phase.
Origin licensing begins as early as the telophase preceding G1 in some cell types, or in G1 phase (Dimitrova et al., 2002). The exact timing of when MCMs load onto DNA is not clear, but it certainly happens over time as cells progress through G1 (that is, all MCMs are not loaded onto origins simultaneously). An origin is licensed for replication once it has two DNA loaded MCM hexamers loaded head to head (called double hexamers). However, MCMs cannot load onto DNA on their own; other proteins facilitate MCM loading onto DNA. First, the Origin Recognition Complex (ORC) binds to origin DNA. ORC recruits Cell Division Cycle 6 (CDC6) and CDC6 binds ORC directly. CDC6 is required to recruit MCMs to origins, and has an ATPase function with the additional role of quality control, ejecting incorrectly bound MCMs. Next, Cdc10 dependent transcript 1 (CDT1) binds to MCM to facilitate loading onto DNA. MCM is a
DNA Replication Origins
Origin licensing occurs at discrete genomic loci, in the context of other DNA based processes including transcription, chromatin, and DNA sequence.
Budding yeast have origin consensus sequences to specify origin locations, but higher
eukaryotes do not have an origin consensus sequence (Leonard and Méchali, 2013). Instead, metazoan origins are associated with euchromatin, G-quadraplexes, promoters and termination sites (Prioleau and Macalpine, 2016). Loaded MCM double hexamers can slide along DNA, pushed by RNA polymerase to locations other than the origin where MCM was first loaded (Gros et al., 2015). Therefore, actively transcribed genes may sweep MCM out of the
transcribed region, localizing MCM to the beginning or end of transcribed genes (Powell et al., 2015; Chen et al., 2019). This repositioning of MCM is important, as intragenic origins in actively transcribed genes cause transcription-replication conflict in S phase (Macheret and Halazonetis, 2018). Thus, locations of origins in higher eukaryotic are influenced by many factors.
Chromatin environment shapes origin location and may require additional proteins facilitate MCM loading. The ORC associated protein (ORCA) localizes to heterochromatin and recruits ORC to DNA during G1 phase. Cells without ORCA cannot recruit ORC to
heterochromatin (Shen et al., 2010). ORCA also recruits histone modifying enzymes to heterochromatic regions to promote their replication in late S phase (Giri et al., 2015). CDT1 recruits the H4-histone acetyltransferase HBO1 (Human acetylase binding to ORC1) to origins to acetylate nearby histones, which is required for MCM loading (Miotto and Struhl, 2008, 2010). Finally, the lysine methyltransferase Set8 monomethylates histone H4K20 to promote origin licensing (Tardat et al., 2010). The monomethyl is converted to dimethyl and is present on about 80% of histones across the genome (Kuo et al., 2012). ORC1 contains a bromo adjacent
suggest that origin licensing depends on the chromatin environment, and that origins at genomic loci with different chromatin structure may require specialized MCM loading reactions.
MCMs in S phase
Licensed origins require several co-factors to convert the loaded MCM double hexamer to active helicases in S phase. The fully active helicase is called CMG and consists of Cdc45, MCM2-7 and GINS (Psf1, Psf2, Psf3 and Sld5) (Costa et al., 2011). S phase kinase activity of CDK2 and the Dbf4-dependent kinase (DDK) phosphorylate various components of CMG to activate them and fire the origin (Labib, 2010). DDK exclusively phosphorylates double hexamers and not free MCM by binding MCM2 and MCM4 across both hexamers, one from each adjacent MCM in the double hexamer (Sun et al., 2014). Origins fire throughout S phase in a generalized order called the replication timing program (Aparicio, 2013). Origins are classified as early or late depending on when they fire in S phase and is regulated by many factors including chromatin modifications, higher order nuclear structure and stress such as a DNA damage response (Fragkos et al., 2015). New origin licensing is strictly prohibited in S phase by mechanisms targeting all the MCM loading proteins. CDC6 is phosphorylated by CDK2/Cyclin A and exported to the cytoplasm (Yim et al., 2013; Petersen et al., 1999a). ORC1 is
phosphorylated by CDK2/Cyclin A and targeted for destruction by the E3 ubiquitin ligase SCFSkp2 (DePamphilis, 2003; Méndez et al., 2002). CDT1 is targeted for degradation by
CRL4Cdt2 and SCFSkp2 as well as directly inhibited by Geminin protein binding and CDK1/Cyclin A phosphorylation (Arias and Walter, 2005; Sugimoto et al., 2004; Nishitani et al., 2004;
McGarry and Kirschner, 1998; Zhou et al., 2018). The methyltransferase Set8 is also degraded by CRL4Cdt2 to prevent re-replication (Tardat et al., 2010). If any licensing occurs in S phase, cells may re-replicate their DNA, causing double strand breaks, aneuploidy and genome
Cells must load all the MCM required for replication in the preceding G1 phase, but in times of replication stress cells need more MCM to ensure complete replication. For that reason, cells typically load 5-10 times extra MCM than normally required to complete S phase as
“dormant origins” (Woodward et al., 2006; Ge et al., 2007; Ibarra et al., 2008). When a replication fork encounters replication stress it will stall and stop replicating. Cells then fire a nearby dormant origin to start a new replication fork and rescue the stalled fork (Yekezare et al., 2013). Cells may continue to proliferate with decreased origin licensing, but fewer dormant origins makes them hypersensitive to replication stress. Mice with diminished dormant origins have defects in proliferative tissues such as the hematopoietic system, increased genome stability, and cancer (Pruitt et al., 2007; Kunnev et al., 2010; Shima et al., 2007). Ensuring sufficient loaded MCM at S phase entry is critical to maintain genome stability.
The Origin Licensing Checkpoint
Cells ensure sufficient loaded MCM through the origin licensing checkpoint. The
licensing checkpoint is p53-dependent pathway that decreases CDK2 activity to block S phase entry until there is a sufficient amount of loaded MCM (Nevis et al., 2009; McIntosh and Blow, 2012). The licensing checkpoint seems to inhibit CDK2 by multiple mechanisms, but the exact pathway is unknown. CDK2 requires phosphorylation of T160 for kinase activity, this
phosphorylation is decreased when MCM loading is decreased, suggesting the origin licensing checkpoint regulates CDK2 T160 phosphorylation (Nevis et al., 2009). Another licensing checkpoint target upstream of CDK2 is Cyclin D expression, which is diminished during
checkpoint and enter S phase prematurely are hypersensitive to replication stress and treatment with replication inhibitors causes apoptosis (Feng et al., 2003; Shreeram et al., 2002;
Zimmerman et al., 2013). The specific sensitivity of cancer cells but not normal cells to decreased MCM loading makes origin licensing a potential target in cancer therapy, and preliminary drug screens for licensing inhibitors shows promise targeting cancer cells (Gardner et al., 2017).
How does CDK activity affect MCM loading?
The cell cycle is broadly divided into a period of low CDK activity in G1 phase and a period of high CDK activity in S/G2/M phases. MCM loading and DNA replication are restricted to G1 and S phase, respectively. Presumably low CDK activity is permissive for origin licensing and high Cdk activity is inhibitory for origin licensing and permissive for origin firing (Siddiqui et al., 2013). One group claims that CDK2/Cyclin E activity inhibits MCM loading, while another that it is CDK2/Cyclin A activity that inhibits MCM loading (Ekholm-Reed et al., 2004; Wheeler et al., 2008). However, CDK2/Cyclin E is also required to stabilize Cdc6 for MCM loading (Mailand and Diffley, 2005). How can Cdk2 activity both be activating and inhibiting MCM loading at the same time? Is there a clear role for CDK2 in MCM loading? I address this question in Chapter 3 by overproducing Cyclin E and measuring MCM loading rate, finding that Cyclin E does not inhibit MCM loading, rather it only shortens G1 so cells have less time to load MCM.
What are the MCM loading dynamics in G1?
the same amount of MCM, because most G1 variation occurs in the early G1 phase (Foster et al., 2010). Another model is that MCM loading increases exponentially as cells move through G1 phase. In this case, no matter if MCM loading begins in early G1 or late G1, the bulk of MCM loading would be in late G1. Some data support a model where most MCM loading occurs in late G1. Symeonidou et al. used Fluorescence Recovery After Photobleaching to measure the immobile (DNA-loaded) fraction of MCM in G1 phase. They found a transient association between MCM in DNA in telophase and early G1 phase, and then a gradual increase in the stable (loaded) fraction throughout G1. However, about 50% of MCM total immobile fraction became immobile in the very late G1 phase, suggesting some factor rapidly promoted loading in late G1. Perhaps there is enough MCM loaded to relieve the licensing checkpoint, increasing Cdk2 activity to stabilize Cdc6? Then Cdc6 could help load more MCM, further increasing Cdk2 activity, which would start a positive feedback loop by stabilizing even more Cdc6. Whichever type of loading is correct, linear or exponential, the length of G1 will also be a factor in the amount of loaded MCM at the start of S phase.
address this question in Chapter 3 by measuring average loading rate in stem cells and
CHAPTER 2: CELL CYCLE PROLIFERATION DECISIONS: THE IMPACT OF SINGLE CELL ANALYSES1
Introduction
The cell cycle is a series of tightly-regulated molecular events controlling DNA replication and mitosis, producing two new daughter cells from a single parent cell. Every cell cycle,
individual metazoan cells have the opportunity to adopt one of two mutually-exclusive proliferation-related fates: continued cell cycle progression or cell cycle exit. Cell cycle exit encompasses multiple distinct states including permanent arrests associated with terminal differentiation or senescence and reversible arrest known as quiescence (G0). Settings where the importance of cell cycle entry is particularly apparent include hematopoiesis, replenishing the epithelial lining of the digestive tract, replacing shed skin cells, activation of adaptive
immune responses, and wound healing. Tight control over cell cycle entry and exit is also critical for tumor prevention since most transformed cells do not appropriately respond to cues that trigger quiescence. It is thus important to understand the processes that determine cell cycle entry, cell cycle progression, and exit to quiescence. In this review, we highlight advances in understanding such proliferation decisions in mammalian cells and particularly the impact of recent improvements in single cell analysis methods.
Much of our understanding of the molecular determinants of cell cycle progression comes from analyses of cell populations. There are well-documented substantial changes in gene expression, protein abundance, protein post-translational modifications, and DNA synthesis as a population of cells moves from one cell cycle phase to the next, or when a
population becomes quiescent. Commonly-used methods to monitor these changes include immunoblotting and quantitative real-time PCR for individual proteins or messenger RNAs or proteomics and transcriptomics for global analyses. The limits of detection for these methods have, until very recently, required pooled material from many thousands or millions of cells. A culture of genetically identical cells grown together are presumed to behave very similar to one another in the interpretation of such ensemble techniques though this assumption is not
necessarily valid.
Even when two cells begin a cell cycle phase at the same time - such as immediately after cytokinesis - marked variation among individual cells and heterogeneous responses to external and internal cell cycle cues lead to different rates of cell cycle progression (Chiorino et al., 2001). Cell cycle heterogeneity arises from intrinsic and extrinsic variability in gene
expression resulting in heterogeneity in mRNA and protein levels among individual cells (Snijder and Pelkmans, 2011; Raj and van Oudenaarden, 2008; McAdams and Arkin, 1997). Additional cell cycle variation could be a consequence of cell division itself. Although DNA is actively distributed equally into daughter cells, RNA, proteins, metabolites, and organelles may be randomly and unequally distributed at every cell division (Dueck et al., 2015; Darzynkiewicz et al., 1982). For example, Czerniak et al. used antibody staining to examine the distribution of several individual proto-oncoproteins with the potential to profoundly impact cell cycle
Each individual cell “decides” to proliferate or exit the cycle separately from the whole population, integrating numerous signals to time the transition from one phase of the cycle to the next (Spiller et al., 2010). The intercellular heterogeneity and generally asynchronous growth of proliferating cells creates challenges for precisely tracking their behavior. A popular method to overcome heterogeneity is artificially synchronizing cells with inhibitors in one cell cycle phase, releasing them from the block, and monitoring molecular markers over time.
Although cell cycle synchronization creates generally homogenous populations, the further each time point is removed from the initial synchronizing block, the more heterogeneous the
population becomes (Illustrated in Figure 2.1). Furthermore, the arrests themselves can induce unique stress signaling pathways that aren’t normally engaged (or are engaged at much lower intensity) in normal cell cycles (Murray et al., 2004; Lanni and Jacks, 1998; Kurose et al., 2006). For example, nocodazole synchronization in mitosis can create genome instability after mitotic exit (Minn et al., 1996).
Moreover, a population of cells may harbor consistent or transiently interconverting distinct subpopulations with different proliferation dynamics. Methods that measure the aggregate concentration or activity in a population may mask subpopulations containing different levels of individual protein abundance or activity (Balazsi et al., 2011). If a culture contains two very distinct populations in significant numbers (such as a mixture of proliferating cells and quiescent or senescent cells, ensemble molecular detection methods will report an intermediate level of activity that may not be a true reflection of either state (Figure 2.1B). Only experiments measuring cell cycle parameters from single cells can identify distinct
subpopulations that are hidden by methods that average the whole population. Methods to assess proliferation in individual cells.
routinely probed with antibodies to proteins that are only expressed in proliferating cells, and the expression intensity and number of expressing cells provide valuable diagnostic information (Walker, 1954; Champy, 1922; Gerdes et al., 1983; Yu et al., 1992). With respect to
understanding fundamental cell cycle regulation, early studies assessed DNA synthesis (using radioactive nucleotides or nucleotide analogs), protein abundance, localization,
post-translational modifications, and cell division in single cells grown under a variety of culture conditions. In this way, the eukaryotic cell cycle was divided into discrete phases (Taylor, 1960; Lajtha et al., 1954; Howard and Pelc, 1953).
The development of microfluidic flow cytometry that measures the intensity of fluorescent DNA or antibody stains revolutionized the cell cycle field. One of the many
advantages over the earlier methods is the routine and rapid quantification of thousands of cells per sample and the relatively unbiased comparisons among different samples (Darzynkiewicz et al., 2004). Moreover, multiple molecular parameters can be assessed simultaneously, and the number of distinct measurements is limited only by the spectral properties of the reagents and the fluorescence detectors. Since large numbers of cells are analyzed by flow cytometry simultaneously, researchers have opportunities to derive rates of cell cycle phase transitions and identify minor subpopulations of cells (Kafri et al., 2013; Roy et al., 2013). The opportunities for multiplex measurements have expanded significantly with the recent development of mass cytometry (Bendall et al., 2011).
Figure 2.1
Figure 2.1. Advantages of single cell analysis
(A) Hypothetical molecular signal in individual cells of an artificially-synchronized population. Black dots represent cell divisions. Cells are synchronized in the first cell cycle, but within two to three cell cycles the population is completely asynchronous. (B, Left) Single cell analysis
identifies and tracks a representative molecular signal in coexisting cell populations where different subpopulations take different cell cycle fates. (B, Right) Ensemble analysis of the same coexisting populations reports only the average signal that may not represent either
cell imaging, these biosensors were utilized initially by Sakaue-Sawano and subsequently by many others in a variety of physiological, developmental, and pathological settings to visualize cell cycle phases (Zielke et al., 2014; Coronado et al., 2013; Sugiyama et al., 2009). New
genome editing tools to efficiently incorporate fluorescent tags at endogenous genes will expand the proliferation reporters beyond the original FUCCI pair (Stewart-Ornstein and Lahav, 2016).
The high time resolution of fluorescent live cell imaging using fluorescent reporters is particularly powerful for determining the relationships among two or more events, even when they are closely-spaced in time (Welch et al., 2011; Spiller et al., 2010). Live cell microscopy reveals when a stereotypical order of events characterizes a given cell cycle phase (Muzzey and van Oudenaarden, 2009). For example, live imaging studies in both budding yeast and human cells identified sequences of protein degradation events that characterize passage through the individual subphases of mitosis or at the onset of S phase (Lu et al., 2014; Izawa and Pines, 2011; Coleman et al., 2015). Furthermore, automated cell identification and tracking computer programs and scripts now make it possible to generate robust datasets of reporter signal intensities from many hundreds of cells without the potential biases of quantifying cells by hand (Jaqaman et al., 2008; Carpenter et al., 2006). While these software tools are rapidly advancing, each imaging data set usually requires a customized image analysis pipeline and parameter optimization.
Cell cycle proliferation and the restriction point phenomenon
Commitment to either cell cycle progression or quiescence is mutually exclusive. Moreover the collection of molecular states that differ between quiescent cells and cells
committed to S phase entry is extensive and varied (Coller, 2011). It’s worth emphasizing here that quiescent cells are not characterized simply as the absence of proliferation-associated activities. Quiescence is actively maintained not only through continual transcriptional
of anti-apoptotic, anti-senescence, and anti-differentiation genes (Coller et al., 2006; Legesse-Miller et al., 2012; Sang et al., 2008; Litovchick et al., 2007).
The commitment to proliferation is a binary decision that is marked by the onset of DNA replication, an irreversible process. For this reason the transition from G1 to S phase is under tight and multifaceted controls; disruption in those controls drive many aspects of cancer cell phenotypes. Moreover, partial replication of chromosomal DNA is particularly dangerous in actively proliferating cells, because the eventual dissolution of replication forks that do not ultimately meet one another during normal termination leads to double-stranded chromosome breaks (Zeman and Cimprich, 2014). Thus, cells that start replication must be fully prepared to finish replication in a time-frame compatible with the biochemical limitations of the replication program (number of initiation sites, replication fork stability and speed, etc.).
To ensure adequate preparation before S phase onset and a robust start and finish for DNA replication, the G1/S transition is a “bistable switch.” Bistability is a steady state distribution of two populations which may interconvert in a rapid, switch-like manner. It characterizes many cell cycle transitions so that progression from one phase to the next is rapid, complete, and unidirectional (Tyson and Novak, 2008; Barr et al., 2016; Ferrell et al., 2011). In the case of the G1/S transition, bistability applies to the activation of the cyclin dependent kinase (Cdk) Cyclin E/Cdk2 which triggers replication initiation (Yuan et al., 2014). A series of molecular feedback and feedforward relationships ensure that very little Cdk2 is active during early-to-mid G1 but in late G1, Cdk2 activity is sharply upregulated and stably maintained until later in S phase. These include: Cyclin E synthesis, degradation of a Cdk2 inhibitor protein (p27KIP), Cdc6-dependent loading of the replicative DNA helicase to license replication origins, and Cyclin E/Cdk2
activation. Cdk2 activation is abrupt, but not at the exact same time in different cells. At any time in a population there may be subpopulations of cells with different discrete Cdk2 activity levels. The experimental challenges posed by this intercellular variability in the timing of rapid,
Cells commit to either quiescence (G0) or future S phase entry at the restriction point. The term “restriction point” or “R-point” was first proposed by Arthur Pardee in 1974 based on the timing of DNA synthesis in populations of hamster fibroblasts after a cell cycle block and release (Pardee, 1974). The restriction point was the cell cycle point past which cells were irreversibly committed to S phase entry, regardless of whether or not extracellular mitogens were removed (Zetterberg et al., 1995). It is sometimes described as the “point of no return” in the cell cycle with respect to S phase entry. Mammalian cells in culture require external
mitogens for proliferation, and since the DNA content of quiescent cells is the same as G1 cells, and mitogen stimulation leads to DNA synthesis before mitosis, it seems obvious that cells exit to quiescence from G1. What has not always been obvious is precisely when during the cell cycle mitogens are sensed to execute the commitment to quiescence versus proliferation nor what the precise molecular nature of the decision itself is (Hitomi and Stacey, 2001).
Pardee noted the limitations of measuring a cell population for cell cycle commitment and acknowledged the possibility that intercellular heterogeneity or the presence of fast-responding subpopulations would be missed in his study (Pardee, 1974). A subsequent single cell microscopy study in 1985 by Zetterberg and Larsson indicated that the only time mitogens are essential for the commitment to proliferation is in G1 phase (Zetterberg and Larsson, 1985). In these pioneering experiments, the authors conducted time lapse microscopy of proliferating mouse fibroblasts that were transiently deprived of mitogens. They found that the only cells that responded to mitogen withdrawal (by markedly delaying the next cell division) were very “young” cells in the first few hours after mitosis. They also noted intercellular variability in G1 length. Their observations have guided discussions of cell cycle commitment as an exclusively G1 event for the past 30 years.
Cell cycle commitment during re-entry to G1 from quiescence
central relevance, external mitogens activate signal transduction activities including the Ras GTPase (Massagué, 2004). Ras activation stimulates a pathway culminating in activated gene expression through transcription factors such as c-Myc, serum response factor, and others (Blagosklonny and Pardee, 2002; Shaulian and Karin, 2002; Zhang et al., 2016). Among the principle proliferation genes under control of these transcription factors are those encoding D-type cyclins (hereafter Cyclin D). Cyclin D protein complexes with either of two redundant cyclin-dependent protein kinases, Cdk4 or Cdk6, and cyclin binding activates Cdk4/6 to phosphorylate the Retinoblastoma (Rb) transcriptional repressor at one of many individual phosphorylation sites. Rb does not itself bind DNA but rather is recruited to specific genes through interaction with the family of DNA binding transcription factors known as the E2F family. E2F controls the expression of a suite of genes necessary for DNA replication, S phase progression, and mitosis. Rb binds E2F which results in active transcriptional repression of those E2F target genes. For many years, the prevailing paradigm – based largely on molecular assays of whole cell populations - has been that initial partial Rb phosphorylation by Cyclin D/Cdk4 (or Cyclin D/Cdk6) gradually releases E2F inhibition to activate transcription (Massagué, 2004; Giacinti and Giordano, 2006; Weinberg, 1995; Blagosklonny and Pardee, 2002; Johnson and Skotheim, 2013). One of the E2F target genes that is induced is cyclin E, and the Cyclin E protein binds and activates the Cdk2 protein kinase which then participates in Rb phosphorylation in a positive feedback loop; this feedback loop is further reinforced by the fact that E2F1 is one of the E2F target genes. Full Rb hyperphosphorylation completely releases Rb from E2F relieving repression of E2F target genes and allowing for activated E2F-dependent transcriptional induction and S phase entry.
Figure 2.2
Figure 2.2. The restriction point during re-entry to G1 from quiescence
(A) The prevailing paradigm of the restriction point. Mitogens activate Ras signaling,
downstream MAP Kinases, and ultimately Cyclin D transcription. Cyclin D complexes with CDK4 and CDK6 to partially phosphorylate Rb, and this hypophosphorylation causes release from E2F and partially activates Cyclin E expression. Cyclin E complexes with CDK2 to
commitment. (B) An alternate model for the restriction point. Cyclin D-CDK complexes only monophosphorylate Rb on 14 unique sites. The monophosphorylated Rb remains E2F-bound, but at least some aspects of Rb-mediated gene repression are relieved moving cells from G0 to G1. Multiple sustained mitogen-dependent inputs (p27 degradation, origin licensing, etc.)
emerged later as a popular marker of post-restriction point cells which have committed to division. The prevailing model of gradual and progressive Rb phosphorylation during G1 was not easily reconciled with an all-or-none proliferation decision however. Methods that measure entire populations of cells – such as DNA synthesis by general thymidine incorporation or immunoblotting cell lysates for Rb hyperphosphorylation, report only a global average of any subpopulations, making it difficult to precisely detect a switch between two states. To overcome this hurdle and focus specifically on E2F control, Yao et al. used single cell flow cytometry with fluorescent E2F or Cyclin D transcriptional reporters to correlate mitogen-induced gene
expression with the switch triggering cell cycle commitment during re-entry from quiescence (G0) (Yao et al., 2008). They synchronized cells in G0 by mitogen withdrawal then re-stimulated with serum. Transcriptional activity displayed an all or none bistable response resulting in two distinct cell populations. That is, each individual cell either remained quiescent with no reporter transcription, or displayed maximally-active expression. Significantly, there were no intermediate states and no partial commitment to the cell cycle. Sustained mitogen stimulation shifted the probability that any individual cell committed to S phase entry. This shifting probability was detectable as changes in the distribution of the population between the two states. Single cell flow cytometry clearly distinguished and quantified the two subpopulations of maximal or minimal response.
The study by Yao et al. was also the first demonstration of a bistable commitment point directly related to E2F activity. A feature of this bistability was that cell cycle commitment measured by reporter activation required sustained and strong E2F stimulation, but once activated, was largely irreversible. Low levels of mitogens were insufficient to pass the
re-enter the cell cycle, and committed cells retain their high E2F activity even if the environment favoring proliferation changes.
One mechanism that maintains E2F activity once it crosses the commitment point is feedforward regulation of the E2F1 gene itself. E2F1 transcription is stimulated not only by E2F but also by the c-Myc transcription factor (Leung et al., 2008) which is stabilized by mitogen signaling (Sears et al., 2000). The dynamics of mitogen activated E2F1 expression were
precisely monitored by Dong et al. with an updated fluorescent E2F1 transcriptional reporter for single cell live imaging to compare the contributions of Cyclin/Cdk and Myc to E2F dependent cell cycle commitment (Dong et al., 2014). Importantly, they tracked the behavior of individual cells over time, and correlated commitment to divide with each cell’s history of reporter activity. At any time before irreversible commitment to the cell cycle, the E2F transcriptional activity in a cell predicted the probability for commitment to cell division. Greater levels of transcription before the restriction point correlated with higher probability to re-enter the cell cycle, passing the restriction point.
A recent study further challenges the notion that E2F is progressively activated by progressive Rb phosphorylation via Cyclin D in early-to-mid G1 and then via Cyclin E in late G1 (Narasimha et al., 2014). A team of scientists from the Dowdy lab (Narasimha, Kaulich, Shaprio, et al.) used isoelectric focusing gels and a series of phospho-specific Rb antibodies to show that
Rb is exclusively monophosphorylated by Cyclin D throughout most of G1 phase (Figure 2.2B). Fully un-phosphorylated Rb was restricted to non-transformed cells under conditions of
profound quiescence induced by mitogen deprivation or after terminal differentiation.
Surprisingly, Rb was monophosphorylated at any one of the 14 individual Cdk sites by Cyclin D/Cdk4 (or Cyclin D/Cdk6), and the sites seemed to be functionally equivalent, though potential differences in their effects at different E2F-regulated genes remain to be investigated.
hyperphosphorylation at ≥ 10 sites. Each of the 14 different Cyclin D-induced
monophosphorylated Rb isoforms remained bound to E2F, suggesting that some degree of active repression at E2F-regulated genes may be maintained throughout G1 even after Cyclin D/Cdk4-mediated Rb phosphorylation (Narasimha et al., 2014). The apparent requirement for Cyclin E/Cdk2 to rapidly convert monophosphorylated Rb to fully hyperphosphorylated Rb suggests a strict division of labor between Cyclin D- and Cyclin E-activated kinases under normal conditions. The model proposed is that Cyclin D-mediated Rb phosphorylation is not the sole late G1 event that marks passage through the restriction point. Cyclin D may instead promote entry from quiescence into early G1 while other events are likely required to drive cells through G1 past the restriction point.
origin firing in S phase (at least in cells passing through G1 from quiescence), it is not clear that Cyclin E/Cdk2 activity alone normally causes commitment to future S phase entry.
Classic studies with overproduced Rb mutant forms that block G1 progression, overproduced cyclin that accelerates G1 progression, or genetic Cyclin and Cdk null alleles should be carefully interpreted in light of our current understanding about the redundancies among Rb and cyclin family members. The question remains if Rb hyperphosphorylation itself is the principal molecular determinant of restriction point passage or if it is a downstream
consequence of restriction point passage or some combination of both models. Cell type and whether the cells are actively proliferating or first entering the cycle from quiescence may be important determinants of when and how the commitment is made (discussed below).
Regardless of whether Cdk2 causes restriction point passage or is a subsequent reflection of that commitment, the correlation between an increase in Cdk2 activity and commitment to S phase entry is widely accepted. The molecular mechanisms that drive the increase in cyclin E/Cdk2 activity are all in feedforward relationships with Cdk2 to reinforce bistability (Figure 2.2B). One of these relationships is Cdc6-dependent DNA replication origin licensing, and Cdc6 is itself stabilized by Cdk2 phosphorylation in late G1 (Mailand and Diffley, 2005; Machida et al., 2005; Shreeram et al., 2002; Nevis et al., 2009). A second major Cdk2 regulator is the p27KIP protein which is both a direct inhibitor of Cdk2 kinase activity and also a substrate of Cyclin E/Cdk2. p27 is abundant in quiescent cells but is partially degraded shortly after cell cycle re-entry from G0 in early G1 which reduces, but does not eliminate p27 (Rizzardi and Cook, 2012). In late G1, the remaining p27 is eliminated by Cyclin E/Cdk2-induced
feedforward mechanisms serve to maintain high activity through the G1/S transition (Cappell et al., 2016).
Cell cycle decisions in actively-proliferating populations.
The proliferation decision committing cells to complete the cell cycle or exit to quiescence has until recently, been thought to occur only in G1 (Zetterberg et al., 1995).
However, single cell studies suggest the cell proliferation decision can occur during a window of G2 in the previous cell cycle in actively proliferating cells. Hitomi and Stacy first demonstrated that mitogen-induced Ras activity is required in G2 to complete the next cell cycle (Hitomi and Stacey, 1999). Spencer et al. subsequently explored this G2 mitogen requirement by removing mitogens from proliferating cultures during time lapse fluorescence microscopy (Spencer et al., 2013). They observed a large subpopulation of cell in mitosis or early G1 when the mitogens were withdrawn that were already committed to complete one more cell cycle.
A key component of this study was the use of a fluorescent fusion protein that responds to changes in Cdk2 activity, a Cdk2 “biosensor”. At the start of G1 (i.e. just after mitosis), new cells were either already on a trajectory to increase biosensor activity or they started G1 with measurably lower activity that remained low for many hours. Cells born with the already increasing kinase activity contained hyperphosphorylated Rb and were apparently irreversibly committed to completing the next cell cycle, even if mitogens were withdrawn or mitogen signaling was inhibited in early G1. Mitogen withdrawal, mitogen pathway inhibition or high levels of a Cdk2 inhibitor during the preceding G2 phase reduced biosensor activity in the subsequently-born daughter cells and blocked progression into S phase in the following cell cycle (though cells completed the ongoing G2, M phase, and cytokinesis). Conversely, cells born with naturally low Cdk2 activity entered a prolonged G1/G0-like state and required
occurring in the previous cell cycle. The low activity cells were interpreted as transiently exiting to quiescence and then re-entering the cell cycle at G1 whereas the high activity cells were pre-committed to finishing the next cell cycle.
Tracking cells from G2 through division and monitoring subpopulations in the next G1 was only possible by single cell analysis. Moreover live imaging of the fluorescent reporter in single cells revealed the two subpopulations of cells with different Cdk2 activity levels and subsequently different G1 phases. Interestingly, different cell lines had different relative
amounts of the two subpopulations; transformed cell lines had more of the increasing Cdk2 cells and non-transformed more of the low Cdk2 activity cells. These differences generally correlated with the propensity of the different cells to exit the cell cycle, a characteristic that varies with cell cycle and especially transformation status.
A second study by Naetar et al. supports the role for a Cdk2-driven G2 decision window committing cells to the next cell cycle (Naetar et al., 2014). These authors withdrew mitogens from cells that they had pre-synchronized in G2 and used flow cytometry to measure DNA synthesis in the following cell cycle to test commitment to the next cell cycle. Removing serum mitogens during G2 caused cell cycle exit in the following G1 as expected. However,
simultaneously inhibiting protein phosphatase 2A (PP2A) during the G2 mitogen withdrawal prevented cell cycle exit in the following G1. The cells committed irreversibly to completing the next cell division even though they entered G1 without mitogens present. Specific Cdk2 inhibition by chemical genetics or dominant-negative Ras expression coincident with PP2A inhibition during G2 mitogen withdrawal imposed the expected cell cycle exit in the following G1. It seems that G2 specific PP2A-dependent protein dephosphorylation of substrates
phosphorylated by Cdk2 and Ras-dependent kinases is required to re-establish mitogen
quiescent can occur during the previous cell cycle in a window of G2 receptive to mitogens. The notion that the events in the previous cell cycle control the outcome of the next cycle is a
relatively new concept in the field.
The notion that a G2 proliferation decision can produce distinct subpopulations of G1 cells with different molecular characteristics likely includes molecular distinctions beyond the activity of Cdk2 and its regulators. One possibility for an additional molecular distinction is the chromatin loading of replicative DNA helicases, known as Minichromosome maintenance complexes (MCM), to license DNA replication origins (Skarstad and Katayama, 2013; Remus and Diffley, 2009). MCM loading is restricted to G1 and thought to be largely irreversible in that the only mechanism known for MCM unloading occurs during replication completion itself. (Kuipers et al., 2011; Maric et al., 2014; Moreno et al., 2014). Therefore, differences in G2 proliferation decisions may be reflected in the kinetics or patterns of G1 MCM loading. In support of this idea Håland et al., using an innovative flow cytometry technique to measure protein chromatin association in single cells, compared the timing of MCM loading to the timing of Rb chromatin release (i.e. Rb hyperphosphorylation) (Håland et al., 2015). Cells re-entering G1 from G0 only loaded MCM complexes after Rb chromatin release (MCM loading only after the restriction point). On the other hand, cells entering G1 from a preceding mitosis were distributed into two populations: cells with loaded MCM before Rb chromatin release and cells with loaded MCMs after Rb chromatin release (MCM loading both before and after the
restriction point). The potential for cycling cells with two modes of MCM regulation in G1 is consistent with the idea of two populations after the G2 decision window.
an extended G1/G0 inactivated APCCdh1 with delayed and variable timing. Interestingly, the G1 subpopulation of G2 committed cells could be further divided into multiple smaller populations with variable responses to DNA damage, oxidative and osmotic stresses. We expect future single cell live cell imaging studies will discover even more unique subpopulations in many cell cycle phases (Darzynkiewicz et al., 2004).
Multiple proliferation decision points – multiple mechanisms?
The suggestion that mitogen-dependent proliferation commitments can occur in G2 rather than G1 raises new questions about the molecular mechanisms that drive proliferation decisions. Cell cycle commitments during both the G2 decision window and the G1 restriction point require mitogen signaling through the Ras GTPase pathway (Dobrowolski et al., 1994; Peeper et al., 1997; Mulcahy et al., 1985; Hitomi and Stacey, 1999), but what are the key
molecular targets of this pathway in either setting? Is Cyclin D/Cdk4 activity important for cells to commit to proliferation in G2? While the details of the G2 decision window are incompletely understood, we suggest that: (1): The G1 restriction point and the G2 decision window operate by related but not identical molecular mechanisms. (2): The G1 restriction point is most
important during the transition from G0 to cell cycle re-entry in G1, while the G2 decision window functions in continuously cycling cells. We also favor the idea that actively proliferating cells - especially non-transformed cells – can spontaneously and transiently divert to
quiescence, and that their eventual progression through G0/G1 requires passage through the same G1 restriction point as mitogen-starved and re-stimulated cells (Figure 2.3).
In cells re-entering G1 from quiescence, mitogen-dependent Cyclin D expression supports an Rb-E2F molecular state that is required, but not sufficient, for subsequent G1 progression. Progression from this permissive state past the G1 restriction point requires
Cdk2 activity by an as-yet unknown mechanism) are also important contributors to Cdk2 activation (McIntosh and Blow, 2012). In addition, Cdk2 is cytoplasmic in at least some quiescent cells which prevents it from acquiring an essential activating phosphorylation by a nuclear kinase (Nevis et al., 2009; Lunn et al., 2010). Mitogen-stimulated signaling causes Cdk2 to translocate to the nucleus for activation, but Cdk2 is constitutively nuclear and
phosphorylated in actively proliferating cells. Thus at least one additional requirement to activate Cdk2 in cells entering G1 from G0 is already met by cells entering G1 from the preceding cell cycle.
The Myc transcription factor also has different roles at the G1 and G2 proliferation decisions. For passage through the G1 restriction point, Ras-driven Myc accumulation regulates and cooperates with E2F transcriptional activity to control a suite of proliferation-related genes (Dong et al., 2014; Leung et al., 2008; Hölzel et al., 2001). For commitments made during G2 however, Myc is apparently important primarily for Cyclin E transcription, possibly to prime G2 cells for high Cyclin E/Cdk2 activity after mitosis (Naetar et al., 2014). Neither Cyclin D nor other E2F target genes including PCNA, CCNA2 (Cyclin A), and E2F1 are transcribed in G2 under the same conditions (Naetar et al., 2014). This observation suggests the G2 decision window, unlike the G1 restriction point during cell cycle re-entry, does not heavily rely on Rb-E2F control as a primary mechanism. Moreover cells lacking all three Rb family members, “triple knockout” mouse embryonic fibroblasts, require mitogen signaling in G2, but not G1, for proliferation (Foijer et al., 2005, 2008). We suggest that E2F transcription is not required in G2 for
commitment to the following cell cycle, but rather continues to promote cell cycle transcription in the following G1 in cells which are already committed to division.
Figure 2.3
Figure 2.3 Multiple proliferation decisions in actively dividing cells
(L’Italien et al., 2006). The precise downstream target(s) of Cdk mediating the G2 proliferation decision are not clear, but it does not appear to be E2F-stimulated transcription in G2 (Naetar et al., 2014). Spencer et al. provided evidence that an important determinant of high or low Cdk activity in G2 is the abundance of the CDK inhibitor, p21 (which is related to p27 but regulated by different mechanisms) (Spencer et al., 2013). Cells with high p21 and low Cdk activity in G2 entered a variable, but prolonged G1/G0-like state in the following cell cycle, and cycling cells lacking p21 altogether proliferated with high Cdk2 activity (Perucca et al., 2009; Spencer et al., 2013). The relative contributions of CDK inhibitors, kinase activity, and Rb-E2F-controlled transcription to the ultimate commitment to proliferation are likely influenced not only by the differences between mitogen signaling for cell cycle re-entry from quiescence and mitogen-dependent cell cycle progression in proliferating cells by also by cell type and cell context.
G2-committed cells consistently pass quickly through the subsequent short G1 phase (Naetar et al., 2014; Spencer et al., 2013). Interestingly, G1 length varies considerably between different human cell types in culture: human embryonic stem cells spend as little as 2-3 hours in G1 whereas many differentiated cell lines spend 12 hours or more in G1 (Kapinas et al., 2013). It is intriguing to speculate that in a population of cells with very short G1 lengths, all the cells make the proliferation commitment in the G2 decision window and never face the G1 restriction point. Both cancer cells with short G1 lengths and embryonic stem cells have high levels of CDK activity, which may guarantee consistent G2 commitment in nearly every cell cycle (Malumbres and Barbacid, 2001; Kapinas et al., 2013). Mutations that cause high CDK activity might dictate G2 commitment to the next cell cycle, and consequently a short G1 phase.
Outlook
microenvironments affect local proliferation signals. For example, the intestinal epithelium comprises a broad range of proliferative stem cells and differentiated cells that respond to diverse spatial signaling cues (Simons and Clevers, 2011). Understanding the behavior of a cell population requires a nuanced appreciation that each cell responds to intrinsic or extrinsic cues by shifting its probability of entering or exiting the cell cycle. Thus, statistical models that take these probabilities into account will be particularly useful predictive tools (Klein and Simons, 2011). Mathematical models of cell cycle transitions have been in development for several years, and the increasingly-sophisticated ability to acquire real-life parameters for molecular events using robust quantitative single cell approaches will both test and refine these models (Barr et al., 2016; Huard et al., 2012; Tyson and Novák, 2015; Weis et al., 2014).
One long-term goal held by many in the field is deep mechanistic understanding of proliferation decisions and the factors that affect the probabilities of progressing from G1 to S phase or exiting from G1 to quiescence. An important contributor to the achievement of that goal will be combinations of assays that reveal the relationships among molecular events and cell behaviors. For example, simultaneously tracking two or more biosensors in the same cell is the best way to determine the order of two events and if one is likely the cause of the other (Stewart-Ornstein and Lahav, 2016; Coleman et al., 2015; Cappell et al., 2016). Furthermore combining different types of single cell assays, such as live cell imaging of fluorescent
biosensors with single-cell transcriptomics or genomics, ties the recent molecular behavior of one cell with its later fate (Skinner et al., 2016; Toledo et al., 2013; Zhang and Pellman, 2015; Zhang et al., 2015). We anticipate that ongoing technological and conceptual breakthroughs will ultimately yield practical benefits such as precision cancer diagnoses and treatments,
CHAPTER 3: RAPID DNA REPLICATION ORIGIN LICENSING PROTECTS STEM CELL PLURIPOTENCY2
Introduction
Metazoan DNA replication requires initiation at thousands of DNA replication origins during S phase of every cell cycle. Origins are genomic loci where DNA helicases first unwind DNA and DNA synthesis begins. Origins are made competent for replication during G1 phase of each cell cycle by the loading of Minichromosome Maintenance (MCM) complexes onto DNA. MCM is the core component of the replicative helicase, and the process of MCM loading is termed origin licensing. Total MCM levels remain constant throughout the cell cycle, but the levels of DNA-loaded MCM change as cells progress through the cell cycle. Cells can begin MCM loading as early as telophase, and loading continues throughout G1 until the G1/S transition, the point of maximum DNA-loaded MCM(Kimura et al., 1994; Todorov et al., 1995). Throughout S phase, individual MCM complexes are activated for DNA unwinding as origins “fire”. MCM complexes travel with replication forks and are progressively unloaded as replication forks terminate (Figure 3.1A)(Deegan and Diffley, 2016; Remus and Diffley, 2009; Siddiqui et al., 2013).
The control of origin licensing is critical for genome stability. Origins must not be re-licensed after S phase begins because such re-licensing can cause a genotoxic phenomenon known as re-replication which may result in double strand breaks, gene amplification,
aneuploidy, and general genome instability(Arias and Walter, 2007; Truong and Wu, 2011). To
2Modified from: Matson, J. P., Dumitru, R., Coryell, P., Baxley, R. M., Chen, W., Twaroski, K., Webber, B. R., Tolar, J., Bielinsky, A.-K., Purvis, J. E. and Cook, J. G. (2017) ‘Rapid DNA replication origin licensing protects stem cell pluripotency’, eLife, 6, p. e30473. doi:
avoid re-replication, MCM loading is tightly restricted to G1 phase by multiple overlapping
mechanisms that destroy or inactivate MCM loading proteins to prevent any new origin licensing On the other hand, cells typically load 5-10-fold more MCM complexes in G1 than they strictly require under ideal circumstances, and the additional MCM loading ensures timely and
complete genome duplication even if replication hurdles are encountered in S phase (Ibarra et al., 2008; Woodward et al., 2006; Ge et al., 2007). It is possible for cells to proliferate with less than optimal MCM loading, but such cells are hypersensitive to DNA damage and replication stress(Blow et al., 2011; McIntosh and Blow, 2012).
MCM loading to license origins is restricted to G1, but G1 length varies widely among different cell types. For example, specialized developmental and immune cell cycles have minimal G1 lengths of mere minutes(O’Farrell et al., 2004; Kinjyo et al., 2015; Kermi et al., 2017). In cultured human embryonic stem cells, G1 is only 2-3 hours, and this short G1 is both a hallmark of and has been implicated in maintaining pluripotency(Soufi and Dalton, 2016; Kareta et al., 2015b). G1 lengthens early in differentiation, and in cultured somatic cells is often greater than 12 hours (Calder et al., 2013). Thus, different proliferating cells have drastically different amounts of time available to complete MCM loading before making the G1-to-S phase transition. In addition, pluripotent stem cells respond to differentiation stimuli specifically in G1 phase, suggesting that the balance among cell cycle phases influences differentiation
potential(Gonzales et al., 2015; Pauklin and Vallier, 2013).
Figure 3.1
Figure 3.1. Pluripotent stem cells load MCMs faster than differentiated cells.
(a) DNA-loaded MCM levels increase in G1 and decrease in S phase whereas total MCM protein levels are constant throughout the cell cycle.
(b) Flow cytometric analysis of DNA-loaded and total MCM in asynchronously proliferating RPE1-hTERT cells. Cell cycle phases are defined by DNA content and DNA synthesis. Left: Cells were labeled with EdU, extracted with nonionic detergent to remove unbound MCM, fixed, and stained with anti-MCM2 (a marker for the MCM2-7 complex), DAPI (total DNA), and for EdU incorporation (active DNA synthesis). Orange cells are S-phase with DNA-loaded MCM, blue cells are G1-phase with DNA-loaded MCM, and grey cells are G1/G2/M phase cells without DNA-loaded MCM. Right: Cells were treated as on the left except that they were fixed prior to extraction to detect total MCM2.
(c) T98G cells were synchronized in G0 by contact inhibition and serum deprivation, then released into G1 for 10 or 12 hrs, or re-synchronized in early S with hydroxyurea (HU), and released into S for 6 or 8 hrs. MCM3 in chromatin-enriched fractions (Loaded) or whole cell lysates (Total) was detected by immunoblotting.
(d) Chromatin flow cytometry of the indicated asynchronous cell lines measuring DNA content (DAPI), DNA synthesis (EdU incorporation), and loaded MCM (anti-MCM2). Blue Cells are G1-MCMDNA-positive and EdU-negative, orange are S phase-MCMDNA-positive; grey are G1/G2/M-MCMDNA-negative.
after S phase begins(Remus and Diffley, 2009; Arias and Walter, 2007; Truong and Wu, 2011). since many cancer cell lines also have short G1 phases. The actual rate of MCM loading in human cells has not yet been quantified however, and little is known about how the amount, rate or timing of MCM loading varies between cells with different G1 lengths. Here we utilized single cell flow cytometry to measure MCM loading rates in asynchronous populations of pluripotent and differentiated cells. We discovered that rapid MCM loading is intrinsic to
pluripotency, slows universally during differentiation, and rapid replication licensing suppresses differentiation. These findings demonstrate that the rate of MCM loading is subject to
developmental regulation, and we suggest that rapid origin licensing is a new hallmark of pluripotency.
Results
Pluripotent cells load MCM significantly faster than differentiated cells.
in S phase cells (“S-MCMDNA pos”). As expected, total MCM protein levels do not substantially change during the cell cycle (Figure 3.1B, right)(Todorov et al., 1995). For comparison to commonly used cell fractionation methods to assess MCM dynamics, we also probed
immunoblots of chromatin-enriched fractions, and noted a similar MCM expression, G1 loading, and S phase unloading pattern (Figure 3.1C)(Cook et al., 2002; Mendez and Stillman, 2000). Interestingly, individual G1 cells (blue stripe) have a very broad range of DNA-loaded MCM levels with a more than 100-fold difference between minimum and maximum (Figure 3.1B, left). MCMs are unloaded during S phase, ending in G2/M with undetectable MCM on DNA (Figure 3.1B, left). Moreover loaded MCM is resistant to extraction in high salt buffer which removes peripherally-bound chromatin proteins (Figure 3.3F-H), similar to yeast MCM complexes loaded in vitro (Bowers et al., 2004; Randell et al., 2006). We validated MCM2 antibody specificity using
quiescent G0 synchronized cells (MCM unloaded), and we also observed the same broad G1 signal distribution using MCM3 antibody (Figure 3.3A-D).
Loaded MCM complexes are extremely stable on DNA, both in vivo and in vitro(Cocker et al., 1996; Evrin et al., 2009; Remus et al., 2009; Bowers et al., 2004). In human cells, MCMs can persist on DNA for more than 24 hours during a cell cycle arrest and are typically only unloaded during S phase(Kuipers et al., 2011). These properties result in MCM loading that occurs unidirectionally throughout G1 phase(Symeonidou et al., 2013). The unidirectional nature of MCM loading means that G1 cells with low MCM levels are in early G1, and G1 cells with high MCM levels are in late G1. Since we observed a broad distribution of MCM loading throughout G1 including many cells with low levels of loaded MCM, we conclude that RPE1-hTERT cells load MCM relatively slowly during their ~9 hr G1.