Targeting the Triple-Negative Breast Cancer Kinome with Chemical Proteomics
Martin Charles Whittle
A dissertation submitted to the faculty of the University of North Carolina at Chapel Hill in partial fulfillment of the requirements for the degree of Doctor of Philosophy in the
Department of Pharmacology.
Chapel Hill 2013
Approved by:
ii ABSTRACT
MARTIN WHITTLE: Targeting the Triple-Negative Breast Cancer Kinome with Chemical Proteomics
(Under the direction of Dr. Gary Johnson)
Kinases are members of a large dynamic and cooperative signaling network, which senses inhibition of key nodal kinases and induces compensatory responses that offset pharmacological intervention. Combination therapies that target multiple growth- and survival promoting kinases are proving to be a better strategy for successful cancer therapy. What is lacking is the ability to measure whole kinome activity and to assess kinome adaptation and resistance to targeted therapies. We have developed a chemical proteomics approach that couples kinase affinity capture with quantitative mass
iii
triple-negative breast cancer was confirmed by the investigation of MEK inhibitor-treated patient samples from a window trial established in conjunction with GlaxoSmithKline. However, differential kinome responses were observed across intrinsic breast cancer subtypes, suggesting that broader approaches to targeting or preventing kinome
reprogramming may be necessary to avert resistance to kinase inhibitor therapies. The findings presented here define a novel approach to determining kinome-based
iv
TABLE OF CONTENTS
LIST OF TABLES ... vii
LIST OF FIGURES ... viii
LIST OF ABBREVIATIONS ... x
CHAPTERS I. INTRODUCTION ... 1
Breast cancer presentation and treatment ... 1
TNBC and intrinsic breast cancer subtypes ... 2
Targeting kinases for cancer therapy ... 4
Targeting the RAF-MEK-ERK pathway in breast cancer ... 7
Kinome resilience and adaptation to targeted inhibition ... 10
Application of chemical proteomics to study the kinome ... 15
Objectives of this project ... 18
II. MATERIALS AND METHODS ... 23
Chapter III ... 23
Chapter IV ... 33
Chapter V ... 35
III. Dynamic reprogramming of the kinome in response to targeted MEK inhibition in claudin-low triple negative breast cancer ... 42
Introduction ... 42
Results ... 43
Kinome profiling of TNBC... 43
v
MEK inhibition deregulates transcription, expression and
activation of RTKs ... 48
MEK-ERK inhibition induces c-MYC degradation leading to RTK reprogramming ... 50
RTK reprogramming rescues cells from AZD6244-induced growth arrest ... 52
AZD6244 in combination with RTK inhibitors ... 53
Kinome reprogramming in the C3Tag TNBC GEMM ... 54
Profiling kinome response to targeted combination therapies in the C3Tag mouse model of TNBC ... 54
AZD6244 plus sorafenib causes tumor regression ... 55
Discussion ... 56
IV. Investigating resistance to EGFR/HER2 inhibition in basal-like and other breast cancer subtypes ... 74
Introduction ... 71
Results ... 76
Defining EGFR expression and activity in TNBC ... 76
MIB/MS defines kinome response to EGFR inhibition ... 77
Mechanisms of reprogramming to EGFR inhibition ... 78
Targeting lapatinib-induced RTKs ... 80
Discussion ... 82
V. Triple-negative breast cancer exhibits subtype-specific kinome Reprogramming to targeted MEK inhibition... 89
Introduction ... 89
Results ... 90
Differential kinome reprogramming in response to MEK inhibition defines TNBC subtypes ... 90
vi
Enrichment of tumors with CL characteristics in response
to targeted kinase inhibition in C3Tag TNBC GEMM ... 94
The diversity of kinome reprogramming promotes escape from MEKi/sorafenib combination therapies ... 96
Targeted BRD4 inhibition blocks kinome reprogramming in BL and CL TNBC cells ... 97
Combination of JQ1 and GSK212 maintains growth inhibition and blocks MEKi-mediated selection of CL-reprogrammed cells ... 99
Discussion ... 100
VI. Significance and future directions ... 114
vii
LIST OF TABLES TABLE
3.1: MIB-based phosphoproteomics of RAF-MEK-ERK
pathway ... 64 3.2: Top 40 kinases expressed in patient claudin-low
viii
LIST OF FIGURES FIGURE
1.1: MEK/ERK signaling pathway ... 20
1.2: Mechanisms of resistance to kinase inhibitors ... 21
1.3: Chemical structures of MEK and EGFR inhibitors ... 22
2.1: Structures of bead-conjugated kinase inhibitors ... 41
3.1: Kinase capture of inhibitor beads ... 60
3.2: Strategy and characterization of MIBs ... 61
3.3: RAF-MEK-ERK pathway activation in TNBC ... 62
3.4: Profiling MEKi response in claudin-low TNBC ... 63
3.5: Defining a signature of kinome response to MEKi in claudin-low TNBC ... 65
3.6: Characterization of CL RTK response ... 67
3.7: Induced kinases are target-specific to MEKi ... 68
3.8: Defining mechanisms of MEKi response ... 69
3.9: Effects of drug removal or prolonged treatment on c-MYC and RTK reprogramming ... 70
3.10: Targeting induced RTKs ... 71
3.11: Kinome reprogramming in C3Tag GEMM... 72
3.12: AZD6244/sorafenib combination produces synergistic effects in C3Tag mice ... 73
4.1: Characterization of pEGFR in TNBC ... 85
4.2: MIB/MS defines kinome response to EGFR inhibition ... 86
4.3: Investigating mechanisms of kinome reprogramming in HCC1806 ... 87
4.4: Targeting lapatinib-induced RTKs in HCC1806 ... 88
ix
5.2: Kinome reprogramming in patient window trial for TNBC ... 105 5.3: Distinct responses within heterogeneous cell populations ... 106 5.4: Prolonged MEKi treatment of BL/CL heterogeneous cell
line selects for CL reprogrammed cells ... 107 5.5: Treatment of C3Tag mice with MEK inhibitor enriches
tumors with claudin-low characteristics ... 108 5.6: Diversity of kinase activation in response to MEKi protects
C3Tag tumors from dual agent combination therapies ... 109 5.7: Inability of TKIs to prevent MEK/ERK reactivation ... 110 5.8: Targeted BRD4 inhibition prevents MEKi mediated
kinome reprogramming in BL and CL TNBC ... 111 5.9: Combination of GSK212 and JQ1 promotes stable
x
LIST OF ABBREVIATIONS ATP: Adenosine triphosphate
BL: Basal-like CL: Claudin-low
CML: Chronic myeloid leukemia
EGFR: Epidermal growth factor receptor EMT: Epithelial to mesenchymal transition ER: Estrogen receptor
FDA: Food and drug administration GBM: Glioblastoma multiforma
GEMM: Genetically engineered mouse model LC: Liquid chromatography
MALDI: Matrix-assisted laser desorption ionization MAP2K: Mitogen activated protein kinase kinase
MAP3K: Mitogen activated protein kinase kinase kinase MAPK: Mitogen activated protein kinase
MEK: MAPK/ERK kinase MEKi: MEK inhibitor
MIB/MS: MIBs and mass spectrometry MIBs: Multiplexed inhibitor beads MRM: Multiple reaction monitoring MS: Mass spectrometry
mTORC1: Mammalian target of rapamycin complex 1 NSCLC: Non-small cell lung cancer
xi
qRT-PCR: Quantitative real-time polymerase chain reaction RNA: Ribonucleic acid
RNAi: RNA interference RTK: Receptor tyrosine kinase SFK: Src-family kinase
TK: Tyrosine kinase
TKI: Tyrosine kinase inhibitor
TNBC: Triple-negative breast cancer TOF: Time of flight
I. INTRODUCTION
Breast cancer presentation and treatment
Breast cancer is a global health concern that accounts for approximately 29% of cancer diagnoses and 14% of cancer deaths in women each year, and is the most prevalent and second deadliest form of cancer in women1. Greater than 40,000 breast cancer-related deaths in the United States are expected during the year 2013 alone, despite improvements in early detection and treatment options contributing to a steady decline in US breast cancer mortality rates since 1989. Not surprisingly, the largest factor contributing to long-term survival of breast cancer patients is the tumor stage at diagnosis. Patients presenting with localized disease have a 5-year survival rate of 99%, compared to a 23% 5-year survival of patients presenting with distant metastases2. The majority (60%) of patients are diagnosed with localized diseased, 33% show
regional cancer cell invasion, and 5% of patients present with metastatic disease (2% are unstaged). Treatment options vary depending on stage at presentation and tumor subtypes, but a combination of surgery and adjuvant chemotherapy and/or radiation therapy is common as a first line for breast cancer treatment3. Targeted systemic therapies that inhibit specific growth- and survival-promoting molecular targets provide another course of therapy where surgery/chemotherapy is unlikely to succeed.
Several targeted therapies have been approved by the Food and Drug Administration (FDA) for use in the treatment of breast cancer, most of which target either HER2, estrogen receptorα/β (ER), or aromatase (which is responsible for estrogen
2
expression of HER2 or hormone receptor (ER/progesterone receptor (PR)). Triple-negative breast cancers (TNBC), which comprise approximately 15% of all breast
cancers, are ER-negative, PR-negative, and lack HER2 overexpression, and thus do not respond to HER2-targeted or hormonal therapy4–6. While TNBCs are often initially sensitive to chemotherapy, tumors almost invariably reappear with a more aggressive phenotype that is resistant to further treatment7. A poor understanding of the oncogenic drivers and resistance mechanisms in TNBC has hindered the development and
approval of molecularly targeted therapies in this setting, leaving few options to combat TNBC after the failure of chemotherapy.
TNBC and intrinsic breast cancer subtypes
While the term “triple-negative” is clinically convenient, a more accurate
classification of breast cancer is provided by gene expression analysis, which shows a clear demarcation of five intrinsic subtypes of breast cancer across a large array of patient tumors8. HER2-enrichment defines one subtype, and hormone receptor positive breast cancers are predominantly classified into the luminal A and luminal B subtypes. The vast majority of TNBCs cluster distinctly into either the basal-like (BL) or claudin-low (CL) subtypes, which comprise 11-23% and 7-11% of breast cancers, respectively8. Despite sharing negativity for HER2, PR, and ER, distinct genetic signatures
discriminate basal-like cancers from claudin-low. Particular differences can be observed in the expression of cell signaling mediators, such as kinases and their regulators, suggesting an intrinsic divergence in growth and survival signaling. For instance, expression of the receptor tyrosine kinases (RTKs) VEGFR2, PDGFRβ, DDR2 or AXL
are significantly associated with claudin-low cell lines and tumors as compared to basal-like TNBC8.
3
cancer differentiation that parallels normal mammary development, where claudin-low cancers precede basal-like cancers as the least differentiated of breast cancer
subtypes9. Overall, claudin-low tumors and cell lines exhibit mesenchymal and stem-like gene expression patterns, whereas basal-like breast cancers are more differentiated and express epithelial markers8,9. The claudin-low subtype is also highly enriched for breast cancers having the CD44+/CD24-/low gene signature that is characteristic of
drug-resistant tumor-initiating cells10. The acquisition of claudin-low mesenchymal characteristics may result from an epithelial to mesenchymal transition (EMT), an important developmental process which can be reactivated in cancer cells to promote cell invasiveness, motility, stemness, and drug resistance11. With increased drug resistance provided by the claudin-low phenotype, treatment of patient tumors with hormone therapy or chemotherapy can select for claudin-low cancer cells from a heterogeneous tumor environment, leading to the outgrowth of aggressive claudin-low cancers from previously basal, luminal, or HER2-amplified breast cancers10,12.
4 Targeting kinases for cancer therapy
The human kinome consists of 518 protein kinases that mediate cellular signal transduction by catalyzing reversible and site-specific phosphorylation of diverse protein substrates. As one of the largest enzyme classes, encompassing 1.7% of the human genome, kinases collectively phosphorylate an estimated one-third of all proteins14,15. Phosphorylation on serine, threonine, or tyrosine residues can cause a shift in substrate conformation, often triggering biochemical changes to such properties as localization, protein interactions, or activity of the substrate. This process is reversed by protein phosphatases, which catalyze the hydrolysis of phosphoryl groups from amino acid residues. The kinase domain, which is well-conserved across distinct kinase families, is folded into an N-terminal and C-terminal lobe. ATP binds with varying affinities (KmATP
ranging from ~1-1000 nM for different kinases) in a pocket between the two lobes, and is coordinated by several highly conserved residues. Among these, a glutamate residue (Glu91 for PKA) that lies on the so-called α-C helix (within the N-lobe) functions as an ion pair with a critical N-lobe lysine (PKA Lys72) that coordinates the α and β
phosphates of ATP16. Conformational changes to the α-C helix can affect ATP binding and thus kinase activity. For many kinases, enzymatic activity is largely contingent upon the phosphorylation state of a conserved activation segment that runs across the cleft between the lobes, termed the activation loop17. Phosphorylation on this loop, by autocatalysis or a separate regulatory kinase, can increase kinase activity through conformational shifts that augment substrate and/or ATP binding18–20. When the activation loop is properly oriented to allow substrate and ATP binding, transfer of the
-phosphate of ATP to the substrate serine, threonine, or tyrosine residue is stabilized by divalent cations (themselves coordinated by several conserved asparagine and
aspartate residues) that serve as cofactors in the phosphoryl transfer reaction.
5
of new treatment strategies across a wide range of cancer types. Greater than 15 small molecule and antibody inhibitors against kinases have been approved by the FDA for cancer therapy, with many more in the developmental pipeline. The majority of these approved inhibitors target RTKs due to the common occurrence of aberrant RTK
signaling in many cancers. Most small molecule kinase inhibitors compete with ATP for the conserved ATP-binding cleft between lobes of the kinase domain. ATP-competitive kinase inhibitors that preferentially bind the activated kinase conformation are classified as type I kinase inhibitors, which are usually identified by functional assays using activated kinases and mimic ATP by interacting with similar residues within the kinase domain13. Type II kinase inhibitors, such as the HER2/EGFR inhibitor lapatinib, additionally bind to a hydrophobic pocket adjacent to the ATP-binding cleft and are indirectly competitive with ATP in that they bind and stabilize an inactive kinase conformation (DFG-out) that has a lower affinity for ATP21. Kinase inhibitors can also bind allosterically, at sites distant from the ATP-binding pocket, inducing conformational changes and/or blocking oligomerization to render the kinase inactive. Allosteric
inhibitors are classified as type III, and are usually highly specific because they bind outside the conserved kinase ATP-binding pocket and at regions that may be more unique to the targeted kinase, although few examples exist. The MEK1/2 inhibitor AZD6244 is an example of a type III kinase inhibitor.
6
instances where cancer cell growth and survival hinges upon constitutive kinase activity, small molecule inhibition of the activated kinase is often an effective course of therapy. For instance, targeting the BCR-ABL fusion protein that characterizes chronic
myelogenous leukemia (CML) with small molecule inhibitors (i.e. imatinib, nilotinib) strongly suppresses cancer cell proliferation and leads to remission in a majority of CML patients22. Additionally, targeting HER2 with lapatinib and/or trastuzumab has increased disease-free and overall survival in the setting of HER2-amplified breast cancer23. Despite the critical role of kinases in mediating cancer signal transduction, much of the kinome is virtually unstudied and many kinases lack targeted inhibitors24.
Oncogenic growth signaling often begins with aberrant expression and/or
activation of RTKs at the cell surface. RTKs are generally composed of an extracellular ligand-binding domain with specificity towards external growth factors and cytokines, a transmembrane domain and intracellular tyrosine kinase domain. Ligand binding commonly induces homodimerization or heterodimerization of the receptor, whereupon conformational shifts allow transphosphorylation of receptors at multiple tyrosine residues, often including the activation loop. Phosphotyrosine residues on RTKs are subsequently recognized by a wide array of proteins with conserved phosphotyrosine-binding domains (such as the SH2 domain) that directly mediate intracellular signaling or serve as adaptors for other signaling effectors. Specificity of the recruited proteins depends upon the protein sequence on the C-terminal side of the tyrosine
phosphorylation, thus providing distinction to the signaling pathways activated by each phosphorylation site and receptor25. For example, activation of the RTK EGFR begins by binding of its cognate ligands (EGF, TGFα or amphiregulin), followed by
7
residues on each receptor. Phosphorylation of EGFR on Y1068 leads to recruitment of GRB2, which serves as an adaptor to recruit the Ras guanine nucleotide exchange factor SOS to the membrane. SOS subsequently interacts with membrane-bound Ras to promote GTP binding and Ras activation. Similarly, phosphorylation of HER3 at Y1289 recruits the p85 subunit of PI3K, bringing along the catalytic p110 subunit to the membrane and in close proximity to its phosphoinositol substrates. In cancer,
constitutive activation of EGFR and/or other RTKs causes hyperactivation of these and other growth signaling pathways.
Targeting the RAF-MEK-ERK pathway in breast cancer
Oncogenic tyrosine kinases (TKs) and RTKs often feature as drivers of
tumorigenesis and tumor progression, but the prominent role of activated ERK signaling in cancer cell growth and survival has made the RAF-MEK-ERK axis a major focus for targeted cancer therapies downstream of RTKs. This pathway is a canonical mitogen-activated protein kinase (MAPK) pathway that relays proliferation signals from upstream RTKs/Ras to the nucleus, where ERK1/2 (the terminal MAPKs) act on a wide array of transcription factors to promote proliferation and survival (Figure 1.1). The RAF-MEK-ERK pathway is hyperactivated in most cancers, often occurring through
8
dimerize to phosphorylate cytoplasmic substrates or translocate to the nucleus as monomers to phosphorylate nuclear targets26. While the substrates of MEK1/2 are essentially confined to ERK1/2, over 160 substrates (predominantly nuclear) have been identified for ERK1/2, including several well-known oncogenes (such as c-MYC) and tumor suppressors (such as BIM) that are phosphorylated by ERK1/2 to alter protein stability and/or function27. In the context of cancer cells, activated ERK1/2 promote cell cycle progression and evasion of apoptosis by acting on such substrates, although in the context of untransformed primary cells hyperactivation of ERK1/2 can lead to oncogene-induced senescence through ERK1/2-mediated activation of p38 MAPK28. Very little is known about the unique substrates and roles of MEK and ERK paralogs, largely due to high homology and the lack of reagents to discern between their phosphorylation and/or activity.
An array of targeted therapeutics has been developed against RAF-MEK-ERK pathway components. Vemurafenib and dabrafenib, ATP-competitive inhibitors targeting mutant BRAF(V600E), yield a striking regression of metastatic melanoma harboring mutant BRAF before an invariable resistance and tumor reemergence29–31. Targeting wildtype RAF with small molecule inhibitors leads to paradoxical activation of RAF due to drug-induced dimerization, causing concern for the applicability of RAF inhibitors to treat diverse cancer types. In this light, MEK is considered a more broadly targetable
20-9
fold, suggesting that activated upstream signaling may promote resistance to MEK1/2 inhibitors by reducing drug potency33. Other allosteric MEK1/2 inhibitors have
recapitulated such phosphorylation-dependent affinity for MEK34. A highly selective ATP-competitive ERK1/2 inhibitor, SCH772984, is also under development at Merck that shows promise for the treatment of melanoma and colorectal cancer cell lines with acquired resistance to RAF and/or MEK inhibitors35. The ability to target multiple kinases in this pathway may be important to prevent reactivation of RAF/MEK/ERK signaling and drug resistance36.
Many studies have highlighted the importance of the RAF-MEK-ERK pathway in cell proliferation and survival of breast cancer. Expression and activation of MAPK pathway components are significantly higher in breast tumor samples compared to matched normal tissue, validating this pathway as a target in breast cancer37–39. In vitro studies have shown that treatment of various breast cancer cell lines with the MEKi U0126 slows proliferation, increases apoptosis and sensitizes cells to anoikis40,41. Interestingly, basal-like TNBC cell lines generally exhibit greater sensitivity to MEKi compared to luminal or HER2-amplified breast cancer lines (claudin-low not considered), possibly due to greater activation of RAS/RAF/MEK pathway signaling in this subtype42–
44
. Expression of the ERK phosphatase DUSP6 also contributes strongly to MEKi sensitivity, and expression of a related ERK phosphatase, DUSP4, leads to reduced ERK activity and improved outcomes after neoadjuvant chemotherapy in basal-like breast cancer patients43,45. Studies by Balko, et al. and MacKeigan, et al. have further revealed that the addition of MEKi to taxol-based chemotherapeutics causes synergistic induction of apoptosis in breast cancer cell lines and tumors45,46.
Despite the apparent importance of RAF/MEK/ERK activity in breast cancer, clinical trials with single-agent MEK inhibitors have so far yielded disappointing
10
is likely that tumor cells also develop resistance to MEK inhibitors through other mechanisms of pathway reactivation49,50. Phosphorylation of MEK1/2 by upstream kinases leading to reduced MEKi affinity could theoretically contribute to intrinsic MEKi resistance, leading to reduced efficacy of single-agent MEKi treatments. Thus,
activation of alternative kinases, both upstream and/or parallel to the RAF/MEK/ERK pathway, may sustain cancer cell growth/survival in the presence of MEKi. In support of this, combination therapies with MEK inhibitors have shown promise in preclinical cancer models51. These studies make it clear that greater understanding of the mechanisms behind MEKi resistance is needed for the development of efficacious MEKi-based therapies to treat breast and other cancers.
Kinome resilience and adaptation to targeted inhibition
Though kinases are often studied singularly or as members of linear pathways, kinases integrate into convoluted signaling cascades and networks that relay and
integrate diverse cell signals. RAF-MEK-ERK signaling exemplifies this plasticity, where pathway activity is modified by diverse upstream kinases, phosphatases responsive to pathway activity, and internal feedback phosphorylation on RAF and MEK1 (from MEK and ERK, respectively). Unfortunately, this resiliency of the kinome has made single-agent kinase inhibitor cancer treatment extremely difficult. Mutation at a conserved “gatekeeper” residue in the ATP binding pocket (such as T790M in EGFR) can provide
drug resistance by sterically hindering drug binding, making the mutant kinase
insensitive to previously effective drug doses52. Cancer cells can circumvent targeted kinase inhibition to reactivate growth signaling through such mutations and/or
amplification of the targeted kinase, activation of alternative pathways, or pathway reactivation through other methods (Figure 1.2)53. Such diverse mechanisms of
11
A prominent example of kinase inhibitor resistance is seen in malignant melanomas, where oncogenic mutation in the kinase BRAF are common54. The most frequent BRAF mutation in melanoma is the V600E mutation and this primarily results in chronic activation of the MEK/ERK pathway to promote cell growth. Consequently, small molecule inhibitors of mutant RAF are attractive therapeutics for the treatment of
melanoma and other RAF-driven cancers55. Interestingly, multiple studies uncovered a surprising paradoxical resistance of RAF kinase signaling to select RAF inhibitors56–58. RAF kinase inhibitors (PLX4720, sorafenib and 885-A), while highly effective at inhibiting mutant BRAF, activated wild-type RAF through inhibitor-mediated dimerization57. This compensatory activation is dependent on inhibitor binding to the ATP site of one RAF molecule, which stimulates dimerization and activation of the drug-free RAF protomer. Thus, despite efficacy at inhibiting mutant BRAF in tumors, RAF inhibitors pose a risk of enhancing Ras-dependent tumors through activation of wild-type RAF. Moreover, N-Ras mutation or up-regulated PDGFRβ expression were also shown to accompany the
resistance of cells to PLX403254. As suggested from these findings, strategies to co-target both RAF and MEK simultaneously have demonstrated improved growth inhibition and suppression of RAF-MEK-ERK pathway activation and prolonged disease-free survival in patients49,59–61. Other groups have shown that combining MEK and/or PI3K/mTOR prevented the acquired resistance to the BRAF inhibitor GSK2118436, suggesting that co-targeting these two pathways is also a viable strategy62,63. While such studies provide an important cautionary example of the unexpected changes in the kinome in response to single kinase inhibitors, they also illustrate the importance of elucidating kinome responses to select inhibitors.
12
relieves feedback regulation of IGF1R, thereby triggering a compensatory activation of IGF1R and AKT targets such as the transcription factor FOXO65,66. Furthermore,
Chandarlapaty et al. showed that inhibition of PI3K/AKT relieved feedback inhibition and increased the expression of a unique set of receptor tyrosine kinases including HER3, IGF1R and INSR67. In addition to expression, the phosphorylation of multiple RTKs was also stimulated by AKT inhibition. Treatment of cells with AKT inhibitors resulted in up-regulation of RTK transcripts in a FOXO-dependent manner. Given the significance of this RTK response, the authors tested the combination of HER kinase inhibitors
(lapatinib and Iressa) with AKT inhibitors in xenograft models and showed that the combination of these inhibitors was highly effective at inhibiting tumor growth.
Chakrabarty et al. also showed that inhibition of PI3K with the small molecule inhibitor XL147 upregulated the expression and activation of multiple RTKs, including HER3, in a manner dependent on HER268. Again, co-targeting the RTK response with trastuzumab or lapatinib was synergistic at inhibiting growth, compared with the action of these inhibitors alone. These studies exemplify the importance of elucidating the kinome feedback mechanisms and understanding their implications for successful therapeutic applications.
Activation or mutation of the EGFR and downstream kinase pathways is common in glioblastoma multiforma (GBM), colorectal cancer, non-small-cell lung carcinoma (NSCLC) and TNBC69. This is often a result of EGFR mutations or overexpression, hence EGFR inhibitors have been investigated as possible therapeutics in these
13
observed in 15–22% of NSCLC patient’s tumors that were resistant to EGFR
inhibitors72,73. Multiple lines of evidence suggest that activated MET can compensate for EGFR inhibition by partially protecting against loss of phospho-EGFR and contributing to sustained activation of downstream growth signaling through ERK and AKT. A direct association between EGFR and MET has been observed, although it is unclear how this heterodimerization contributes to EGFR inhibitor resistance74. In such cases where MET is induced as a mechanism of EGFR inhibitor resistance, cotreatment with EGFR and MET inhibitors synergistically inhibited proliferation of cell lines, prevented tumor growth, and induced apoptosis in cell and tumor models. Similar studies demonstrate the remarkable plasticity of MET signaling in response to expression of EFGR mutations (de2-7 EGFR) in GBM75. While it has been shown that EGFR inhibitor treatment can select for cells with pre-existing MET amplification, it is also evident that loss of EGFR activity can rapidly induce compensatory expression/activation of MET and other tyrosine kinases, including FGFR2 and Src-family kinases (SFKs)76–79. This induced kinase activity is independent of genetic mutation or amplification, and likely results, in part, from loss of negative-feedback regulation of suppressed kinases. Additionally, acute loss of upstream kinase signaling can trigger changes in transcription factor stability and/or activity that lead to induced expression of RTKs and their ligands. This was exemplified by Ware et al., who defined loss of ERK activity downstream of EGFR inhibition as causal in de-repression of FGFR2/3 expression in NSCLC cell lines77.
14
synergistic tumor inhibition in preclinical models and doubles the pathological complete response rate (pCR) to approximately 40% prior to surgery83. However, this translates to only a 5-month improvement to median overall survival, sparking several studies to understand why near-complete inhibition of HER2, considered to be the major driver in these cancers, yields only a modest tumor response in vivo84. One major mechanism of HER2-inhibitor resistance that has been characterized is upregulated expression and activation of other HER-family members such as EGFR and HER385,86. Increases in HER3 mRNA transcript, protein abundance and protein phosphorylation can be observed within 48h of lapatinib treatment of HER2-amplified SKBR3 cells87. This resulted from loss of AKT-mediated negative feedback regulation, and constitutively active AKT prevented HER3 upregulation following HER2 inhibition. Increased expression of HER3, which is widely considered to be catalytically inactive, was
proposed to enhance HER2-HER3 dimerization to mediate allosteric activation of HER2 and subsequent reactivation of ERK and AKT. This mechanism suggests that minimal residual HER2 activity may be sufficient to allow escape from inhibition to redrive growth signaling pathways, especially where dose-limiting toxicities prevent absolute inhibition. These studies have led to the development of the monoclonal antibody pertuzumab, which binds the dimerization domain of HER2 to prevent receptor dimerization (unlike trastuzumab, which binds to prevent ligand-independent mitogenic signaling).
Combination of trastuzumab and pertuzumab was shown to synergistically inhibit tumor growth in preclinical models and provide a significant benefit for overall and disease-free survival in clinical trials88,89. The importance of HER-family reprogramming as a
15
simultaneously contribute to resistance to targeted inhibitors, highlighting the need to understand exactly how targeted inhibitors influence kinome signaling.
Such examples of kinome adaptation demonstrate the diverse mechanisms of plasticity and resistance in the kinome of tumor cells under the selective pressure of targeted kinase inhibitors. With most oncogenic RTKs driving cell growth through conserved kinase signaling pathways, there is a high potential for cancer cells to circumvent targeted kinase inhibition by induced expression or activity of alternative kinases. The high plasticity and resiliency of the kinome suggests that drug
combinations targeting multiple kinase signaling pathways or nodes may be a more effective strategy to treat cancers driven by aberrant kinase signaling94. Anticipating the mechanisms of drug response in cancer cells will help to prevent the persistence and selection of resistant populations from a heterogeneous tumor environment95. Taken together, these studies highlight the need for standard methods to study kinome network signaling in the context of drug response and resistance.
Application of chemical proteomics to study the kinome
The philosophy of studying the kinome as a network of kinases or ‘kinomics’ was
16
70% of the total kinome (370/518) is expressed in typical breast cancer cell lines100,101. Other studies performed extensive profiling of expressed kinases in a large numbers of tissues or specific cancers102,103.
Despite this information, important questions remain. For instance, how many of these kinases are active and how does the activity of the kinome change in response to different stimuli or inhibitors? Moreover, how does one study the untargeted or
understudied members of the kinome where well-characterized reagents are lacking? Increasing evidence of kinome plasticity as a mechanism of drug resistance has made understanding kinome network signaling a priority for cancer research. Fortunately, advances in kinase enrichment and proteomics have greatly facilitated the ability to study the kinome at the protein level104. On the basis of the original method of Haystead et al. using -phosphoryl-linked ATP affinity columns to capture kinases, Knockaert et al.
were the first to demonstrate the utility of immobilized kinase inhibitors105–107. Daub and co-workers refined this approach by using a broad range of immobilized kinase inhibitors coupled to Sepharose beads108. An inherent advantage of the latter approach is the nanomolar affinity binding of kinases to the inhibitor beads, thereby permitting efficient capture of a large fraction of the kinome. In addition, by increasing the variety of the coupled inhibitors, a greater diversity of kinases could be captured109.
Initially this technology was used to profile kinase inhibitor selectivity and identify new cellular targets for select kinase inhibitors such as SB203580, gefitinib, SU6668 and others110–113. Termed ‘kino-beads’, this method was commercialized (Axxima, Cellzome, Ambit) and broadly applied to assess kinase inhibitor specificity across the kinome
109,114–117. For example, Bantscheff et al. performed quantitative analysis of the kinase
17
affinity of 38 kinase inhibitors across a panel of 317 kinases117. Importantly these papers marked some of the first studies to evaluate the specificity of structurally distinct
inhibitors against large numbers of kinases. The results of these and other studies demonstrated exquisite specificity for some inhibitors (lapatinib), whereas others (staurosporine, sunitinib, lestaurtanib and dasatinib) lacked specificity and bound many kinases from various kinase families117,120. More recent studies expanded this
technology to profile changes in the kinome itself. Multiple investigators have used this strategy to demonstrate cell-type-specific sets of expressed kinomes using the
immobilized inhibitors combined with LC (liquid chromatography)-MS/MS (tandem MS), phosphoproteomics analysis and quantitative MS115,121,122. In an interesting application, Daub et al. used this approach to profile the change in the kinome from S- and M-phase-arrested cells123. Specifically, the authors quantified over 219 kinases, detecting over 1000 phosphorylation sites (including activation loops) and identifying multiple kinases not previously associated with mitotic progression. It has further been shown that activated kinases bind with higher affinity to type I inhibitor beads (compared to
analogous inactive conformations), likely due to greater accessibility of the ATP-binding pocket in the active conformation and the use of activated kinases in the development of type I kinase inhibitors116. Taken together, these data suggest that immobilized kinase inhibitors may be used as a platform to profile kinome expression and activity.
Importantly, these recently developed technologies for kinome enrichment and characterization could be applied as a discovery mechanism to define the dynamic activity of the kinome in response to inhibitors. Typically studies of kinome adaptation have relied on immunoblotting of select kinases or the use of phosphoantibody arrays to assess kinome changes124. However, these methods are limited by phosphoantibody availability and specificity, and therefore limit the scale of analysis. Affinity
18
spectrometry allows for a more unbiased assessment of changes in kinase expression and activity after drug treatment. A major application of this technique would be to define mechanisms of adaptive resistance from the kinome reprogramming response, providing a method for the rational design of inhibitor combinations with greater efficacy for cancer treatment.
Objectives for this project
Currently, there are no standard methods for the rational design of targeted inhibitor combinations for cancer treatment. Our first goal for this project was to design a method to systematically measure the kinome response to small molecule inhibitors (kinome reprogramming) in triple-negative breast cancer. A precedent for the use of chemical proteomics for kinase enrichment and analysis of drug specificity or kinase expression has been established, but these techniques have not been applied to define drug-induced changes in kinome expression/activity. We hypothesized that a chemical proteomic approach using immobilized kinase inhibitors can define novel kinase targets that are induced by the treatment of small-molecule inhibitors to MEK1/2 or HER2/EGFR (Figures 1.3A,B), which represent potentially important kinase targets in TNBC.
Characterization of our multiplexed inhibitor-bead (MIB) strategy with mass spectrometry revealed substantial coverage of the expressed kinome across diverse kinase families. Basal-like and claudin-low TNBC subtypes were assessed individually, as the differential gene expression patterns indicated the likelihood of distinct kinome responses to
targeted inhibitors. The kinome reprogramming to diverse inhibitors was measured in order to define target-specific reprogramming events. We also sought to define the mechanisms behind induced drug-induced kinase expression and activity.
19
20
21
Figure 1.2 Mechanisms of resistance to kinase inhibitors. Demonstration of diverse mechanisms of resistance to kinase inhibitors is shown. Kinase inhibitors (shown in blue) can be bypassed by mutation of gatekeeper and other residues,
22
II. MATERIALS AND METHODS
Chapter III Cell culture
HuMEC cells were grown in 5% FBS with HuMEC supplements. MDA-MB-231 and T2-C3Tag cells were grown in DMEM/F12 supplemented with 10% FBS. SUM159 cells were grown in DMEM/F12 supplemented with 5% FBS, 1 µg/ml hydrocortisone and 5 µg/ml insulin. MYL CML cells were cultured in RPMI 1640 medium supplemented with 10% fetal bovine serum and 1% antibiotic/antimycotic. SUM159-R cells were continually grown in the presence of 5 µM AZD6244. For SILAC labeling, cells were grown for five doublings in arginine- and lysine-depleted media (as above) supplemented with either unlabeled L-arginine (42 mg/L) and L-lysine (71 mg/L) or equimolar amounts of [13C6,15N4]arginine (Arg10) and [13C6]lysine (Lys6) (Cambridge Isotope Laboratories).
Proliferation was quantified by Cell-Titer Glo Luminescent Cell Viability Assay (Promega). Media containing kinase inhibitors was replaced daily.
Multiplexed inhibitor bead affinity chromatography
24
(approximately 20-40 mg of protein per experiment) was brought to 1M NaCl and pre-cleared by flowing over 500 µl of blocked and washed NHS-activated Sepharose 4 Fast Flow beads (GE Healthcare). The flow-through was collected and passed through a column of layered inhibitor-conjugated beads (Bisindoylmaleimide-X (50 µl), SB203580 (50 µl), lapatinib (100 µl), dasatinib (100 µl), purvalanol B (100 µl), VI16832 (100 µl), PP58 (100 µl)) to isolate protein kinases from the lysates. Kinase-bound inhibitor beads were washed with 20 ml of high-salt buffer and 10 ml of low-salt buffer, each containing 50 mM HEPES (pH 7.5), 0.5% Triton X-100, 1 mM EDTA, 1 mM EGTA, and 10 mM sodium fluoride, and 1M NaCl or 150 mM NaCl, respectively. A final wash of 1 ml 0.1% SDS was applied to the columns before elution in 1 ml of a 0.5% SDS solution in high heat. Elutions from all columns were combined and cysteines were alkylated by sequential incubations with DTT (final concentration 5 mM) for 20 min at 60° C and iodoacetamide (final concentration 20 mM) for 30 min at room temperature in the dark. The elution was spin-concentrated to 100 µl and detergents were removed by a
25
room temperature in the dark. Peptides were fractionated with Mini SCX Spin Columns and cleaned with PepClean C18 Spin Columns (Thermo Scientific) before separation by a Tempo LC MALDI Spotting System.
MS analysis
MS and MS/MS data were acquired with a MALDI TOF/TOF 5800 (ABSCIEX) and analyzed by ProteinPilot Software Version 3.0 (ABSCIEX) with a UniProtKB/Swiss-Prot database. UniProtKB/Swiss-Proteins were accepted when ≥1 unique peptide was identified at 99%
confidence. Peptide quantitation by ProteinPilot was performed using the Pro Group Algorithm and quant ratios are bias-corrected. MIB/MS analysis with cell lines was done in 2-3 independent experiments. A set of 3 independent experiments using SILAC labeled SUM159 cells treated with AZD6244 or DMSO was used to assess statistical significance and reproducibility of MIB/MS.
qRT-PCR
RNA was isolated from cell lines or murine tumors using the RNeasy® Plus Mini Kit (Qiagen). qRT-PCR was performed on diluted cDNA with the Applied Biosystems 7500 Fast Real-Time PCR System and inventoried TaqMan® Gene Expression Assays.
In vivo tumorigenesis experiments
26
calculated using (Final volume – Initial Volume)/Initial Volume and graphed using R
(http://www.r-project.org/). Tumors at harvest were halved and either snap-frozen in liquid nitrogen and stored at -80C or placed in neutral buffered 10% formalin solution.
Human breast tissue procurement
All human breast tissue was obtained from the Tissue Procurement Facility in compliance with the laws and institutional guidelines as approved by the UNC IRB committee. Clinical specimens were phenotyped by gene expression analysis in the lab of Chuck Perou.
Generation of immortalized T2-C3Tag cell line from a C3Tag tumor
An autochthonous tumor from a C3Tag mouse was excised and dissociated in a sterile fashion in the presence of 0.25% trypsin (Gibco). Cells were then passed through a 40 micron cell strainer and grown in the presence of DMEM + 10% FBS. Cells were isolated and expression of SV40T antigen verified by immunoblotting with antibodies specific to SV40 large T (EMD Biosciences, monoclonal, clone PAb416).
Compounds
Sorafenib and U0126 were purchased from LC Labs. BEZ235 was purchased from Selleck; bisindoylmaleimide-X was from Alexis and purvalanol B was from Tocris. GSK3 Inhibitor X was obtained from Calbiochem. Foretinib and AZD6244 were
synthesized according to the procedures described in two patent applications (WO2005030140A2, WO2007002157A2). PP58, VI16832, dasatinib, lapatinib,
27 RNA sequencing
Polyadenylated (poly-A) mRNA was isolated from 10 µg total RNA using Dynal oligo(dT) beads (Invitrogen). Poly-A mRNA was fragmented for five minutes at 70C
using Fragmentation buffer from Ambion. First strand cDNA synthesis used random hexamer primers and SuperScriptII (Invitrogen). Second strand cDNA synthesis was performed using DNApolI (Invitrogen) and was purified using QIAquick PCR spin columns (Qiagen). Library preparation was performed according to manufacturer’s
instructions (Illumina).
RNA-seq alignment and transcript expression analysis
76-bp Illumina RNA-seq reads for a claudin-low tumor (3 lanes), SUM159 (4 lanes), and MDA-MB-231 (3 lanes) were obtained from the TCGA and aligned to the UCSC human knownGene mRNA from NCBI build 37 (hg19) using Bowtie129. The alignment was performed allowing just one mismatch in each read and only the best resulting alignment was reported for each aligned read. Duplicate reads were removed using Picard (http://picard.sourceforge.net) and in-house scripts were used to obtain read counts for protein kinases. Read counts were summed for all isoforms of each kinase gene. The raw kinase transcript read counts were then normalized with a calculation of reads per kilobase of exon model per million mapped reads (RPKM)130. The value of “N” (total number of mappable reads) in the RPKM formula was defined as
the total number of aligned reads minus the duplicate reads. Additionally, the mean isoform length for each gene was used in the RPKM calculations.
Western blotting
28
antibodies. Antibodies recognizing pAKT (S473), pAKT (T308), pAXL (Y702), AXL, c-MYC, DDR1, EGFR, pERK1/2 (T202/Y204), pHER3 (Y1197), MAX, pMEK1/2
(S217/S221), MEK1/2, MKP3, pP70S6K (T389), pPDGFRβ (Y751), pPDGFRβ (Y1009), pPDGFRβ (Y857), PDGFRβ, pRAF (S338), pRSK1 (T359/S363), pVEGFR2 (Y1175),
VEGFR2 were obtained from Cell Signaling Technology. Antibodies for c-MYC (C-terminal), Cyclin A2, Cyclin B1, Cyclin D1, ERK2, MEK2 and RAF were obtained from Santa Cruz Biotechnology. The antibody recognizing BIM was obtained from Chemicon. The antibody recognizing p-c-MYC (S62) was obtained from Abcam. Secondary HRP-anti-rabbit, HRP-anti-mouse and HRP-anti-goat secondary antibodies were from Jackson Immunoresearch Laboratories, GE Healthcare and Santa Cruz Biotechnology, respectively. Western blots were visualized by incubation with SuperSignal West Pico Chemiluminescent Substrate (Thermo Scientific).
RTK arrays
Cells were harvested in RTK array lysis buffer containing 20 mM Tris-HCl (pH 8.0), 1% NP-40, 10% glycerol, 137 mM NaCl, 2 mM EDTA, 1X EDTA-free protease inhibitor cocktail (Roche), and 1% each of phosphatase inhibitor cocktails 1 and 2
(Sigma). After incubating on ice for 20 minutes, cell debris was pelleted at 4°C. Lysates (500 µg protein) were applied to R&D Systems Proteome Profiler™ Human
Phospho-RTK antibody arrays. Washing and secondary antibody steps were performed according to the manufacturer’s instructions. RTK arrays were visualized by
SuperSignal West Pico Chemiluminescent Substrate (Thermo Scientific).
Generation of c-MYC(T58A) SUM159 and T2-C3Tag Cells
29
post-infection after addition of polybrene (6 µg/ml), and placed on SUM159 and T2 cells for 36h. After an additional 4d in fresh media, cells were selected in either 3 µg/ml (SUM159) or 6 µg/ml puromycin (T2-C3Tag) for one week. Selected cell populations were used in subsequent experiments.
ChIP-PCR
Cells were fixed for 10 min in 1% formaldehyde, sonicated (VCX130
Ultrasonicator), and immunoprecipitated with 5 µg anti-c-MYC and protein A dynabeads (Invitrogen). Crosslinking was reversed by overnight incubation at 65°C, and DNA was purified with the MinElute PCR purification kit (QIAGEN). ChIP assay was quantified by real-time PCR using Absolute Blue SYBR green PCR mix (Thermoscientific). Fold enrichment was determined by the 2^-ΔCT method using the following PCR primers designed to amplify 75-100 bp fragments from genomic DNA: forward
5’-GGCTTTGAGACGTGAAAAGGA-3’ and reverse 5’-GGTCATCCAGCACAGATTGGA-3’; forward TGGGCCTTGGTTTGTCCTT-3’ and reverse
5’-CATGGAGGAGATGGAAAGATCCT-3’.
Inhibitor-conjugated bead preparation
Inhibitor beads were prepared via carbodiimide coupling of appropriately derivatized kinase inhibitors to ECH Sepharose 4B (Lapatinib, Bisindoylmaleimide-X, SB203580, Dasatinib, PP58 and VI16832) or EAH Sepharose 4B (Purvalanol B) (GE Healthcare). Briefly, ECH-Sepharose and EAH-Sepharose beads were washed with 50% DMF/EtOH followed by incubation with kinase inhibitors in 50% DMF/EtOH and 0.1M EDC (Sigma) at pH 5-6 overnight at 4°C in the dark. Following coupling, excess remaining groups were blocked with 0.1M N-ethyl-N’-(3-dimethylaminopropyl)
(ECH-30
Sepharose) or 20 mM HAc in 50% DMF/EtOH (EAH-Sepharose). Subsequently, beads were washed with 50% DMF/EtOH and alternating washes of 0.1 M Tris-HCl (pH 8.3) and 0.1 M acetate (pH 4.0) buffers, each containing 0.5 M NaCl. Inhibitor beads were stored in 20% ethanol at 4°C in the dark. See Figure 2.1 for structures of inhibitor-bead conjugates.
MIB statistical analysis
Data obtained from the MALDI TOF/TOF was processed with the ProteinPilot software to identify proteins from database searches and quantify changes in binding of kinases to MIBs using the Paragon Algorithm. The search results are further processed by the Pro Group Algorithm to determine the smallest justifiable set of detectable
proteins and relative protein levels. We performed three replicates of SILAC labeled SUM159 cells treated with AZD6244 (2 ‘heavy’, 1 ‘light’) or DMSO to assess the
reproducibility of MIB kinase affinity capture. A total of 113 unique kinases are identified. For each kinase, we computed the pool protein ratio and p-value across the three
replicates as follows. Let yij denote the log2 protein ratio for kinase i, i=1, …,113 in
replicate j, j=1,2,3. The pool protein ratio for kinase i is defined as 2^yi, where
yi=(3j=1yij)/3. To avoid directional conflict, we convert the two-sided p-value reported in
ProteinPilot to one-sided p-value and denote it as pij. We apply Stouffer’s z-score
method to combine the p-values. Let zij=-1(1-pij), where is the standard Gaussian cumulative distribution function. Define the combined Z-score as zi=(3
j=1zij)/√3. The
combined two-sided p-value for kinase i is given as pi = 2(1-(|zi|)). We also assessed
31
to account for multiple comparisons. 24, 13 and 10 kinases are identified to be
statistically significant for replicate 1, 2 and 3, respectively. 24 kinases are identified to be statistically significant in the pooled p-values.
Cell viability assays using siRNA knockdown of protein kinases
siGENOME pooled siRNAs for the genes of interest were obtained from
Dharmacon, Thermo Scientific. RNAi assays were performed in either 96- or 384-well clear bottom plates. Prior to the assay, transfection conditions were optimized for SUM159 or MDA-MB-231 cells using Dharmafect transfection reagent and siRNAs for GAPDH (negative control), and UBB (lethality control). A 40 µl mixture of Dharmafect and siRNA was plated into each well by a multi-channel pipette and then followed by adding 160 µl cell suspension using a microplate dispenser. The final assay volume was 200 µl with a dose of 25 nM siRNA. Drug or vehicle solvent was added to the cell
suspension before plating the cells. The assay was performed in triplicate and each plate had quadruple positive (UBB) and negative (GAPDH) controls. After 96h
incubation at 37°C with 5% CO2, the number of viable cells in each well was determined by a luminescence viability assay with a Pherastar microplate reader. The % activity was calculated against the averages of positive and negative controls (% activity = 100 x (1 - [raw value - σp]/[σn - σp], where σp and σn are averages of raw values for the
positive and negative controls, respectively. Each median in triplicate was used as a representative of % activity in the figures. Two-to-three independent experiments were performed with each cell line and siRNA.
Phosphoproteomics analysis of MIBs
32
using a nanoAquity UPLC system (Waters Inc). Peptides were first trapped in a 2 cm trapping column (75 μm ID, C18 beads of 2.5µm particle size, 200 Å pore size) and then separated on a self-packed 25 cm column (75 μm ID, C18 beads of 2.5µm particle size,
100 Å pore size) at room temperature. The identity and phosphorylation status of the eluted peptides was determined with a Velos-Orbitrap mass spectrometer (Thermo-Scientific). Specifically, following a FT full scan, MS2 spectral data were acquired by one of three dissociative methods on the 9 most intense ions from the full scan, taking into account dynamic exclusions. For ion dissociation, collision induced dissociation (CID), high energy collision induced dissociation (HCD) or a CID/HCD toggle was employed. The polysiloxane lock mass of 445.120030 was used throughout. All raw data were converted to mzXML format and then searched using Sequest on a Sorcerer 2.0 platform (Sage N Research, Milpitas, CA). The search was semi-tryptic on the human IPI database (10/3/2010) appended with reversed sequences as decoys.
Dynamic modifications for phosphorylated serines, threonines, and tyrosines were used, as well as a static modification for carbamidomethylated cysteines. Another search was also performed with the SpectraST algorithm provided in the Transproteomic Pipeline (TPP) version 4.4.1 using the NIST human ion trap database (1/14/2010). Results from the Sequest and SpectraST searches were analyzed using TPP's PeptideProphet and then combined using IProphet132. SILAC ratios were calculated with the XPRESS algorithm within TPP. XPRESS parameters were heavy arginines' with a mass difference of 10 and heavy lysines' with a mass difference of 6. Protein identifications were output by TPP's ProteinProphet.
Immunofluorescence and TUNEL assays
Tumors were snap frozen, cryosectioned at 6 µm and fixed in 4%
33
overnight with PDGFRβ rabbit antibody (Cell Signaling #3169) at 1:1000 dilution.
Secondary antibody was Alexa 555 goat-anti rabbit. Protocol provided by Cell Signaling for staining of cryosections was followed. TUNEL assays were performed using the In Situ Death Detection Kit per manufacturers protocol (Roche, #12156792).
Chapter IV Cell culture
MDA-MB-231 were grown in DMEM/F12 supplemented with 10% FBS. SUM159 and SUM229 cells were grown in DMEM/F12 supplemented with 5% FBS, 1 µg/ml hydrocortisone and 5 µg/ml insulin. BT474, SKBR3, and HCC1806 cells were grown in RPMI with 10% FBS. Media containing kinase inhibitors was replaced daily.
Multiplexed inhibitor bead affinity chromatography
Performed as in Chapter III.
MS analysis
Performed as in Chapter III.
Human breast tissue procurement
All human breast tissue was obtained from the Tissue Procurement Facility in compliance with the laws and institutional guidelines as approved by the UNC IRB committee.
Compounds and reagents
34
were synthesized according to the procedures described in two patent applications (WO2005030140A2, WO2007002157A2). Compounds for MIBs were
acquired/synthesized as in Chapter III. siGENOME siRNAs for the genes of interest and Dharmafect transfection reagent were obtained from Dharmacon, Thermo Scientific.
RNA sequencing, alignment and transcript expression analysis
Performed as in Chapter III.
Western blotting
Proteins from cell lysates were separated by SDS-PAGE chromatography, transferred to nitrocellulose membranes, and probed with the indicated primary
antibodies. Antibodies recognizing pAKT (S473), pAKT (T308), DDR1, EGFR, pEGFR (Y1045), pEGFR (Y1068), pEGFR (Y1173), EpCAM, pERK1/2 (T202/Y204), HER2, KIT, pMET (S1234/S1235) and vimentin were obtained from Cell Signaling Technology. Antibodies for cyclin B1, ERK2 and FGFR2 were obtained from Santa Cruz
Biotechnology, and the E-cadherin antibody was from Upstate. Secondary HRP-anti-rabbit, HRP-anti-mouse and HRP-anti-goat secondary antibodies were from Jackson Immunoresearch Laboratories, GE Healthcare and Santa Cruz Biotechnology,
respectively. Western blots were visualized by incubation with SuperSignal West Pico Chemiluminescent Substrate (Thermo Scientific).
Cell viability assays
35
and luminescence was measured by a Pherastar microplate reader. For cell counting assays, nuclei were stained with Hoechst 33342 (Invitrogen, 1:4000) and counted with a Cellomics ArrayScan VTI (Thermo).
Chapter V Compounds
Selumetinib, sorafenib, BEZ235, and compounds for MIBs were acquired or synthesized as previously described100. Trametinib for in vitro experiments was purchased from Selleck. Conjugation of inhibitors to beads was performed by carbodiimide coupling to ECH Sepharose 4B (bisindoylmaleimide-X, SB203580, lapatinib, dasatinib, VI16832 and PP58) or EAH Sepharose 4B (purvalanol B) (GE Healthcare).
The MEK inhibitors trametinib and selumetinib gave similar kinome reprogramming responses in preclinical models as shown previously1. Similarly, in cultured cell systems trametinib, selumetinib and U0126 were similar in regulating MEK1 and MEK2, induction of kinome reprogramming and inhibition of proliferation. This is consistent with the different MEK inhibitors binding to a common allosteric regulatory site and having the same mechanism of action.
Cell culture
SUM159, SUM229, MDA231, T11, WHIM12 and Hs578t cell lines were grown in DMEM/F12 supplemented with 5% FBS, 1% penicillin/streptomycin, 1 µg/ml
hydrocortisone and 5 µg/ml insulin. HCC1806, MDA-MB-468, 2225, and HCC1937, were grown in RPMI with 10% FBS and 1% penicillin/streptomycin. All cells were incubated at 37C with 5% CO2. Media and drug was replaced daily for experiments
36 Western blotting
Cell lysates were subjected to SDS-PAGE chromatography and transferred to nitrocellulose membranes before western blotting with primary antibodies. Antibodies against pAKT (T308), pAKT (S473), pAXL (Y702), AXL, BIM, c-MYC, DDR1, DDR2, EpCAM, pERK1/2 (T202/Y204), pFOXO3(T32), HER2, HER3, KIT, pMEK1/2
(S217/S221), pPKC(pan), pPDGFRβ (Y751), PDGFRβ, pRAF(S289), pRAF (S338),
SNAIL, pSRC (Y416), VEGFR2 and Vimentin were obtained from Cell Signaling Technology. Antibodies for Cyclin A, Cyclin B1, Cyclin D1, ERK2 and FGFR2 were obtained from Santa Cruz Biotechnology. Antibodies against Aurora A, BRD4 and E-Cadherin were from Upstate, Active Motif and BD Transduction Laboratories,
respectively. Secondary HRP-anti-rabbit and HRP-anti-mouse were obtained from Jackson Immunoresearch Laboratories. SuperSignal West Pico Chemiluminescent Substrate (Thermo Scientific) was used to visualize blots.
qRT-PCR
Performed as in Chapter III.
MIB/MS analysis
Performed as in Chapter III.
Cell viability assays using siRNA knockdown of protein kinases
Performed as in Chapter III.
RTK arrays
37 Kinome clustering and visualization
Two-way complete linkage unsupervised hierarchical clustering was utilized to visualize
the activity pattern of the top 100 most variable kinases by median absolute deviation
across the tumors. The analysis was carried out on logarithm transformed kinase quant
ratios in R (http://www.r-project.org/).
Proliferation assays
For short-term growth assays, 200-2000 cells were plated per well in 96-well plates and allowed to adhere and equilibrate overnight. Drug was added the following morning and replaced daily. After 72 hrs of drug treatment, cells were stained with Hoechst 33342 (Invitrogen, 1:4000) for 30 minutes at 37C, washed with PBS and counted with a
Cellomics ArrayScan VTI (Thermo) using Cellomics Scan software v7.6.2.1 (Thermo). For colony formation assays, cells were plated in 6-well dishes (200-1000 cells per well) and incubated overnight before continuous drug treatment for 30 days, with drug and media replaced twice weekly. At the end of treatment, cells were rinsed with PBS and fixed with chilled methanol for 10 min at -20C. Methanol was removed by aspiration
and cells were stained with 0.5% crystal violet in 20% methanol for 20 min at room temperature, washed with distilled water, and scanned. For quantitative analysis, crystal violet was solubilized from stained cells with 30% acetic acid and analyzed at λ=590 for
relative quantitation of staining. Error bars represent standard deviation.
Cell sorting
SUM229 cells were trypsinized and resuspended in Hank’s Balanced Salt Solution
38
fluorescently-labeled primary antibodies EpCAM-FITC (Stem Cell Technologies) and CD49f-PE-Cy5 (BD Biosciences), washed twice with HF media and filtered with a 0.2 µm filter. Fixed cells were analyzed using a Beckman-Coulter CyAn Cytometer, and live cells were sorted using a Sony iCyt Reflection Cytometer. Sorting was analyzed with FlowJo v7.6.5 software.
In vivo tumorigenesis experiments
The UNC Institutional Animal Care and Use Committee approved all mouse protocols. Drug treatment was administered through chow, provided ad libitum upon discovery of a palpable tumor. Tumors were harvested by snap-freezing in liquid nitrogen and stored at -80C.
Human breast tissue procurement
Human breast tissue was acquired from the Tissue Procurement Facility in full compliance with the laws and institutional guidelines as approved by the UNC IRB committee. Gene expression analysis was used to define subtypes of clinical specimens.
Window trial
Eligible women included those with stage I-IV newly diagnosed and previously untreated triple negative breast cancer that was accessible for biopsy and surgery; stage I-IIIc subjects could not be candidates for therapeutic neoadjuvant treatment. Triple negative status was based upon the clinical assays and defined by ASCO/CAP criteria including estrogen receptor (ER) and progesterone receptor (PR) <1% staining by
immunohistochemistry (IHC) and HER2-negative by IHC or fluorescence in situ
39
the nontherapeutic nature of the trial, and the study was approved by the UNC Office of Human Research Ethics. After enrollment, study subjects underwent core biopsy of the breast tumor, and then received trametinib for the 7 consecutive days prior to the scheduled surgery date. The last dose of trametinib was taken < 24 hours before surgery. At surgery a post trametinib tumor specimen was reserved for research. Patients were monitored for toxicity during and up to several weeks after treatment, until any evidence of toxicity had resolved. The dosing schedule of trametinib was determined by the surgery date; delays in standard therapy for trial purposes were not permitted. Given the nontherapeutic nature of the trial, the dose was deliberately set low at 1.5 mg orally daily under fasting conditions; this dose was increased per protocol to 2 mg daily after interim analysis of pharmacodynamic endpoints in the pre- and post-treatment tumor samples from, and toxicity assessment of, the first 3 patients enrolled.
Biopsy and surgical specimens were immediately placed into liquid nitrogen. Both pre- and post- trametinib tumor tissue was analyzed for baseline kinome profile and for the dynamic effects of MEK inhibition on the whole kinome. Frozen tissue intrinsic subtyping was performed by gene expression profiling using Agilent DNA microarrays and the PAM50 algorithm133; claudin-low subtyping used a centroid-based predictor8.
Statistical analysis of patient tumor peptides
40
Facility and two patient (Pt.1. and Pt. 2) 7d-tramatinib treated tumors from the window trial were used in the analysis. Endogenous protein kinases from tumors and the breast cancer cell mix were isolated using MIBs and iTRAQ-labeled for quantitative comparison of peptides. MEK1 and MEK2 peptide abundance from each tumor was quantitatively determined as an iTRAQ ratio of tumor/breast cancer cell line mix. Differences in MIB-binding of MEK1 and MEK2 relative to control between trametinib treated tumors and the five untreated tumors was analyzed using non-parametric Mann Whitney tests to
41
Figure 2.1 Structures of bead-conjugated kinase inhibitors. A) Bead-inhibitor
III. DYNAMIC REPROGRAMMING OF THE KINOME IN RESPONSE TO TARGETED MEK INHIBITION IN CLAUDIN-LOW TRIPLE NEGATIVE BREAST CANCER
Introduction
Kinase-targeted cancer therapies can fail when tumor cells circumvent the action of a single agent, facilitating therapeutic resistance. Acquired or selected mutations can decrease affinity for kinase inhibitors, but resistance also develops through alternate routes of kinase pathway activation. For example, RTK upregulation has been observed following targeted inhibition of selective kinases; this kinome reprogramming
circumvents inhibition of proto-oncogenic kinases54,63,67,134. Alternatively, genomic loss of PTPN12 phosphatase expression similarly causes activation of multiple tyrosine kinases135. Thus, dynamic and system-wide changes in multiple kinases can occur in tumor cells following pharmacological or progressive genetic perturbations. An
understanding of these kinome responses and the mechanisms by which they occur will be crucial for determining how to abrogate therapeutic resistance. With over 130 kinase-specific inhibitors currently in Phase 1-3 clinical trials, developing combination therapies relevant for molecularly-defined cancer subtypes is a highly tractable goal. However, rational design of kinase inhibitor combinations requires an overall knowledge of kinome activity and response, not just a simple measure of an inhibitor’s effect on one or two
43
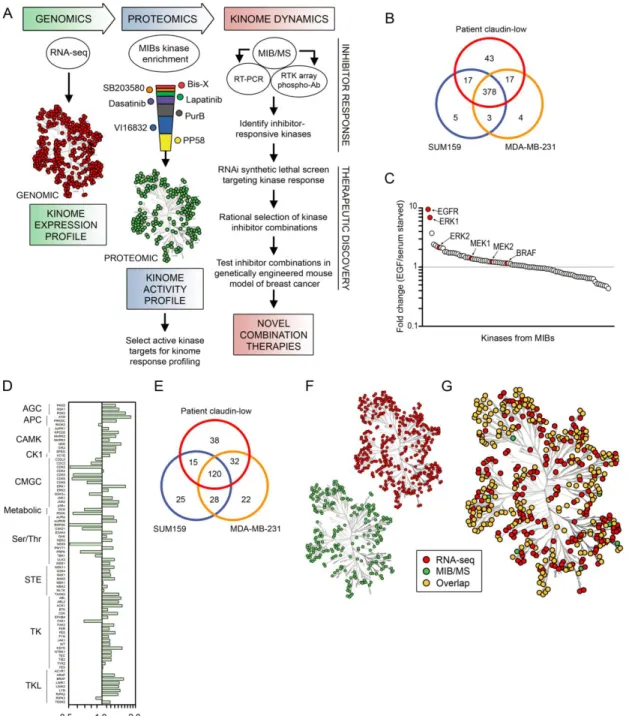
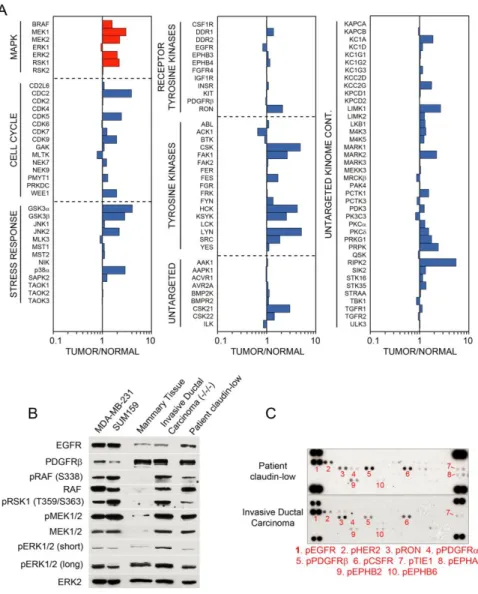
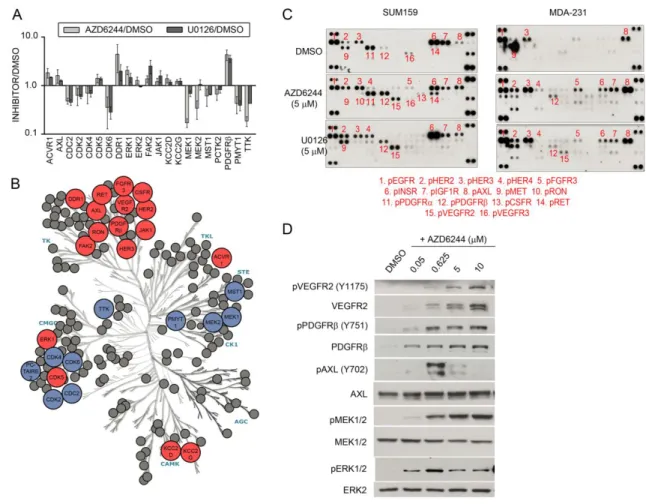
To meet this challenge, we developed a chemical proteomics approach using multiplexed kinase inhibitor beads and mass spectrometry (MIB/MS) to define and quantitate the activity and drug responsiveness of a significant percentage (50-60%) of the expressed kinome. We applied this technique to triple negative breast cancer cell lines, pre-clinical tumor models and human tumors. Analysis of patient TNBC showed activated RAF-MEK1/2-ERK1/2 signaling, supporting MEK as a target in TNBC. Pharmacologic MEK inhibition in TNBC cell lines and genetically engineered mouse model (GEMM) tumors resulted in rapid kinome reprogramming through the induced expression and activation of multiple tyrosine and serine/threonine kinases that bypassed the initial MEK-ERK inhibition. Alterations in virtually every tyrosine and serine/threonine kinase family were observed. The mechanism of this kinome reprogramming involved the proteolytic degradation of c-MYC following MEK1 and MEK2 inhibition which resulted in increased expression and activity of RTKs. MIB/MS analysis showed that reprogrammed kinase activation overcame MEK2 (but not MEK1) inhibition leading to therapeutic resistance. The MEK inhibitor kinome response
signature allowed us to predict and test the efficacy of a novel small molecule kinase inhibitor combination. The combination synergistically inhibited TNBC cell line
proliferation and caused apoptosis and tumor regression in the C3Tag GEMM of basal-like/claudin-low TNBC.
Results
Kinome profiling of TNBC
44
(Figure 3.1A,B). As expected, some kinase inhibitor beads were fairly specific for kinases captured, such as lapatinib (with high binding of EGFR) and bisindoylmaleimide-X (which bound mostly GSK3α/β and PKC isoforms), while others, like purvalanol B,
PP58, and VI16832, were promiscuous. Multiplexing beads within a single column enhanced the number of kinases captured and provided the greatest assessment of kinome expression and activity. Kinase capture with inhibitor beads is reproducible and is a function of the affinity of kinases for the immobilized inhibitors, kinase expression, and the activation state of the kinase116. Using MIB/MS, we have observed that different cell types and model systems exhibit partially overlapping but unique signatures of kinome expression and activity100,136. Across all cell line and tumor models tested, approximately 360 protein kinases and 24 metabolic kinases were observed above a cutoff of 90% confidence.
TNBC clinical trials of single kinase inhibitors have largely failed, consistent with drug-induced activation of alternative survival signaling pathways. Figure 3.2A outlines our strategy to interrogate kinome dynamics with the goal of defining endpoints leading to rational design of combination therapies. RNA-seq defined the transcript-level expressed kinome and affinity capture of endogenous kinases followed by quantitative mass spectrometry measured kinome activity profiles in tumors and cells. The
proteomic assessment was used to define the kinome response to targeted inhibition of kinases. RNAi tested growth and survival functions of the kinases activated in response to inhibitors, and the cumulative results were used to rationally predict kinase inhibitor combinations to test in models of TNBC.
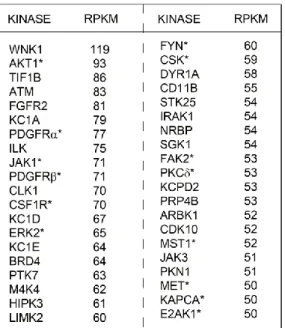
The kinome transcript expression profile of a patient’s claudin-low breast tumor