IMMUNE CELLS AND TYPE I INTERFERON IN SYSTEMIC LUPUS ERYTHEMATOSUS PATIENT URINE AND KIDNEY IMMUNOPATHOLOGY
Eric Scott
A dissertation submitted to the faculty at the University of North Carolina at Chapel Hill in partial fulfillment of the requirements for the degree of Doctor of Philosophy in the
Microbiology/Immunology Department in the School of Medicine.
Chapel Hill 2015
Approved by: Stephen H. Clarke
Barbara J. Vilen Roland M. Tisch
ii
© 2015 Eric Scott
iii ABSTRACT
Eric Scott: Immune Cells and Type I Interferon in Systemic Lupus Erythematosus Patient Urine and Kidney Immunopathology
(Under the direction of Stephen Clarke)
Murine models have demonstrated that systemic lupus erythematosus (SLE) results in kidney damage due to antibody mediated tissue destruction. Studies of peripheral blood immune subsets in patients revealed the importance of T and B lymphocyte subsets that drive pathological antibody production. The
immunopathological events in the kidneys of human SLE nephritis (LN) are poorly understood, in part due to a paucity of serial patient samples related to the risk of tissue biopsy procedures. To circumvent this, we investigated readily available patient urine that might contain immune mediators that correlate with kidney pathology and function. Flow cytometry analysis was performed on peripheral blood and urine cells of 28 non-LN patients and 41 non-LN patients. The urine immune cell phenotypes were correlated with the class of LN and kidney function. Sixty percent of non-LN patients had urine
iv
v
TABLE OF CONTENT
LIST OF FIGURES ... viii
LIST OF TABLES ... ix
LIST OF ABBREVIATIONS ... x
Chapter 1: Background and Introduction ... 1
I. Brief overview of B cells and antibodies within the immune system ... 1
II. B cell development ... 3
III. Central B cell tolerance ... 4
IV. Peripheral B cell tolerance and maturation of peripheral B cell sub-populations ... 5
V. Transitional B cells ... 6
VI. Marginal Zone and Follicular B cells ... 8
VII. Signaling through the B cell Receptor (BCR) ...10
VIII. Antibody production by B cells in health and autoimmunity ...11
A. Antibody (immunoglobulin) subtypes ...12
IX. B-T cell interactions ...13
A. Germinal Center (GC) ...13
1. Plasma cells ...17
2. Memory B cells (MBCs) ...19
X. Peripheral B cell tolerance mechanisms and autoimmunity. ...21
XI. Systemic lupus erythematosus ...23
A. Etiology of SLE ...24
vi
C. Treatments for SLE ...27
D. SLE pathology ...28
1. Autoreactive B cells in SLE and loss of B cell tolerance ...28
2. SLE patients have high plasma IFNα levels. ...30
3. Identifying autoreactive B cells in SLE ...31
XII. SUMMARY OF DISSERTATION ...34
Chapter 2: Immune cells and type 1 IFN in urine of SLE patients correlate with immunopathology in the kidney. ... 36
2.1 Introduction ...36
2.2 Materials and Methods ...39
2.2.1 HD and patient peripheral blood and urine samples. ...39
2.2.2 Cell surface staining and FACS analysis ...40
2.2.3 WISH cell culture. ...40
2.2.4 Real-time quantitative PCR assay ...40
2.2.5 ELISpot assay ...41
2.3. Results ...42
2.3.1 B and T cells are present in patient urine. ...42
2.3.2 SLE patients segregate into two subsets based on urine B cell phenotype. ...43
2.3.3 Urine B cells are likely of kidney origin. ...44
2.3.4 The presence of PB/PCs in urine correlates with more severe LN. ...44
2.3.5 CD19hi SLE patients with urine PB/PCs had high urine IFNα/β levels and a high frequency of urine pDCs...46
2.3.6 Urine T cells differ between LN and non-LN patients. ...48
2.4. Discussion...50
vii
3.1. Introduction ...81
3.2. Materials and Methods ...84
3.2.1 Healthy donor and patient peripheral blood and urine samples. ...84
3.2.2 Cell surface staining and FACS analysis ...85
3.3 Results ...85
3.3.1 SLE patients with an expanded CD19hi B cell population have a higher frequency of CD45RA-Foxp3lo T cells. ...85
3.3.2 Fraction III is enriched in proinflammatory cytokines ...86
3.3.3 IL-17 and IFN-γ enriched Fract III T cell subset associate with disease activity and proliferative nephritis. ...87
3.4. Discussion...88
Chapter 4 Discussion ... 98
4.1 Implications for the Progression of SLE ...98
4.2 Clinical Significance ... 106
4.3 Conclusion ... 107
viii
LIST OF FIGURES
Figure 1:1 CD19hi B cells are trafficking to sites of inflammation ... 34 Figure 2.1 Flow cytometry analysis of urine lymphocytes in SLE patients ... 66 Figure 2.2 SLE patients segregate into two subsets
based on urine B cell phenotype ... 67 Figure 2.3 Urine B cells are likely of kidney origin ... 68 Figure 2.4 Urine PB/PCs correlate with severity of LN ... 69 Figure 2.5 Higher levels of IFNα and higher frequencies of pDCs
correlate with the presence of PB/PCs in urine of SLE patients ... 70 Figure 2.6 A high CD4:CD8 ratio and increased DN T cell numbers
is associated with LN, urine PB/PCs, and disease activity. ... 71 S2.1 Frequency of IgG+ cells in urine. ... 72 S2.2 Higher levels of IFNα and higher frequencies of pDCs are
associated with urine PB/PCs ... 73 S2.3 Flow cytometry analysis of urine lymphocytes in SLE patients ... 74 S2.4 Flow cytometry analysis of DN T cells in the urine of SLE patients ... 75 Figure 3.1 SLE patients with an expanded CD19hi B cell population have
a higher frequency of CD45RA-Foxp3lo T cells ... 93 Figure 3.2 SLE patients with an expanded CD19hi B cell population have
a higher frequency of CD45RA-Foxp3lo T cells ... 94 Figure 3.3 Fraction III is enriched in proinflammatory cytokines ... 95 Figure 4.1. A model of how immune cells in urine reflect renal
ix
LIST OF TABLES
Table 1:1 International Society of Nephrology/Renal Pathology
Society (ISN/RPS) classification of lupus nephritis 2003 ... 26 Table 2.1: Demographics of SLE patients, normal controls,
and disease controls ... 58 Table 2.2 Number and percentage of SLE patients with B cells or T
cells in urine ... 59 Table 2.3:The number and percentage of non-LN and LN patients
with or without urine lymphocytes ... 60 Table 2.4: Summary of clinical therapy of patients analyzed ... 61 Table 2.5: Number and percentage of non-CD19hi and CD19hi
patients with urine naïve/memory B cells or PB/PCs... 62 Table 2.6: The number and percentage of non-LN and LN patients
with urine naïve/memory or PB/PCs... 63 Table 2.7: The number and percentage of non-proliferative LN,
proliferative LN, and CKD/ESRD patients with no B cells,
naïve/memory B cells, or PB/PC in their urine. ... 64 Table 2.8: SLE urine B cell phenotype and disease activity
x
LIST OF ABBREVIATIONS
Abs Antibodies
AID Activated-induced cytidine deaminase ASCs Antibody secreting cells
BCDT B cell depletion therapy Bcl-6 B cell lymphoma 6
BCR B cell receptor
Blimp1 B lymphocyte induced maturation protein 1 Blnk B cell linker
BM Bone marrow Ca2+ Calcium
CNS Central nervous system CSR Class-switch recombination
DC Dendritic cells
EBI2 Epstein Barr-virus induced G protein coupled receptor 2 ER Endoplasmic reticulum
ERK Extracellular signal-regulated kinase ESRD End Stage Renal Disease
FDCs Follicular dendritic cells FO Follicular
GC Germinal center H Heavy chain
xi IFN Interferon
IFNα/β Interferon α/β
Ig Immunoglobulin
IRF-4 Interferon regulatory factor-4
ITAMS Immunoreceptor tyrosine-based activation motifs JNK c-Jun NH-2 terminal kinase
L Light chain LN Lupus Nephritis
MAPK Mitogen-activated protein kinase MBCs Memory B cells
mDCs Myeloid dendritic cells MZ Marginal zone
NFAT Nuclear factor of activated T cells Pax-5 Paired box protein
PBs Plasmablast(s) PCs Plasma cells
PI3K Phosphatidylinositol 3 kinase PKC Protein tyrosine kinase PLCγ2 Phospholipase Cγ2
RAG1 Recombination Activating gene 1 RAG2 Recombination activating gene 2
xii SLE Systemic lupus erythematosus SYK Spleen tyrosine kinase
TD T-dependent
Tfh T-follicular helper cells Th T-helper cells
TI T-independent TLR Toll like receptors
1
Chapter 1: Background and Introduction
I. Brief overview of B cells and antibodies within the immune system
A functional human immune system provides protection from foreign pathogens. Innate and adaptive immune responses provide early detection and immunological memory, respectively. The innate immune system affords effective ‘first-line’ defense against invading organisms. Pathogens that breach epithelial surfaces are immediately recognized, ingested, and killed by cells of the innate immune system. This ‘first-line defense’ of the immune system detects unchanging components common to pathogens, but rarely found in the host. While immediately effective, the more primitive innate
system lacks the ability to refine its actions against a specific pathogen or generate memory. In contrast, the adaptive immune system comprises T and B-lymphocytes that have evolved a more comprehensive and diverse means of defense increasing
protection against infection and re-infections.
2
1991, Tomlinson S. 1993). Binding of toll like receptor (TLRs) via their ligands can also control and direct the adaptive immune response (Heine H. 2003).
Both the human and animal immune systems have evolved controls to respond to invading pathogens while protecting from damage of self.
The immune system must discern self from non-self to provide immunity yet prevent autoimmunity. When this balance is imperfect, an immune response against self-tissue antigens and nuclear proteins may result in autoimmune diseases. Autoimmune responses are incited by specific self-antigens that are expressed on normal host tissues, leading to immune-mediated tissue and organ damage.
Autoimmune diseases may be organ-specific and have aberrant immune Ab responses directed against antigen(s) associated only within target organs. Alternatively,
autoimmunity can be classified as systemic (or non-organ specific) and have Ab directed against an antigen not associated with any particular target organ. Type I diabetes mellitus is an example of organ-specific autoimmunity where CD4+ T cells and CD8+ T cells destroy pancreatic beta cells in genetically predisposed individuals(Van Belle TL. 2011). Systemic Lupus Erythematosus (SLE) is an example of systemic autoimmunity that is characterized by the production of autoantibodies (autoAbs) to cells within the body leading to widespread inflammation and tissue damage(Janeway CA. 2005).
3
part of the chapter will review why B cells are considered central players in SLE, both as producers of pathological Abs and mediators in the autoimmune response.
II. B cell development
B cell development begins in the bone marrow (BM) and continues in peripheral lymphoid organs. B cells are regulated by signals from non-hematopoietic BM cells and other factors. Tissue resident BM stromal cells interact with developing B cells,
providing signals through secreted growth factors and contact with cell-surface
molecules (Srivastava B. 2005, Pieper K. 2013). B cells only exit the BM if they express functional cell surface immunoglobulin (sIg) called B Cell Receptor (BCR). The antigen specificity of each individual B cell is determined through the assembly of Variable (V), Diversity (D), and Joining (J) gene segments that comprise the BCR. Pro-B cells upregulate the B cell lineage surface marker CD45R (B220 in mouse) and activate the recombination activating gene 1/2 (RAG1 and 2), to begin DJ rearrangement of their Ig heavy (H) chain under the control of the transcription factors E2A, EBF, and PAX-5 (Srivastava B. 2005, Pieper K. 2013). Pre-B cells up-regulate CD19, a BCR co-receptor, and proceed with V-DJ rearrangement(Oettinger MA. 1990, Kim DR. 2000, Collins AM. 2003, Pieper K. 2013). Upon H chain rearrangement, a surrogate Ig Light (L) chain is expressed to form the pre-BCR. This marks the beginning of the pre-B cell stage (Oettinger MA. 1990, Kim DR. 2000, Collins AM. 2003, Pieper K. 2013).
4
(Collins AM. 2003, Pieper K. 2013). If the second rearrangement is unsuccessful, the cell undergoes apoptosis and dies. If successful, the pre-B cell undergoes clonal expansion and proceeds to rearrange its L chain gene(Collins AM. 2003, Pieper K. 2013). After rearrangement of both the H and L chains and both chains are expressed on the B cell surface, the cell is considered an immature B cell(Collins AM. 2003, Pieper K. 2013). Maturing B cells only survive if BCR-antigen engagement during
development results in their being ‘selected.’ This central tolerance mechanism during B cell development is important to prevent the development of autoimmunity.
III. Central B cell tolerance
In the BM, B cells are ‘selected’ to continue to develop or not at the pre-B cell and immature B cells stages via any of three central tolerance mechanisms: receptor editing, deletion, or anergy (Melchers F. 1995, Rolink AG. 2001, Pieper K. 2013). B cell positive selection occurs when BCRs are exposed to self-antigens. If the interaction between the receptor and the self-antigen is weak, the pre-B cell receives a signal that enables it to continue the development process(Melchers F. 1995, Rolink AG. 2001, Pieper K. 2013). However, if the receptor strongly binds to the self-antigen, the pre-B cell undergoes receptor editing (Melchers F. 1995, Rolink AG. 2001, Pieper K. 2013). Receptor editing is the process of Ig gene rearrangement to attain a productive BCR and inhibit further rearrangement. If receptor editing is unsuccessful, the B cell undergoes apoptosis and is negatively selected or clonally deleted from the B cell repertoire (Melchers F. 1995, Rolink AG. 2001, Pieper K. 2013). Alternatively rather than clonal deletion, cells can become ‘anergic.’ Anergy is a state of
5
whereby a B cell can no longer be activated through its BCR. Together, these B cell tolerance mechanisms aim to prevent autoreactivity by eliminating immature B cells that recognize self-antigen before they leave the BM. If successful, only anti-microbial immature B cells leave the BM and migrate to the secondary lymphoid organs where they become functional mature B cells (Melchers F. 1995, Rolink AG. 2001, Pieper K. 2013).
IV. Peripheral B cell tolerance and maturation of peripheral B cell sub-populations Immature B cells leave the BM and migrate to secondary lymphoid tissues, such as the spleen and lymph nodes for further maturation. The spleen is a major secondary lymphoid organ and is divided into the red pulp, where the blood is filtered and iron recycled, and the white pulp, where a majority of the resident cells are lymphocytes (Nolte MA. 2004, Mebius RE. 2005, Pieper K. 2013). Migration of immature B cells into the spleen is orchestrated by the chemokine CXCL13 produced by the stromal cells in the spleen. High levels of CXCL13 receptor, CXCR5 (Pieper K. 2013), enables
immature B cells to home to secondary lymphoid organs.
In secondary lymphoid organs, B cells are arranged in follicles, or B cell zones, of the white pulp (Nolte MA. 2004, Mebius RE. 2005). The marginal zone (MZ) divides the red and white pulp. The MZ contains several distinct populations of macrophages, dendritic cells (DCs), as well as MZ B cells. In mice, MZ B cells do not re-circulate and are thought to be vital in the maintenance of the MZ and other cell types that reside there (Nolte MA. 2004, Mebius RE. 2005).
6
anergy (Melchers F. 1995, Rolink AG. 2001, Pieper K. 2013) and in the periphery as these cells leave the BM as “transitional cells.” The second checkpoint occurs in follicles called germinal centers (GC) that will be discuss in more detail in this chapter. Once a functional B cell is positively selected they can now move on to the next stage of development. To ensure survival during this developmental stage, B cells require
survival signals before they can differentiate into mature naïve B cells (“follicular) or the aforementioned MZ B cell (Pieper K. 2013). The major B cell subsets known to be prone to autoreactivity and under control of these two tolerance checkpoints will be discussed in more detail below.
V. Transitional B cells
Immature B cells migrate from the BM to the periphery where they transition into functional mature B cells. Several receptors expressed on the surface of ‘transitional’ B cells are used to track their maturation stage during migration to secondary lymphoid organs. Transitional (T1, T2, T3) B cells can be divided into subsets based on the
surface expression of CD23, IgM, and the developmental marker AA4 (Allman D. 2001). T-1 cells are surface (s) sIgMhi, sIgDlow CD23low and are found in blood, BM and spleen; T-2 cells are sIgMhi, sIgDhi, CD23 and are found in the spleen (Allman D. 2001, Sims GP. 2005). T-2 cells are thought to be derived from the T-1 cells (Allman D. 2001, Sims GP. 2005). T-3 cells are reported to be an anergic splenic population that does not progress into the mature stage (Merrell KT. 2006, Vossenkamper A. 2011).
7
transitional B cells in human blood are autoreactive and do not enter the pool of mature functional B cells (Wardemann H. 2003, Meffre E. 2004). A subset of transitional B cells in human blood was found to be similar to murine T-1 cells in terms of cell surface phenotype (Sims GP. 2005). These circulating human T1 cells were identified by the following cell surface phenotype: CD38+, IgD+, CD27-, CD44low, CD24hi, CD21low, CD23low, IgMhi, and CD62low. Unlike mouse T-1 cells, human transitional cells also express CD5 and CD43 (Sims GP. 2005). More recently, Suryani et al. described a subset of transitional cells characterized by the presence of CD21 (Suryani S. 2010). CD20+CD27-, CD10+ and CD21low B cells and CD20+CD27-, CD10+CD21hi B cells were isolated from peripheral blood, cord blood and spleen (Suryani S. 2010) (Sims GP. 2005). The authors found a difference between the frequency of CD10+ CD21low and CD10+CD21hi B cell subsets (Suryani S. 2010). The CD21low cells were abundant in the human spleen and decreased in the peripheral blood, in which CD21hi B cells appeared in the highest frequency (Suryani S. 2010). Whether CD21low or CD21hi B cell subsets were enriched in autoreactive B cells and contributes to autoimmunity remains to be determined.
An additional human transitional subset has been characterized by the cell surface expression of CD24int, CD38int, IgD+, CD27-. These cells differentiate into mature B cells in vitro (Palanichamy A. 2009). Interestingly, Palanichamy et al. found that this population was especially prevalent during reconstitution in patients after B cell depletion therapy (BCDT) and over time was replaced by mature naïve B cells
8 cells.
VI. Marginal Zone and Follicular B cells
B cell subsets are a result of differentiation or maturation, and B cell lineage commitment is dictated by several factors that operate together. Whether immature transitional B cells become MZ or follicular (Fo) cells depends in part on the strength of BCR signaling based on the interaction with self-antigens and Notch 2, a member of the NOTCH family (Pillai S. 2009). Murine B cells deficient for Notch 2 do not mature into MZ B cells, suggesting that both a weak BCR signal and Notch 2 induce MZ B cell development, while a strong BCR signal favors the development of Fo B cells (Pillai S. 2009). Both MZ and Fo B cells reside in specialized compartments of the spleen and each possesses distinct functional capacities.
In the spleen and other secondary lymphoid organs, the MZ is a distinct microanatomical location where immune cells become specialized to defend against pathogens. The MZ is located next to the marginal sinuses, the sites of entry into the spleen for lymphocytes, macrophages, and DCs (Mebius RE. 2005). The marginal sinus separates the white pulp from the red pulp. Pathogens reaching the bloodstream are efficiently trapped in the MZ by macrophages that participate in an early response with MZ B cells (Mebius RE. 2005). Thus, the spleen is a diverse environment
comprised of multiple types of lymphoid and non-lymphoid cells.
9
MZ B cells (Cariappa A. 2007). The Fo B cells exist in the follicles while MZ B cells reside in the MZ of the spleen where they encounter blood-borne pathogens (Cariappa A. 2007). Follicles are always adjacent to T cell zones, an arrangement that allows activated Fo B cells and activated T helper (Th) cells to migrate towards each other and interact at the interface (Pillai S. 2004, Pillai S. 2009). Once an immature B cell
becomes a MZ B cell, the newly differentiated MZ B cell will migrate to a new location in the spleen.
There are also functional distinctions between MZ and Fo B cells. MZ B cells are considered to be more “hyperactive” compared to Fo B cells in their processing and presentation of antigen and stimulation of T cells (Gunn KE. 2006, Pillai S. 2009). MZ B cells are non-circulating, self-renewing B cells that react rapidly to blood-borne
pathogens and are major contributors to an early T-independent response (TI) (Cyster JG. 2000, Martin F. 2001). TI responses are important in defending against blood-borne infection that can lead to endotoxic shock (Cyster JG. 2000, Martin F. 2001). Typically, MZ B cells rapidly develop into extra-follicular plasma cells that secret IgM within the first three days of a short-lived response (Gunn KE. 2006). In addition to having a role in TI responses, MZ B cells can participate in T dependent (TD) responses (Martin F. 2002, Phan TG. 2005). Thus, MZ B cells are positioned in the spleen to rapidly respond to both TI antigens and TD antigens with great efficiency.
10
CD40 (Pillai S. 2004, Pillai S. 2009). Fo B cells also process and present antigen in the context of major histocompatibility complex (MHC) class II (MHCII) to activate T cells (Pillai S. 2004, Pillai S. 2009). The interaction between Fo B cells and T cells may result in a GC reaction responsible for production of high affinity binding Ig that will be
discussed in further detail below.
VII. Signaling through the B cell Receptor (BCR)
BCR signaling in the periphery is extremely vital to how a B cell responds to antigen. The BCR is examined early on in B cell development to determine its affinity to self-antigen. Upon engagement with antigen, membrane bound BCR transmits a
cascade of signals in B cells that results in the activation of key proteins. The BCR is also non-covalently associated with a disulfide-linked heterodimer of CD79a (Igα) and CD79b (Igβ) (Campbell KS. 1990, Hombach J. 1990, Gold MR. 1991, Cambier JC. 1994, Batista F. 2001, Packard TA. 2013). Igα and Igβ contain immunoreceptor tyrosine-based activation motifs (ITAMs) in their cytoplasmic tails that are
phosphorylated after activation of the BCR(Campbell KS. 1990, Hombach J. 1990, Gold MR. 1991, Cambier JC. 1994). Phosphorylation of ITAMs initiates a signaling pathway in B cells that will culminate in the regulation of important regulatory genes. Two tyrosines within the ITAM motif by Src-family kinases (SFK), including Lyn, which is the predominant SFK expressed in B cells (Saijo K. and Adachi T 2003) are also
11
B-cell linker (Blnk, SLP-65). Once the multi-protein complex containing cytosolic and membrane-bound signaling intermediates adhere to the Blnk scaffold, this complex is referred to as the BCR signalosome (Fruman DA. 2000, Packard TA. 2013). Other key signaling molecules are activated downstream, including phosphatidylinositol 3-kinase (PI3K) and phospholipase Cγ2 (PLCγ2)(Fruman DA. 2000, Packard TA. 2013). PLCγ2 regulates activation of protein kinase C (PKC) and calcium flux. This PI3K pathway is required for efficient activation of the Ser/Thr kinase Akt, which blocks apoptosis in BCR stimulated cells (Fruman DA. 2000, Packard TA. 2013).
Other potential signaling molecules downstream of Syk include the mitogen-activated protein kinase (MAPK) family, such as extracellular signal-regulated kinase (ERK), c-Jun NH-2-terminal kinase (JNK), and p38 MAPK. In addition, BCR signaling potentially results in activation of transcription factors, such as nuclear factor of
activated T cells (NFAT) and the ubiquitously expressed NF-kB (Tedder TF. 1997, Sada K. 2001). These molecules, signaling via the BCR, are important regulators of cell proliferation, survival, and differentiation.
VIII. Antibody production by B cells in health and autoimmunity
The ability of B cells to produce antigen specific Abs makes them key players in adaptive immunity. An Ab consists of two identical H chains and two identical L chains, both of which consist of a constant (C) and V region. The V regions determine antigen specificity, while the C region determines effector function and Ig class. B cell
12 A. Antibody (immunoglobulin) subtypes
There are five major classes of immunoglobulins (Ig): IgM, IgD, IgA, IgE, and IgG (Janeway CA. 2005, Mix E. 2006). IgM exists as a pentamer and is the first Ig class generated by B cells; it also makes up the bulk of TI and natural Ab responses. IgD exists as a surface molecule and is not secreted. IgA exist as dimers and are secreted to protect mucosal surfaces. IgE is rarely present in its free form and participates in mast cell and eosinophil activation to protect against worms and other parasites. IgG is the most abundant isotype found in plasma. There are four IgG subclasses (IgG1,IgG2, IgG3, and IgG4), each with distinct effector functions.
13 IX. B-T cell interactions
Thus far we have discussed the maturation of B cells and how they contribute to an adaptive immune response via the production of Abs. This next section will discuss the integral connection between B cells and T cells to achieve an effective response to antigens. One of the effector functions of B cells is the production of high affinity Abs. Abs produced to protein antigens require help from Th cells including T follicular helper (Tfh) cells (Crotty S. 2011). In return, B cells provide co-stimulatory signals to activate T cells that further enhance the immune response. B and T cell interactions are important to help clear microbial antigens and provide the host with long lasting immunological memory.
Once an activated B cell encounters an activated Th cell, an immunological synapse is formed between the antigen-MHC II complex and the TCR (Tarlinton D. 1998, McHeyzer-Williams MG. 2003, Manser T. 2004). This B-T cell interaction results in the production of cytokines by T cells that directly influence B cell proliferation and differentiation.
For efficient activation, both B cells and T cells require additional co-stimulation. The binding of CD40 expressed on B cells and CD40L (CD154) on T cells is essential for activation (O'Connor BP. 2003). These types of ‘second signal’ interactions provide activation and stimulatory signals for both B cells and Th cells. Second signal
interactions in the GC produce high affinity Ab.
A. Germinal Center (GC)
14
amongst B cells, Tfh cells, and follicular DCs (FDCs). A major objective of the GC response is the generation of life-long protective immunity that ensures rapid and efficient immune responses to recurrent infections. Both MBCs and PCs are products of GC reactions and represent a population of cells that display higher affinity receptors (Garside P. and Jenkins MK. 1998, Okada T. 2005, Hamel K. 2012).
Another pivotal interaction for GC formation and maintenance is the binding of the B7 molecules CD80 and CD86 on B cells to CD28 and CTLA-4 on Th cells
(McHeyzer-Williams MG. 1993, Tarlinton D. 1998, McHeyzer-Williams MG. 2003). This is an important second signal necessary for efficient B and T cell activation. Multiple cell-bound and secreted factors are also vital in the stimulation of B cells by Th cells, particularly, the inducible co-stimulator (ICOS) and its ligand ICOS-L.
15
McHeyzer-Williams MG. 2003). The remainder of the B cells proliferate to form a region of IgD negative cells within the primary follicle (Hamel K. 2012),(McHeyzer-Williams MG. 1999). These IgD- B cells migrate to the T-B cell border in search of T cell help.
The BCR serves two major roles for B cell activation in GC. First, it transmits signals intracellularly upon binding antigen. Second, the BCR delivers antigen to
intracellular sites where it is degraded, returned to the B cell surface as peptides bound to MHC class II molecules, and presented to T cells (Tarlinton D. 1998, McHeyzer-Williams MG. 2003, Manser T. 2004). This is an additional function of B cells that
enhances the adaptive immune response but also autoimmunity by potentially activating autoreactive T cells.
Distinct signaling mechanisms via the BCR within the GC determine the fate of B cells. Low BCR affinity or the loss of function of the BCR results in centrocyte
apoptosis. By contrast, centrocytes whose BCR affinity is enhanced through SHM are selected to re-enter the cycle or differentiate into either a long-lived PC or MBC
(McHeyzer-Williams MG. 1993, McHeyzer-Williams MG. 1999, McHeyzer-Williams LJ. 2001, McHeyzer-Williams MG. 2003). A distinct feature of GC reactions is the
production of B cell clones that have undergone Ig class-switching (CSR) and affinity maturation. CSR is a process that irreversibly rearranges the H chain C region genes from IgM or IgD to IgG, IgA, or IgE (Stavnezer J. 2008). As stated earlier, this
16
antigen are then selected for survival and differentiation through a process known as affinity maturation. Affinity maturation was originally thought to be a result from the competition of newly formed GC B cell clones for limited antigen presentation by FDCs (Tarlinton DM. 2000). GC B cells with higher-affinity for antigen out-compete lower affinity clones and receive survival signals through BCR stimulation. However, recent in vivo studies contradict this model by suggesting the interaction between FDCs and GC B cells are unstable and do not promote prolonged signaling (Allen CD. 2007).
Several molecular pathways dictate B cell trafficking and maturation within the GC. A pivotal transcription factor expressed in GC B cells is B cell lymphoma 6 (Bcl-6), a transcriptional repressor induced in B cells by IL-21 that functions to suppress DNA responses caused by double stranded DNA breaks arising from CSR and SHM (Cattoretti G. 1995, Dent AL. 1997, Ye BH. 1997). Bcl-6 also inhibits B lymphocyte induced maturation protein 1 (Blimp-1), a transcription factor crucial for PC
differentiation (Cattoretti G. 1995),(Shaffer AL. 2000). In addition to Bcl-6, paired box protein 5 (Pax-5) is an important transcription factor in maintaining the identity of GC B cells, perhaps due in part to its repression of X-box binding protein 1 (XBP-1), which is up regulated upon Fo B cell activation and required for PC differentiation (Wakatsuki Y. 1994, Calame KL. 2001, Iwakoshi NN. 2003). The Epstein Barr virus-induced G-protein coupled receptor 2 (EBI2) has been described as having a role in the localization of B cells within the follicles (Pereira JP. 2009), (Gatto D. 2009). EBI2 is up regulated on B cells after interacting with T cells and this signals the B cell to migrate to the
17
establish GC (Pereira JP. 2009), (Gatto D. 2009). Altogether, these proteins control the decision between an extrafollicular response versus generation of memory; their role in differentiation to PCs will be discussed below. Upon antigen activation, some of the activated B cells form foci outside the T cell zone (extrafollicular foci) and differentiate into short-lived Ab secreting cells (ASCs). ASCs may class switch but do not show signs of SHM (Hamel K. 2012),(McHeyzer-Williams MG. 1999).
1. Plasma cells
GC B cells may differentiate further into either MBCs or pre-plasma cells or plasmablasts (PB). An alternative fate of GC B cells is the terminal differentiation into long-lived PCs that secrete class-switched, SHM Ab (O'Connor BP. 2003). Terminally differentiated PCs reside in the BM where they produce long-lived Ab that can provide life-long protection from invading pathogens. PCs are characterized by decreased expression of B cell-specific surface markers such as the BCR, CD19, CD20, CD21, MHC II and several others and increased CD38 and CD138 expression (O'Connor BP. 2003). PCs are rarely found in the peripheral blood of humans but are often observed in tissue such as the kidneys of lupus nephritis (LN) patients (Chang A. 2011). The increased presence of PCs in the kidneys of LN patients is suggested to be locally produced by resident B cells, perhaps autoreactive B cells (Kinloch AJ. 2014).
18
while activating XBP-1 (Calame KL. 2001). XBP-1 is expressed at high levels in PCs (Reimold AM. 2001, Shaffer AL. 2004). It is also an important mediator of one branch of the unfolded protein response-signaling pathway that responds to endoplasmic
reticulum (ER) stress induced by the accumulation of unfolded proteins in the ER lumen (Todd DJ. 2009). XBP-1 activation is crucial to the survival of highly secretory cells because of its ability to regulate every stage of the secretory process (Todd DJ. 2009). Importantly, XBP-1 induces the expression of many components of the multi-protein chaperone complex that binds and processes nascent Ab H chains (Todd DJ. 2009). In addition, the transcription factor Interferon regulatory factor-4 (IRF-4) suppresses Bcl-6 expression and may have a role in terminal PC differentiation (Sciammas R. 2006) . Long-lived PC differentiation is linked to the number of rounds of GC B cell division (Hasbold J. and PD. 2004). The association between cell division and PC differentiation may also be due to increased levels of SHM with continued centroblast divisions and the tendency of higher affinity GC B cells to be selected for PC differentiation (Martinez-Pomares L. 2007, Peled JU and Goodman MF 2008). Tfh cell derived IL-4, IL-21 and CD40L also impact the quality of PC responses through direct stimulation of GC B cells (Reinhardt RL. 2009, Crotty 2011).
19
differentiate and become resident producers of Ab (Loetscher M. 1998). Once formed, PCs can persist and secrete Ab for long periods and in some cases the lifetime of the individual (Kunkel EJ. 2003, Tsubaki T. 2005, Tschen SI. 2006). Ongoing generation of PBs and long-lived PCs in extra-lymphatic lesional tissue may be prominent in states of autoimmunity.
2. Memory B cells (MBCs)
In addition to PC, MBCs are also generated by a GC response and maintained in the periphery. After leaving the GC, MBCs re-circulate in the periphery, where they can survive for decades in humans(Crotty S. 2003). Upon re-encounter with cognate
antigen, MBCs rapidly proliferate and differentiate into PCs secreting high affinity Abs (Crotty S. 2004).
Several characteristics describe functional MBCs. They are defined as antigen-experienced, long-lived, IgD- B cells that have undergone somatic mutations of their Ig-V region genes (Crotty S. 2004, Fecteau JF. 2006). Human MBCs have been
characterized in peripheral blood and tonsil. These cells are larger in size than naïve B cells and express higher levels of co-stimulatory and activation molecules such as CD80, CD86, and CD95, and decreased expression of the IgE receptor CD23 (Ehrhardt 2005). Functional analyses revealed that human and murine MBCs respond faster and more strongly than corresponding naïve B cells (Liu YJ. 1995, Tangye SG. 2003).
20
Barrington RA. 2002). Later Anderson et al found that antigen alone was not required for maintenance of MBCs (Anderson SM. 2006). To elucidate the mechanism involved in maintaining MBCs long-term, several groups have studied specific proteins involved in MBC survival. In particular, in human tonsillar B cell populations, Mcl-1 and Bcl-x1 proteins were found to be reduced in MBCs compared to GC B cells (Vikstrom I. 2010). In addition, the apoptosis-inducer protein Puma regulates human and murine MBC survival (Clybouw C. 2011). Puma is up-regulated in vitro upon mitogenic activation in both human and mouse and Puma-deficient mice show an excess of antigen-specific MBCs (Clybouw C. 2011).
Classically, cognate antigen and memory Th cells are thought to be required for activation of quiescent MBC (McHeyzer-Williams MG. 2003), (Kalia V. 2006), (Kindler V. 1997). However, there is data that show that polyclonal stimuli, specifically soluble cytokines produced by T cells, and CpG oligodeoxynucleotide (short single-stranded DNA molecules) can induce the proliferation and differentiation of human MBCs
(Bernasconi NL. 2002), (Bernasconi NL. 2002). As well as stimulation with CD27 ligand (CD70) and IL-10(Agematsu K. 1998)can stimulate MBC proliferation and
differentiation.
MBCs respond rapidly to activating stimuli. In vitro, stimulation through the BCR leads to increased secretion of Ab by MBCs compared to naïve B cells. Unlike naïve B cells, MBCs differentiate into ASCs upon stimulation with anti-CD40, IL-2 and IL-10 and BAFF in the absence of antigen (Liu YJ. 1995, Tangye SG. 2003). After stimulation, some MBCs proliferate while others differentiate into short-or long lived PCs
21
(Tangye SG. 2003, Tarlinton D. 2006),(Tangye SG. 2003). MBCs also up-regulate co-stimulatory molecules such as CD80/CD86 to activate T cells as well as MHC class II molecules for antigen presentation (Liu 1995).
MBCs may play a prominent role in SLE. However, our understanding of the role MBCs contribute to disease is impeded by the lack of specific surface markers to
identify MBCs. Jacobi et al previously reported a subset of MBCs present in the
peripheral blood of SLE patients characterized by the expression of CD95. These cells lacked the “traditional” memory cell marker CD27 (CD27-95+) however, they are
enlarged cells that express somatically mutated Ig H chain transcripts (Jacobi AM. 2008). Interesting, the frequency of CD27-CD95+ B cells significantly associates with disease activity including flares (Jacobi AM. 2008). Our lab previously reported a subset of MBCs characterized by high expression of the BCR-co-receptor CD19 and low
expression of complement receptor CD21 (referred to as CD19hi). We found that this MBC subset was increased in patients with end stage renal disease (ESRD) due to SLE (Culton DA. 2007, Nicholas M. 2008). This particular population of MBCs will be
discussed in more detail later in this chapter. Thus, in addition to long-lived
immunologic memory, MBC subsets that should contribute to adaptive anti-microbial immune reactions may mount autoreactive responses when critical self-tolerance mechanisms are not functional.
X. Peripheral B cell tolerance mechanisms and autoimmunity.
22
regulate autoreactivity is an important mechanism to prevent autoimmunity. This next section will discuss the role of peripheral B cell tolerance and what happens when regulatory mechanisms are compromised.
B cell tolerance is essential for maintaining nonresponsiveness to thymus-independent self-antigens such as lipids and polysaccharides. It is also important in preventing the development of Ab responses to protein self-antigens. As discussed earlier, central B cell tolerance mechanisms include receptor editing, deletion and anergy. However, highly effective, autoreactive B cells may escape from the BM where they may encounter self-antigens in the periphery. If a mature B cell recognizes
autoantigens in peripheral tissues without specific Th cell help, the B cell may be functionally inactivated by anergic mechanisms or may die by apoptosis.
Anergy is an important mechanism to maintain B cell tolerance to self-antigens. It is a state of functional hyporeactivity induced by antigen encounter at the
development stage in the BM or by chronic antigen exposure in the periphery
(Shlomchik MJ. 2008). Anergy is likely dependent on the degree (or affinity) of antigen-BCR engagement and studies show that anergy can occur when an immature B cell experiences an intermediate degree of engagement of the BCR (Shlomchik MJ. 2008). Unless specific counter costimulatory molecule signals are present, an anergic B cell can no longer be activated through BCR; thus it does not proliferate, up-regulate activation markers, or secrete Ab (Goodnow CC. 1988, Eris JM. 1994, Shlomchik MJ. 2008). Abrogation of effector function in anergic B cells is due to dampened signaling through the BCR as measured by decreased phosphorylation of substrates and
23
shorter half-life than naïve B cells(Fulcher DA. 1994), due in part to an increased dependence upon survival factors such as BAFF (Lesley R. 2004).
Anergic B cells can be rescued by engagement of costimulatory molecules or TLRs on the B cell(Pieper K. 2013) (Chang NH. 2008), (Meffre E. 2011). In addition, binding of foreign antigens to IgD combined with T cell help allows anergic B cells to become activated and enter into a GC reaction(Pieper K. 2013). However, anergic B cells may be exposed to self-antigens in the GCs. Once exposed to self-antigens in the GC, B cells are not selected into the pool of long-lived switched MBC or into the PC pool(Pieper K. 2013). This is a crucial regulatory point that is essential to prevent the proliferation of autoreactive B cells.
Although effective, peripheral tolerance mechanisms such as anergy and deletion by apoptosis may fail resulting in an autoimmune response. B cells are considered central mediators in some autoimmune diseases, in particularly SLE. In addition to Ab producers, B cells may produce cytokines and act as APCs that present antigen to activate autoreactive T cells. The central role of B cells in SLE will be discussed below.
XI. Systemic lupus erythematosus
SLE is a chronic autoimmune disease characterized by the production of auto-Abs to intracellular proteins and nucleic acids. SLE is the prototypic systemic
24
than men, at a ratio of about 10:1, with minority women being affected three times more often than Caucasians (Rus V. 2001).
A. Etiology of SLE
The causes of SLE are unknown but believed to be linked to a combination of genetic, environmental, and hormonal factors. The development of transgenic and knockout mice has improved our understanding of the interplay between genetic and environmental factors and specific genes have been linked to SLE in humans and in mice, as have various environmental exposures (Eroglu GE. 2002, Parks CG. 2002, Tsao BP. 2004, Mackay MA. 2006). For instance, abnormalities in certain genes, such as those encoding HLA-DR2 (Eroglu GE. 2002), Fc gamma receptor (Fcγ)(Mackay MA. 2006) and proteins of the complement system(Tsao BP. 2004) are associated with SLE in mice and human. While environmental exposures have been implicated in both development and progression (Parks CG. 2002), causative agents have not been identified. Clearly both genetic and environmental factors are important in the development of SLE; monozygotic twin concordance for SLE is only about 25-50 percent (Klippel JH. 2001, Manderson, 2004 #200), and no single environmental agent results in disease in all individuals. To date, the interaction between genes and
25
B. Renal disease increases the risk of mortalities in SLE.
The development of glomerulonephritis (Lupus nephritis, LN) is a principle cause of morbidity and mortality in SLE according to the Lupus Research Institutes (LRI). The classification of LN is crucial to the issue of patient care (See Table 1:1 LN
Classification). Each class defines the degree of kidney damage. The classification of the kidney biopsies allows clinicians to follow standard protocols that provide the best treatment options for patients. Active LN is associated with a 30 percent decrease in creatinine clearance, proteinuria of greater than 1000 mg/day, and renal biopsies suggest gross inflammation (Duran-Barragan S. 2008, Uchida K. 2011). Despite
26
Table 1.1 International Society of Nephrology/Renal Pathology Society (ISN/RPS) classification of lupus nephritis 2003.
LN Class Definition
Class I Minimal mesangial LN
Class II Mesangial proliferative LN
Class III Focal lupus nephritis
Class IV Diffuse segmental S) or global (IV-G) LN
Class V Membraneous LN
27
Ig (or Ab) – antigen complexes called immune complexes or ICs are found
deposited in kidney glomeruli. Glomeruli are tiny filters in the kidneys responsible for the removal of excess fluid, electrolytes and waste taken from the bloodstream. ICs
mechanically interfere with glomerular function by increasing local inflammatory conditions. Currently, kidney biopsies that identify the degree of glomerular damage and IC deposition are considered the best analytic tool for diagnosing LN. However serial biopsy is invasive, and impractical as a disease monitoring/prognostication tool. An alternative approach may be the use of patient urine and this methodology will be discussed later in the chapter.
The ability to follow and study patient disease status and progression into ESRD is hampered by a lack of tissue samples. Currently several biomarkers exist to follow LN patients. Serum levels of anti-dsDNA, creatinine clearance, urine protein to
creatinine ratios, proteinuria and complement levels are all used to follow disease
activity. The problem with these biomarkers is that they often lack sensitivity and do not afford differentiation between levels of renal activity and damage. Therefore, new biomarkers and methods for detection would lead to improved outcomes for patients.
C. Treatments for SLE
28
understanding of the immune pathology in SLE has led FDA approval of agents like Benlysta, (anti-BAFF therapy that effects B cell survival), varied responses in patients have led to diminished enthusiasm for this agent. Some SLE patients are poor
responders to this type of therapy and other types of BCDT such as Rituximab, a human monoclonal Ab specific for CD20 expressed on the surface of B cells, increase the risk of severe infectious side effects that negatively impact quality of life. Therefore, further research is required to identify specific immune targets and mechanisms so that viable therapies for SLE patients can be developed.
D. SLE pathology
1. Autoreactive B cells in SLE and loss of B cell tolerance
Mouse models have contributed to our understanding of the pathogenesis of SLE. The most commonly used mouse strains that develop spontaneous disease include the F1 cross between New Zealand Black and New Zealand White (NZB/W) mice, MRL/lpr mice and BXSB/Yaa mice. Multiple genes contribute to the development of SLE in NZB/W mice, including MHC and several non-MHC genes (Rottman JB. 2010). The MRL/lpr strain contains the loss of function lpr mutation in the gene for Fas. Without Fas-Fas ligand interactions, apoptosis of B and T cells does not occur, resulting in massive lymphoproliferation that contributes to SLE (Kono DH. 2007, Rottman JB. 2010). MRL/lpr mice develop skin lesions and nephritis similar to human disease. SLE in mice closely resembles human SLE, and murine models provide a powerful tool to study and understand molecular mechanisms leading to disease pathogenesis.
29
the antigens themselves. Studies indicate that apoptotic nucleosomes are the inciting immunogens in SLE and subsequent recognition of additional self-antigens by B cells via “epitope spreading” to histones and dsDNA (Herrmann M. 1998, Gaipl US. 2007). Other evidence suggests that the expression of an array of autoantigens on the surface of apoptotic blebs (Casciola-Rosen LA. 1994)and the defective clearance of apoptotic debris (Herrmann M. 1998, Gaipl US. 2007) leads to autoAb formation. However since there are patients with dsDNA Abs who do not display detectable levels of anti-chromatin reactivity (Borchers AT. 2012), other mechanisms leading to anti-dsDNA reactivity are certainly important in the development of autoreactive B cells and autoAbs.
High autoAb titers are found in SLE patients. In the majority of SLE patients, anti-nuclear Abs (ANA) are found in the plasma and tissues (Tan EM. 1989). The
30 2. SLE patients have high plasma IFNα levels.
In addition to heightened autoAb titers, SLE patients also have an increased presence of Type I IFN in their plasma (Bekeredjian-Ding IB. 2005) (Berggren O. 2012). Patients with high IFNα levels develop more severe nephritis and a number of IFN-inducible genes are associated with SLE. Moreover, people receiving therapeutic IFNα have developed SLE-like conditions (Hueber W. 2004, Hua J. 2006). The significance of the association between IFNα and SLE is further strengthened by experiments in
murine SLE in which deletion of the IFNα receptor gene (ifnar) resulted in ameliorated disease (Hueber W. 2004, Means TK. 2005, Hua J. 2006). Type I IFN directly influences immune cells including B and T cells. IFNα induces the differentiation of monocytes into DCs and can activate immature myeloid DCs (mDCs). mDC mediate activation of autoreactive T cells and provides help to activate autoreactive B cells, thereby increasing the production of autoAbs (Means TK. 2005, Borchers AT. 2012).
Several lines of evidence exist that show endogenous RNA or DNA in the form of ICs can induce IFNα production by plasmacytoid DCs (pDCs) in healthy controls
31
more effective therapies for SLE is by targeting autoreactive B cells to eliminate autoAbs.
3. Identifying autoreactive B cells in SLE
As stated earlier, several B cell abnormalities exist in SLE patients (Budman DR 1977, Blaese RM 1980, Chan OT. 1999, Fecteau JF. 2006, Chang NH. 2008). These abnormalities are not attributable to a single subset of B cells, and, therefore do not identify autoreactive B cells. This inability to distinguish autoreactive from
non-autoreactive B cells has impeded our understanding of the molecular mechanisms that results in the loss of tolerance in human SLE and whether autoreactive B cells reside in the kidney. Studies of SLE peripheral blood have found distinct B cell subsets that correlate with disease activity. Wei et al found a novel population of B cells that lacked the expression of CD27 in the peripheral blood of SLE patients (Wei C. 2007). They found this population significantly associates with higher disease activity, a history of nephritis and disease specific autoAbs (anti-dsDNA, anti-Sm). Later, Jacobi et al found a subset of MBCs in the peripheral blood of some SLE patients that also significantly associated with disease activity including flares (Jacobi AM. 2008). This B cell subset was characterized by the expression of CD95 (CD27-CD95+).
32
cell tolerance. Our lab previously identified an expanded B cell population in peripheral blood of SLE and anti-neutrophil cytoplasmic autoantibody (ANCA)-associated vasculitis patients (Culton DA 2007, Nicholas M 2008). These B cells exhibit high expression of CD19 and CD20 and low expression of CD21 (referred to herein as CD19hi). The CD19hi population is expanded in ~30 percent of SLE patients where it comprises an average 8-10 percent of peripheral blood B cells, but can comprise >50 percent of peripheral blood B cells in some patients (Culton DA. 2007, Nicholas M. 2008). The presence of an expanded CD19hi B cell population in peripheral blood correlates with ESRD and neurological complications (Nicholas M. 2008), and high titers of certain autoAbs, including anti-Sm, a hallmark anti-ribonucleoprotein (RNP) autoAb of SLE (Nicholas M. 2008). Interestingly, the circulating anti-Sm B cells are CD19hi B cells and the anti-Sm titer correlates with the frequency of CD19hi B cells specific for Sm
(Nicholas M. 2008). These data suggest that CD19hi B cells contribute to disease, and therefore, understanding the function of CD19hi B cells may provide insight into disease mechanisms.
CD19hi B cells have an activated MBC phenotype. Several receptors are up regulated during the B cell activation process including the death receptors, FAS (CD95), and programmed cell death-1 (PD1). CD95 is expressed on the surface of many different cells and upon ligation with its ligand CD95L will signal the cell to
33
sensitive to CD95-induced apoptosis subsequent to CD40 engagement, and to be rescued from CD95-mediated apoptosis in the latter stages of their differentiation by Ab receptor engagement (Lagresle C. 1995, Mandik L. 1995, Watanabe D. 1995, Choe J. 1996). Such data suggest that CD95-CD95L interactions are an important factor in the elimination of autoreactive B cells.
34
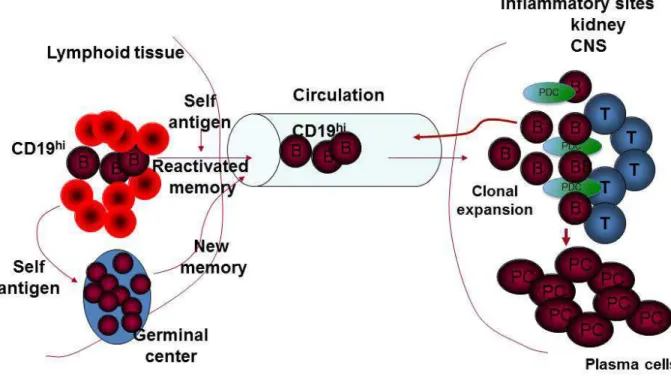
Figure 1.1. CD19hi B cells are trafficking to sites of inflammation. Autoreactive CD19hi B cells are reactivated by self-antigen in the lymphoid tissues. Once reactivated CD19hi B cells will migrate to inflammatory sites such as the kidneys or CNS. There we propose CD19hi B cells interact with CD4+ T cells (Tfh) to form GC. In GC the CD19hi B cells clonally expand and differentiate into PCs. T, T cells; CNS, central nervous system; PCs, plasma cells.
XII. SUMMARY OF DISSERTATION
In this PhD thesis, we examined the phenotypic and functional characteristics of B, T, and pDCs in the urine and blood from patients with SLE. We propose that CD19hi B cells are autoreactive and contribute to the progression of ESRD. To explore this hypothesis, we analyzed urine collected from SLE patients. The data presented herein reveal differences in the presence of B, T, and pDCs in the urine. We found that
35
LN patients further suggested a role for activated PBs in human SLE. Further analyses of these cells and of additional tissue biopsies will provide insight into the
immunopathology of the kidney in SLE.
Additionally, we found naïve and memory B cell subsets in the urine of rituximab-treated SLE patients. These data suggest that kidney-resident B cells are not
necessarily depleted by rituximab. Urine naïve and/or MBC populations in CD19hi patients included an expanded CD19hi B cell population. We found that the CD19hi population was enriched in autoreactive B cells and these cells could be activated to become PCs, contributing to clinical relapse.
36
Chapter 2: Immune cells and type 1 IFN in urine of SLE patients correlate with immunopathology in the kidney.
2.1 Introduction
Systemic lupus erythematosus (SLE) is a chronic autoimmune disease
characterized by the production of autoantibodies to intracellular proteins and nucleic acids (Tan EM. 1982) (Hochberg MC. 1997). The development of nephritis is a principal cause of morbidity and mortality in SLE, but the underlying
immunopathological mechanisms of nephritis are still largely unknown. Insight into human LN comes principally from analysis of kidney biopsy tissue obtained at the time of diagnosis. However, the scope of the possible analysis on biopsy tissue is limited and serial biopsies are difficult to obtain due to the invasive nature of the procedure. Thus, by themselves biopsies are ill-suited for following the progression of nephritis within an individual to understand mechanism or to guide therapy.
SLE patient urine may offer a window into inflammation in the kidney that would permit serial sampling and allow for more in depth phenotypic and functional analyses of immune cells. Mononuclear cells are present in the urine of patients with IgA
37
vasculitis (Sakatsume M. 2001). Moreover, effector memory T cells are reported to be in the urine of SLE patients with active nephritis, and a high urine CD4 T cell count is associated with proliferative nephritis and may be useful in monitoring response to treatment (Dolff S. 2010, Enghard P. 2012) (Enghard P. 2014).
Analysis of kidney biopsy has revealed the infiltration of both myeloid and
lymphoid cells, not all of which are known to be present in urine. Of these, B cells are of particular interest because they play a central role in LN through their ability to produce pathogenic autoantibodies (autoAbs), activate autoreactive T cells, and secrete
cytokines (Shlomchik MJ. 1994, Chan OT. 1999a, Chan OT. 1999b). B cells in the kidney of SLE patients are actively engaged in immune responses, including responses to kidney derived self-antigens (Sekine H. 2004). Kidney biopsies of LN patients have revealed that tubulointerstitial lymphocytic infiltrates exhibit either a diffuse distribution of B cells and plasmablasts (PBs) or plasma cells (PCs), or an organized pattern of T:B cell aggregates that can include germinal centers (GC) (Chang A. 2011). T:B
38
We previously identified an expanded B cell population in peripheral blood of SLE and ANCA-associated vasculitis patients that are enriched in autoreactive B cells (Culton DA. 2007), (Nicholas M. 2008). They exhibit high expression of CD19 and CD20 and low expression of CD21 (referred to as CD19hi). CD19hi B cells comprise 1-3% of peripheral blood B cells in healthy individuals, but in ~30% of SLE patients they
comprise an average of 8-10% of peripheral blood B cells with some patients reaching >20% (Culton DA. 2007), (Nicholas M. 2008). CD19hi B cells have a memory B cell phenotype, are somatically mutated, produce predominantly IgG, and are enriched in autoreactive B cells specific for Sm, a hallmark specificity of SLE (Culton DA. 2007), (Nicholas M. 2008). Patients with an expanded CD19hi population (CD19hi patients) differ in the repertoire of serum autoAbs compared to patients that lack an expanded CD19hi population (non-CD19hi patients). The expanded CD19hi population appears to be stable over time and correlates with end stage renal disease (ESRD) and
neurological complications (Nicholas M. 2008). Thus, we propose that CD19hi and non-CD19hi patients differ in the underlying mechanisms of disease, particularly in the kidney that might be reflected in urine cellular infiltrates.
39
addition to potentially providing insight into disease mechanism, urine immune cells may serve as biomarkers of disease progression and patient responsiveness to therapy. 2.2 Materials and Methods
2.2.1 HD and patient peripheral blood and urine samples.
Peripheral blood and urine samples were collected from 20 healthy donors (mean age: 37.3 years, range: 28-58, gender 16 females, 4 males) and 69 patients (mean age 41.2 years, range 22-77, gender 62 females, 7 males) with SLE and 5 disease controls (5 ANCA); in some cases, the same healthy control or patient was used on multiple occasions or in multiple experiments. Patients were included in this study after informed consent in accordance with our institutional internal review board, and fulfilled at least four of the established American College of Rheumatology 1997 revised criteria for SLE. Samples were gathered during routine clinic visits.
40 2.2.2 Cell surface staining and FACS analysis
For surface staining, cells were prepared as described above and stained on ice for 20 min and then washed twice with 1X PBS. The Abs used were as follows: anti-CD19APC, anti-CD19PAC BL, anti-CD19 PE-CY7, anti-CD20 APC-CY7, anti-IgD FITC, anti-IgG FITC, anti-IgM FITC, anti-CD38 PE-CY7, anti-CD3 PER CP, anti-CD4 APC, anti-CD4 PAC BL, anti-CD8 PAC BL, anti-CD21 PE, anti-CD303 PE, and anti-CD303 FITC (Biolegend, San Diego CA). To distinguish live cells, Pacific Orange was added at a concentration of 0.02 mg/ml to each sample and incubated at room temperature for 20 min, after which each sample was washed three times with FACS buffer.
2.2.3 WISH cell culture.
WISH cells, a human epithelial cell line (product no. CCL-25; American Type Culture Collection, Manassas, VA), were grown in minimum essential medium supplemented with L-glutamine (2 mM), HEPES (20 mM), penicillin (100 units/ml), streptomycin (100 ug/ml), and 10% fetal bovine serum at 37ºC in an atmosphere containing 5% CO2. To measure interferon regulated gene up regulation in patient plasma and urine, WISH cells were cultured at a density of 0.5 x 10⁵/0.1 ml in 96-well flat bottom plates containing media alone, recombinant human IFNα (BioSource International, Camarillo, CA) at 100 units/ml (Hua J. 2006), or 50% donor plasma or urine. After 6 hrs of incubation, WISH cells were lysed and stored at -70º C (Hua J. 2006).
2.2.4 Real-time quantitative PCR assay
41
Diego, CA) and 500 ng of RNA was reverse-transcribed to complementary DNA (c-DNA) in a 20 µl reaction using iScript cDNA Synthesis Kit (Bio-Rad Laboratories, Hercules, CA). The cDNA obtained from each sample was diluted 1:60, and 2 µl was amplified in a 20 µl real-time quantitative PCR reaction using 10 µM forward and reverse primers and the 2x iQ SYBR Green Supermix (Roche laboratories).
2.2.5 ELISpot assay
Anti-IgG and anti-IgM ELISpot protocols were described previously (Nicholas M. 2008). Briefly, 96-well filter plates were coated with anti-IgG or anti-IgM ( Bethyl
42 2.3. Results
2.3.1 B and T cells are present in patient urine.
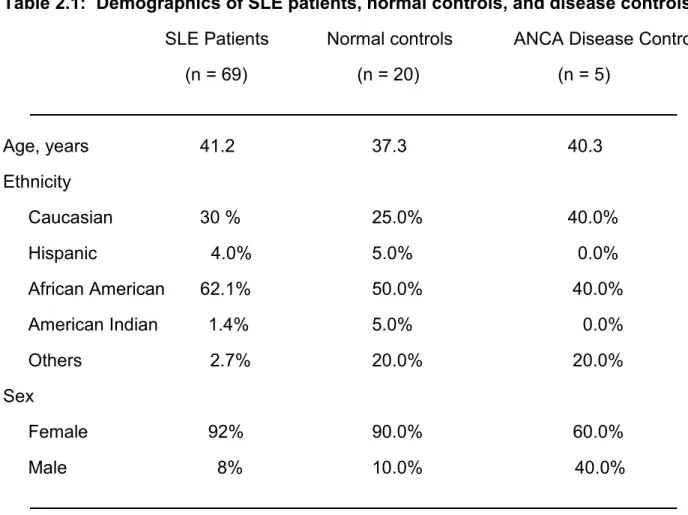
To determine whether B and T cells are present in patient urine, we collected blood and urine from 20 healthy donors (HD) and 69 SLE patients. Twenty-eight of these patients were non-LN patients and 41 were LN patients. Three of the latter had progressed to ESRD. In addition, we collected blood and urine from 5 ANCA-associated vasculitis patients as disease controls that were matched with LN patients for serum creatinine levels to approximate similar kidney function. This lupus patient cohort averaged 41.2 years of age and was 90% female and 62% African American (Table 2.1).
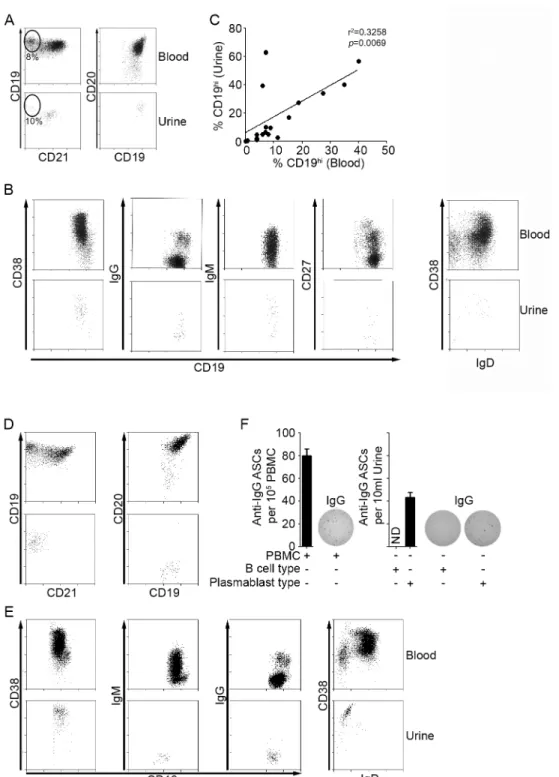
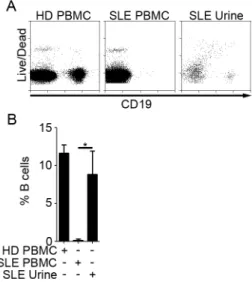
Mononuclear cells from patient urine were Ficoll-purified to eliminate non-cellular debris and stained for B and T cell markers for FACS analysis. As shown in Fig. 2.1A and Table 2.2, CD19+ B cells and CD3+ T cells were present in urine of 64% and 80% of patients, respectively. Only 20% of patients had neither cell type. On average, T cells were present at a higher frequency than B cells, and CD8 T cells were present at a higher frequency than double negative (DN) and CD4 T cells (Fig. 2.1B). Moreover, T cells were often found in the absence of B cells, but B cells were always accompanied by T cells. No lymphocytes were found in HD urine, and only T cells were found in disease control patient urine (data not shown).
LN and non-LN patients differed in the occurrence of urine lymphocytes.
43
cells in their urine. Thus, the prevalence of lymphocytes in the urine increases with the development of nephritis.
2.3.2 SLE patients segregate into two subsets based on urine B cell phenotype. To further analyze the B cells present in urine, we examined surface marker expression by FACS. Of the 44 patients with urine B cells, 23 had B cells that phenotypically resembled peripheral blood B cells. Most patients had a majority
population of naïve B cells (CD19+, CD20+, CD21+, CD38+, IgD+, IgM+, and IgG-) (Figs. 2.2A and 2.2B) with a minority population of switched memory B cells (CD19+ CD20+ CD38+/-, CD27+/-, IgD-, IgM+/-, and IgG+), although in 4 of 14 patients (28%) the switched memory B cells constituted the majority (Fig. S2.1). We refer to these B cells as
naïve/memory B cells. Patients with a high frequency of CD19hi B cells in peripheral blood also had a similarly high frequency of CD19hi B cells in their urine (Fig. 2.2A), and the frequency of CD19hi B cells in urine and peripheral blood correlated significantly (Fig. 2.2C). Two patients were an exception to this; they had very high frequencies of urine CD19hi B cells, but very low frequencies of peripheral blood CD19hi B cells. Interestingly, both were CKD patients.
The urine B cells in the remaining patients (21 of 44) had a PB or PC phenotype. They were CD19low, CD20-, CD21-, and CD38hi and did not express IgD, IgM, or IgG (Fig. 2.2D and 2.2E). Importantly, these cells spontaneously secreted IgG, as
determined by IgG ELISpot (Fig. 2.2F). Among the patients analyzed, we did not detect IgM-secreting cells. We refer to the Ig-secreting urine B cells as PB/PCs. As expected, the urine naïve/memory B cells did not secrete Ab of either isotype (Fig. 2.2F).
44
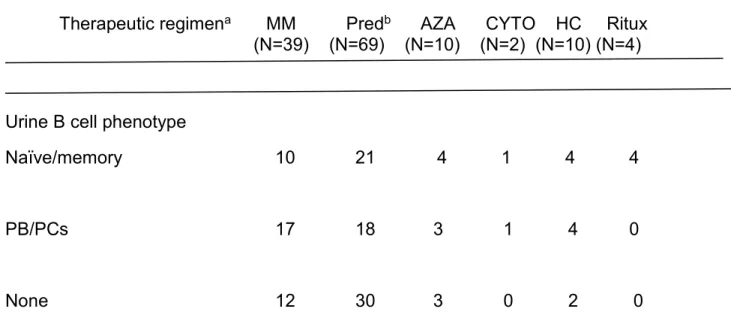
urine. Patients with urine naïve/memory and PB/PCs did not differ in treatment regimen (Table 2.3).
2.3.3 Urine B cells are likely of kidney origin.
Urine B and T cells could derive from several sources, such as the genitourinary tract, peripheral blood, and kidney. However, no patients at the time of urine collection were known to have a urinary tract infection and there was no evidence of red blood cells in the urine samples analyzed. Moreover, a direct peripheral blood origin could not account for the large subset of patients with urine PB/PCs, as analysis of paired
peripheral blood and urine from individual patients indicated that PB/PCs were a minor component of peripheral blood B cells in these patients (Fig. 2.2D and 2.2E, and data not shown). Strikingly, four patients had undergone B cell depletion therapy with rituximab, and in each case, despite the lack of B cells in peripheral blood,
naïve/memory B cells were present in urine (Fig. 2.3A and 2.3B). Thus, for these patients urine B cells cannot have derived directly from peripheral blood. Although we cannot exclude a direct peripheral blood origin for every patient, these observations, along with the finding that B cells and PB/PCs are present in kidney biopsy tissue from LN patients (Chang A. 2011, Sun C-Y. 2013), suggest that urine B cells derive from kidney resident populations.
2.3.4 The presence of PB/PCs in urine correlates with more severe LN.
45
p=0.0016; Fishers exact test) and all 3 ESRD patients had urine PB/PCs. Thus, the
presence of PB/PCs in the urine is associated with LN.
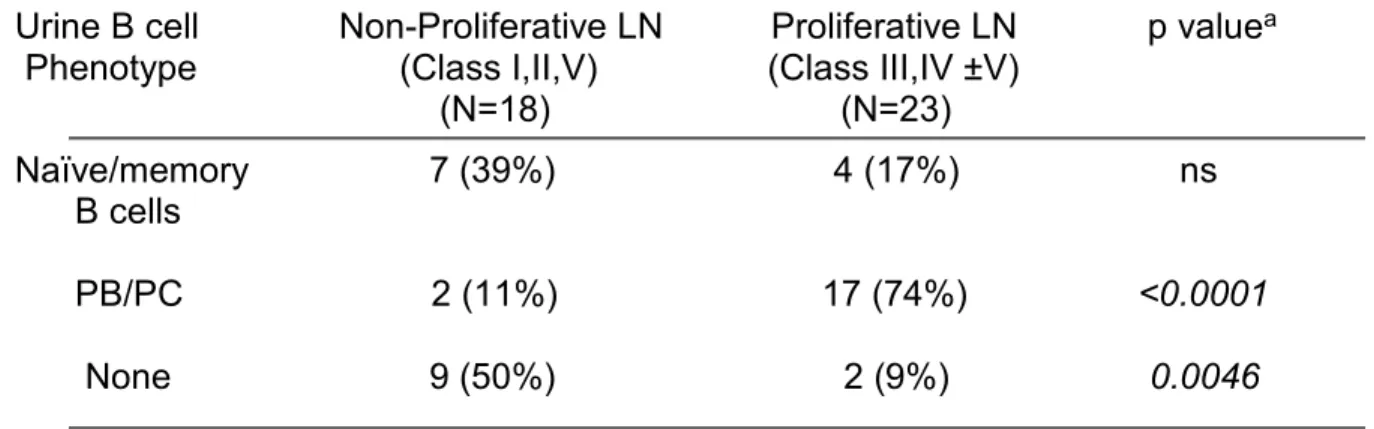
An association between urine B cell phenotype and glomerulonephritis class (ISN/RPS 2003 classification and WHO classification of LN) further suggested a link between urine B cells and LN. Eight-times as many patients with urine PB/PCs
presented with proliferative nephritis (class III or IV, with or without V) as membranous or non-proliferative nephritis (class I, II or V) (Table 2.7; p<0.0001). In contrast, 4.5-times as many patients with no urine B cells presented with non-proliferative or
membranous nephritis than proliferative nephritis. Patients with urine naïve/memory B cells tended to present more often with non-proliferative nephritis than proliferative nephritis, although the difference was not significant. Thus, urine B cell phenotype may reflect kidney pathology.
As a further measure of LN severity, we determined the estimated glomerular filtration rate (eGFR). As expected, patients with the lowest eGFRs were LN patients (Fig. 2.4A). Importantly, all LN patients with a low eGFR (<30) had urine PB/PCs and were CD19hi patients (Fig. 2.4B and 2.4C). Conversely, all but one patient with an eGFR >40 had urine naïve/memory B cells or no B cells, and they included CD19hi and non-CD19hi patients. Thus, CD19hi patients with urine PB/PCs appear more likely to develop a substantial loss of kidney function than patients with urine naïve/memory B cells or no urine B cells.
46
B cells or urine naïve/memory B cells were skewed toward inactive disease, although this did not reach statistical significance. In agreement with the significant association between urine PB/PCs and LN, we find that LN patients were more likely to have active disease than non-LN patients (Table 2.7; p=0.0244). CD19hi and non-CD19hi patients did not differ in disease activity (Table 2.7). Altogether, we find that patients with urine PB/PCs are more likely to have proliferative glomerulonephritis with a substantial loss of kidney function and to have active disease.
2.3.5 CD19hi SLE patients with urine PB/PCs had high urine IFNα/βα/βα/βα/β levels and a high frequency of urine pDCs.