ASSOCIATION BETWEEN MATERNAL DIETARY PATTERNS DURING PREGNANCY AND EARLY CHILDHOOD GROWTH OUTCOMES
Chantel LeAnn Martin
A dissertation submitted to the faculty at the University of North Carolina at Chapel Hill in partial fulfillment of the requirements for the degree of Doctor of Philosophy in the Department
of Epidemiology in the Gillings School of Global Public Health.
Chapel Hill 2015
Approved by:
Anna Maria Siega-Riz
Whitney Robinson
Julie Daniels
Daniela Sotres-Alvarez
© 2015
ABSTRACT
Chantel LeAnn Martin: Association between Maternal Dietary Patterns during Pregnancy and Early Childhood Growth Outcomes
(Under the direction of Anna Maria Siega-Riz)
Rates of childhood obesity have increased over the last few decades. Overweight and
obesity during childhood is associated with obesity in adolescence and adulthood, as well as
increased risk of immediate and long-term health consequences. Because the risk of child
obesity may be programmed before birth, understanding the role of the fetal environment is
imperative. Maternal diet quality during pregnancy is a modifiable factor that may influence the
development of child obesity; however, few studies have examined this association.
We used data from the Pregnancy, Infection, and Nutrition study, a prospective,
longitudinal pregnancy cohort, to examine the role of maternal dietary patterns during pregnancy
on maternal cardiometabolic markers and child growth from birth to 36 months. Dietary patterns
were derived using the Dietary Approaches to Stop Hypertension (DASH) diet and latent class
analysis (LCA). Three dietary patterns emerged from LCA characterized by high intakes of: 1)
hamburgers, hot dogs, bacon, French fries, fried chicken, white bread, and soft drinks; 2) some
vegetables, fruit juice, refined grains, mixed dishes, processed meat, and empty calorie foods;
and 3) fruits, vegetables, whole grains, low fat dairy, breakfast bars, and water. DASH scores
were categorized into tertiles.
Using multivariable linear regression, we found that healthier diet quality (highest DASH
levels compared to poorer diet quality (lowest DASH tertile and Latent Class 1). At 36 months,
there was suggestion of a positive association between higher maternal DASH score and BMI
z-score. Using linear mixed models, we found that, on average, children of mothers with a DASH
diet score <28, representing poorer diet quality, had a higher weight-for-height z-score from birth
to 36 months than children of mothers with a DASH diet score ≥28. We did not find evidence
that maternal DASH score influenced the rate of childhood growth from birth to 36 months.
Our results support maternal diet quality as a modifiable behavioral factor that may be
useful in intervention efforts to improve maternal cardiometabolic health during pregnancy and
reduce the burden of childhood obesity.
To God and my family,
ACKNOWLEDGEMENTS
This dissertation represents six years of hard work and would not be possible without the
support of so many individuals. I am deeply thankful for my dissertation committee members,
Drs. Anna Maria Siega-Riz, Whitney Robinson, Daniela Sotres-Alvarez, Julie Daniels, Eliana
Perrin, and Alison Stuebe, for their expertise, guidance, and support on this project. I am
grateful for my advisor and dissertation chair, Anna Maria Siega-Riz, for allowing me to develop
my independence as a researcher and offering invaluable mentorship during this process.
I am thankful for all of my friends at UNC who provided constant support and
encouragement. Especially my “PhDivas:” Ayodele Gomih, Patsy Polston, Kapuaola Gellert,
Tandrea Hilliard, and Kristin Black. I also acknowledge my peers in the Epidemiology program
for making this journey enjoyable. I have learned so much from you. I appreciate the financial
support provided by the Eunice Kennedy Shriver National Institute of Child Health and Human Development Reproductive, Perinatal, and Pediatric training grant and the National Institute of
Diabetes and Digestive and Kidney Diseases F31 pre-doctoral fellowship.
Last but certainly not least, I thank my parents, brother, boyfriend, immediate and
TABLE OF CONTENTS
LIST OF TABLES ...x
LIST OF FIGURES ... xi
LIST OF ABBREVIATIONS ... xii
CHAPTER I: INTRODUCTION ...1
CHAPTER II: LITERATURE REVIEW ...3
Childhood Obesity ...3
Proposed Biological Mechanism ...5
Epidemiologic Evidence ...7
Research Gaps ...11
Innovation And Significance ...12
CHAPTER III: METHODS ...14
Study Design ...14
Study Population ...15
Exposure Assessment...19
Outcome Assessment ...22
Covariates ...23
Statistical Analysis Plan ...26
CHAPTER IV: MATERNAL DIETARY PATTERNS AND CARDIOMETABOLC MARKERS DURING PREGNANCY ...28
Methods...30
Results ...36
Discussion ...38
Conclusions ...42
CHAPTER V: MATERNAL DIETARY PATTERNS DURING PREGNANCY AND CHILD GROWTH FROM BIRTH TO 36 MONTHS...52
Introduction ...52
Methods...54
Results ...59
Discussion ...60
Conclusions ...63
CHAPTER VI: CONCLUSIONS ...70
Summary Of Findings ...70
Study Limitations ...72
Study Strengths ...73
Public Health Implications ...74
Direction Of Future Research ...76
APPENDIX I. COMPARISON OF ELIGIBLE PIN POSTPARTUM STUDY PARTICIPANTS AND NON-PARTICIPANTS ...79
APPENDIX II. COMPARISON OF ELIGIBLE PIN KIDS STUDY PARTICIPANTS AND NON-PARTICIPANTS ...80
APPENDIX III. DASH SCORING METHOD ...81
APPENDIX IV. FOOD ITEMCATEGORIZATION FOR LATENT CLASS ANALYSIS ...82
APPENDIX VI. MATERNAL LATENT CLASS AND CHILD BMI Z-SCORE
AT 36 MONTHS ...86
APPENDIX VII. LINEAR MIXED MODEL RESULTS FOR LATENT CLASS
ANALYSIS AND CHILD WEIGHT-FOR-HEIGHT Z-SCORE ...87
APPENDIX VIII. PREDICTED CHILD WEIGHT-FOR-HEIGHT Z-SCORE ...88
LIST OF TABLES
Table 1. Distribution of maternal characteristics by DASH score tertile or
latent dietary class, Pregnancy, Infection, and Nutrition (PIN) study, (n=513) ...43
Table 2. Distribution of maternal dietary factors and cardiometabolic markers
(mean ± SD) by DASH score tertile or latent dietary classes ...45
Table 3. Linear regression analysis for fasting glucose and total cholesterol according to DASH score tertile and latent dietary classes in 513 pregnant
women, Pregnant, Infection, and Nutrition (PIN) study, 2001-2005...46
Table 4. Ratio of geometric mean for fasting insulin, HOMA-IR, and triglycerides (outcomes with non-normal distributions) according to DASH score tertile and latent dietary classes in 513 pregnant women, Pregnancy,
Infection, and Nutrition (PIN) study, 2001-2005...47
Table 5. Select maternal and child characteristics: Means (SD) and
percentages in the Pregnancy, Infection, and Nutrition study, (n=430) ...65
Table 6. Dietary and energy intake according to DASH score tertiles,
Pregnancy, Nutrition, and Infection study (n=430) ...66
Table 7. Association between maternal DASH diet score during pregnancy and child BMI z-score at 36 months of age in Pregnancy, Infection, and
Nutrition study excluding preterm births (n=276) ...67
Table 8. Linear mixed model results of the association between DASH adherence score and child weight-for-height z-score from birth to 36 months
LIST OF FIGURES
Figure 1. Potential biological pathways linking overnutrition to childhood
obesity ...6
Figure 2. Flow chart of PIN studies that will be included in the
proposed dissertation research ...18
Figure 3. A simplified conceptual model of the dietary pattern-cardiometabolic
markers association and adjustment for pre-pregnancy BMI ...49
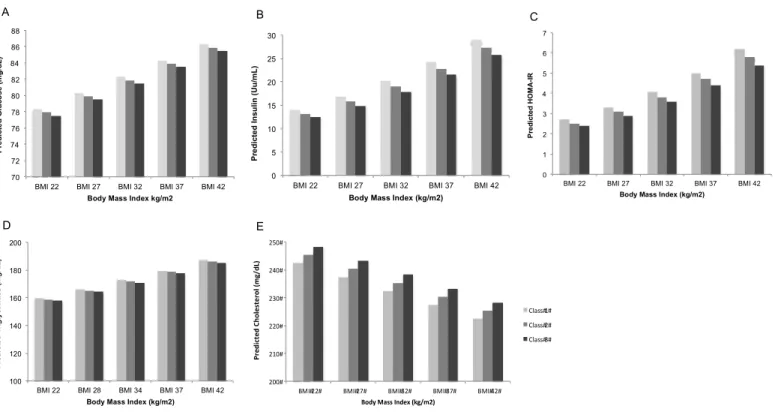
Figure 4. Predicted mean level for fasting A) Glucose, B) Insulin, C) HOMA-IR, D) Triglycerides, and E) Cholesterol according to DASH score tertile for women at varying pre-pregnancy BMI levels in the (PIN) study (n=513). Predicted means adjusted for maternal age, race, parity, smoking status during pregnancy, % poverty level, physical activity (median),
and energy intake (median) ...50
Figure 5. Predicted mean level for fasting A) Glucose, B) Insulin, C) HOMA-IR, D) Triglycerides, and E) Cholesterol according to latent class for women at varying pre-pregnancy BMI levels in the (PIN) study (n=513). Predicted means adjusted for maternal age, race, parity, smoking status during pregnancy, % poverty level, physical activity (median),
and energy intake (median) ...51
Figure 6. Predicted child weight-for-height z-score from birth to 36 months of age according to DASH adherence score in the Pregnancy, Infection, and
LIST OF ABBREVIATIONS
AHEI Alternate Healthy Eating Index
AIC Akaike’s Information Criteria
BMI Body Mass Index
CDC Centers for Disease Control and Prevention
CI Confidence Interval
DASH Dietary Approaches to Stop Hypertension
HOMA-IR Homeostasis Model for Assessment of Insulin Resistance
kcals kilocalories
LCA Latent Class Analysis
LGA Large-for-gestational age
MET Metabolic Equivalent
NHANES National Health and Nutrition Examination Survey
NND New Nordic Diet
PIN Pregnancy, Infection, and Nutrition
RCT Randomized Controlled Trial
SD Standard Deviation
SGA Small-for-gestational age
UNC University of North Carolina
US United States
USDA United States Department of Agriculture
WHZ Weight-for-Height z-score
CHAPTER I: INTRODUCTION
Animal studies suggest that maternal overnutrition—defined as poor maternal diet quality,
high maternal body mass index (BMI), and the presence of gestational diabetes—influences the
development of offspring obesity by altering fetal energy regulation, appetite regulation, and
adipocyte metabolism (1, 2). Despite this evidence from animal literature, the relationship is not
well understood in human populations, where the focus is mainly on maternal BMI and
gestational diabetes. Further, animal studies demonstrate that diet quality may play a more
important role in offspring weight status than the intake of macronutrients and individual foods.
Specifically, pregnant rats fed “high-fat” and “junk food” diets produced obese offspring (3-6).
Unfortunately, there is limited research in humans to support animal findings about diet quality
during pregnancy.
Analyses of dietary patterns have become useful in epidemiological studies aimed to
investigate the overall quality of diet on health outcomes. Dietary patterns involve examination
of the combinations of foods and nutrients eaten together, while allowing for the interaction and
synergism between nutrients (7). Dietary patterns can be assessed using a priori score-based methods, based on dietary guidelines and recommendations, and a posteriori data-driven approaches using statistical methods (7, 8). These approaches translate at a population level
making them ideal for public health interventions and applicable to clinical settings.
Although no epidemiological studies have examined the association between maternal
dietary patterns during pregnancy and early childhood growth, studies on fetal growth outcomes
trials (RCTs) in pregnant women have shown the effectiveness of using healthy maternal dietary
patterns in lowering women’s glucose and lipid profiles; however, the results have limited
generalizability (9-11).
This dissertation research utilized repeated anthropometric measures from the Pregnancy,
Infection, and Nutrition (PIN) study, a longitudinal, prospective cohort, to expand existing
literature by investigating the role of maternal dietary patterns on early childhood growth.
Further, we explored whether maternal cardiometabolic markers during pregnancy could be an
important biological mechanism for this association in humans.
Specifically, we investigated the following aims:
Aim 1. To examine the relationship between maternal dietary patterns and the following cardiometabolic markers during pregnancy: glucose, insulin, insulin resistance (HOMA-IR), triglycerides, and total cholesterol
Aim 2. To determine the association between maternal dietary patterns during pregnancy and early childhood growth outcomes from birth to 36 months
SubAim 2a: To investigate the effects of maternal dietary patterns on offspring weight status at 36 months, defined by BMI z-score
CHAPTER II: LITERATURE REVIEW
Childhood Obesity
Burden of Childhood Obesity
Obesity is one of the leading global public health issues. Worldwide, an estimated 45
million children are overweight or obese and another 92 million are at risk of becoming
overweight (12). In the US, 16.9% of children and adolescents ages 2-19 years are classified as
obese (age and sex specific BMI ≥95th percentile) (13). In the early childhood period, 8.4% of
children 2-5 years of age are obese and 22.8% are overweight (age and sex specific BMI ≥85th
percentile), while 8% of infants and toddlers <2 years of age are obese (13). Socioeconomically
disadvantaged populations experience the highest rates of child obesity. Among children 2-5
years of age, the prevalence of obesity is 11.3% for non-Hispanic blacks and 16.7% for
Hispanics compared to only 3.5% for non-Hispanic whites (13).
Overweight and obesity are the second leading behavioral causes of death in the US, only
behind smoking (14). Studies indicate that these weight conditions during childhood have both
short-term and long-term health consequences. Children living with obesity are more likely to
be obese in adolescence and adulthood (15). In a previous study, children classified as
overweight or obese in early childhood and adolescents were more likely to be obese as adults
than children and adolescents who were normal weight (16). The growing rates of type 2
diabetes, metabolic syndrome, and atherosclerosis in children are attributed to the increased
health conditions such as hypertension, ischemic heart disease, stroke, asthma, and even
premature adult mortality (18-20). Childhood obesity also has psychosocial consequences.
Studies indicate that obese children are more likely to suffer from negative self-confidence and
self-esteem, poor socialization, and depression during childhood and adolescence (17, 18).
Nationally, overweight and obesity costs more than $110 million dollars, with the direct medical
expense of overweight and obesity comprising between 5-10% of US healthcare spending (21).
Measurement of Child Body Size
Obesity is defined as excess body fat, and ideally is based on a measure of body fat
percentage or total fat mass (19). Unfortunately, measures of adiposity, such as dual energy
x-ray absorptiometry and hydrostatic weighing, have limited practical use in epidemiological
studies. Although direct measures would provide the most accurate measures of body
composition, utilization of these instruments in large epidemiological is not cost-effective. Proxy
measures of body fat are most widely used in epidemiological studies because of their low cost
and noninvasiveness. The most frequently used measures to approximate body fat include BMI,
weight, and waist circumference. Higher weight does not necessarily represent greater adiposity,
as it includes muscle mass, bones, organs, and fat in the measure. Waist circumference provides
a measure of central adiposity. BMI is a relative measure of excess weight-for-height, as
indicated in the calculation (weight in kilograms/height in meters2), and is most often used in
epidemiological studies.
Estimation of body size in children requires special consideration to account for the
natural growth patterns throughout childhood (22). Measures such as weight, height, and BMI
population in children up to 19 years of age. Percentiles are used to classify children as
overweight and obese, which are clinical definitions of excess body fat. A child is categorized as
overweight when their value is greater than or equal to the 85th percentile and as obese when
their value is greater than or equal to the 95th percentile. The use of these cutoffs minimizes
misclassification and incorporates varying levels of health risks (23). Z-scores are calculated by
taking the difference between the child’s value and the mean value in the reference population
divided by the standard deviation in the reference population. Several measures can be used for
z-score calculation; however, BMI, weight-for-age, length-for-age, and weight-for-height are
most commonly used. Our study utilized repeated measures of weight-for-height z-score to
examine child growth and BMI z-score to examine weight status at 36 months in relation to
maternal dietary patterns during pregnancy.
Proposed Biological Mechanism
In the early 1990s, David Barker hypothesized, based on available epidemiologic
evidence, that the origins of adult chronic diseases began prior to birth (24). Barker’s proposal
became known as the fetal origins hypothesis, which acknowledged the importance of fetal life
as a critical period for lifelong health. Given the recent rise in obesity rates, particularly among
children and adolescents, researchers have become increasingly interested in understanding the
role of the intrauterine environment on the origins of obesity (25-27). While obesity is a
complex condition with biological, social, behavioral, and environmental determinants,
identification of modifiable risk factors during fetal development could be vital in reducing the
burden of childhood obesity. One potential mechanism that could explain a biological link
overnutrition hypothesis proposes that an intrauterine environment—characterized by poor
maternal diet quality, high maternal body mass index (BMI), and the presence of gestational
diabetes — alters fetal energy regulation, appetite regulation, and adipocyte metabolism,
resulting in increased fetal/neonatal adiposity and subsequently high childhood and adult BMI (1,
2). Increased fetal concentrations of cardiometabolic markers are the proposed mechanistic link
between maternal overnutrition and offspring BMI (Figure 1).
Compelling research from experimental studies in animals shows that an intrauterine
environment characterized by overnutrition may contribute to the programming of offspring
obesity development. In pregnant rats, maternal overnutrition during gestation produced
up-regulation of placental nutrient transport, influencing offspring hypothalamic appetite up-regulation
and glucose homeostasis, resulting in greater adiposity later in life (28, 29). Pregnant rats fed
high-fat chow experienced higher plasma triglyceride, insulin, leptin, and HOMA-IR levels
compared to pregnant rats fed regular chow (29). Furthermore, pregnant rats fed high-calorie
and/or high-fat diets during gestation also produced offspring with greater risk of obesity (3-6).
Bayol et al. (4) found through experimentation that feeding pregnant Wister rats “cafeteria” diets,
comprised of appetizing foods with a high fat and/or high sugar content, resulted in offspring
with impaired skeletal muscle development and metabolic disorders (4). In a study examining
the effects of maternal dietary lipid intake, independent of postnatal growth and nutrition, the
offspring of mice fed high-fat diets during gestation accrued greater fat mass than offspring of
mice fed low-fat diets, irrespective of maternal pre-pregnancy adiposity (6). While the maternal
overnutrition hypothesis includes maternal BMI, gestational diabetes, and maternal diet,
evidence supporting an association between maternal BMI and diabetes on offspring adiposity in
human populations is more abundant in the literature (30-36). However, the role of maternal diet
in the overnutrition hypothesis is less understood; hence the focus of this dissertation research.
Epidemiologic Evidence
Maternal diet and cardiometabolic markers during pregnancy
During pregnancy, maternal diet is associated with several maternal cardiometabolic
carbohydrates in the diet, is positively associated with plasma glucose levels and insulin
sensitivity and insulin resistance indices (37, 38). In fact, pregnant women consuming a high
glycemic carbohydrate diet during pregnancy experienced a 190% increase in blood glucose
response compared to women consuming a low glycemic carbohydrate diet (39). Two previous
RCTs during pregnancy demonstrated a beneficial effect of maternal diet on cardiometabolic
markers. Among Iranian women with gestational diabetes, adherence to the Dietary Approaches
to Stop Hypertension (DASH) eating plan during a 4-week study period resulted in lower fasting
plasma glucose, serum insulin, HOMA-IR score, and total cholesterol, as well as improved
glucose tolerance compared to women randomized to a control diet (10, 11). In addition,
pregnant women randomized to a diet encouraging greater consumption of fish, low-fat meats
and dairy products, oils, whole grains, fruits, vegetables, and legumes during pregnancy had
lower total cholesterol levels compared to pregnant women in the control group (9). Further,
higher maternal glucose, insulin resistance, and triglycerides levels during pregnancy are
associated with higher birth weight (40-43), increased risk of large-for-gestational age (LGA)
(40, 44), increased neonatal adiposity (45, 46), greater weight gain and adiposity in the first 12
months (41, 47), and increased risk of child obesity at 3 years of age (30).
Maternal diet and childhood growth outcomes
Several studies have examined the association between maternal diet and early childhood
growth outcomes. This research has mainly focused on a single macronutrient or individual food
in relation to fetal growth parameters (37, 48-56). The existing literature examining maternal
diet during pregnancy and early childhood growth have produced mixed results, although
composition of macronutrient intake, and only three of the five studies found an association.
Higher intakes of sugar and higher glycemic index and glycemic load were associated with
increased risk of child overweight/obesity at 5 years of age (57) and increased offspring fat mass
at 4 and 6 years of age (60). Additionally, increased total trans fatty acid intake during the second trimester was positively associated with fetal growth z-score (54). Based on findings
from the animal literature, diet quality may have more importance than intake of macronutrients
and individual foods in relation to child growth outcomes; however, few studies have examined
this in human populations.
Conventional analyses of individual foods and nutrients have several limitations (8,
62-65). Diet does not consist of foods and nutrients in isolation, but instead many foods and
nutrients that are eaten in combination, which likely have interactive and synergistic effects on
human health. Therefore, single effect of a nutrient may be too small to detect; however, the
cumulative effects of many nutrients in a dietary pattern may be large enough to detect an
association. Also, nutrient intakes are often associated with dietary patterns leading to
confounded analyses in studies of single nutrients. Lastly, multiple analyses of single foods or
nutrients may yield statistically significant results by chance because of the number of tests
conducted. In lieu of single food and nutrient analyses, dietary patterns are commonly used in
epidemiological studies as a measure of overall quality of the diet. Dietary patterns examine
combinations of foods and nutrients eaten together allowing for assessment of the interaction and
synergistic effects between nutrients on health. Dietary patterns can be assessed using a priori
examine maternal dietary patterns in pregnancy; however, only in relation to fetal growth
outcomes.
To date, five studies have utilized data-driven methods to examine the association
between maternal dietary patterns, and fetal growth outcomes. In these studies, researchers most
commonly used factor analysis to derive dietary patterns (66-70). Using data from the US
Hispanic Health and Nutrition Examination Study, Wolff et al. (66) found in Mexican Americans
a nutrient-dense pattern (fruits, vegetables, and low fat dairy) and a protein rich pattern (dairy
desserts, low fat meats, and processed meats) were associated with increased birth weight, while
a nutrient-dilute pattern (salty snacks, non-dairy, and sugar) was associated with decreased birth
weight. In contrast, no association was found between an energy-rich pattern (bread, margarine,
and nuts) and birth weight in a study among pregnant Dutch women (69). Healthier dietary
patterns were associated with decreased odds of small-for-gestational age (SGA) in two separate
studies (67, 68). In a cluster analysis among women participating in the Osaka Maternal and
Child Health Study, the meat and eggs eating pattern and the wheat products eating pattern were
associated with an increased odds of SGA (71).
Few studies have examined the association between maternal dietary patterns and child
weight outcomes using score-based methods, in which all focused solely on fetal growth
outcomes. Using the Alternate Healthy Eating Index (AHEI), a diet index examining intake of
vegetables, fruit, nuts and soy, ratio of white meat to red meat, cereal fiber, trans fat, alcohol, and long-term multivitamin use, researchers showed that a higher AHEI score was associated
with greater birth weight and lower odds of fetal growth restriction for weight and for head
circumference (72). Hillesund et al., (2014) derived a New Nordic Diet (NND) score based on
whole grain breads, oatmeal porridge, foods from wild countryside, milk, and water (73). A
higher NND score compared to a lower NND score was associated with decreased odds of SGA
and increased odds of LGA. In two separate studies, a Mediterranean-style Diet was associated
with lower risk of fetal growth restriction (74) and lower placental weight and birth size (75).
Research Gaps
Together, animal and human studies offer some support of the overnutrition hypothesis as
it relates to maternal diet. Previous research suggests an association between maternal diet
quality and cardiometabolic markers during pregnant, as well as maternal diet quality and
childhood anthropometric parameters. Dietary patterns provide an approach to measure overall
quality, which is an advantage over single nutrient and food analyses. To our knowledge, no
previous study has examined the role of maternal dietary patterns during pregnancy on early
childhood growth patterns. In the studies that have assessed the association between maternal
diet and childhood growth outcomes, methodological issues, such as limited generalizability,
recall bias, and limited confounding control, restrict the interpretation of the findings. A recent
systematic review and meta-analysis on the effects of dietary interventions on neonatal and
infant outcomes demonstrated the need for more research to identify ideal maternal dietary
intakes that optimize neonatal and infant anthropometric outcomes (76).
In addition, research literature on maternal dietary patterns and maternal cardiometabolic
markers during pregnancy is scarce. Despite the indication of an association between maternal
diet quality and cardiometabolic markers during pregnancy based on previous findings, we only
found two studies that have examined the association using dietary patterns. In the two previous
limitations such as small sample sizes, homogenous study populations, and women with
gestational diabetes, which reduces generalizability.
Innovation and Significance
This dissertation research compares two separate approaches for assessing dietary
patterns—a priori score-based and a posteriori data-driven. The Dietary Approaches to Stop Hypertension (DASH) eating plan is a score-based approach that examines the overall
healthiness of the diet and has beneficial effects on components of the metabolic syndrome and
metabolic profiles in pregnant women (10, 11). Additionally, the DASH dietary components are
representative of the current Dietary Guidelines for Americans. We utilized latent class analysis
(LCA) as the data-driven method in this dissertation research (77, 78). With LCA, women are
categorized into mutually exclusive groups with similar eating habits.
Previous research on maternal diet and child growth outcomes has mainly focused on
fetal growth and birth weight. Our study examines growth outcomes from birth through the first
36 months of life. It is well known that higher growth rates and adiposity during early infancy
are associated with an increased risk of later development of overweight/obesity (79-82). The
use of repeated measures in the first 36 months of life contributes to the scarce body of research
on maternal diet and early childhood growth patterns.
This dissertation research has potential for significant public health impact. With over
30% of U.S. children and adolescents classified as overweight and 17% obese (13), maternal diet
quality is a modifiable behavior that could have a role in childhood growth by influencing
glucose and lipid metabolism during pregnancy. We utilized data from a longitudinal,
patterns in relation to maternal cardiometabolic markers during pregnancy and the following
childhood growth outcomes: BMI z-score at 36 months of age and longitudinal changes in
weight-for-height z-scores from birth to 36 months. Most crucially, this research study
contributes to the understanding of one potential mechanism in the early origins of obesity that
CHAPTER III: METHODS
The purpose of this dissertation was to determine the impact of maternal dietary patterns
during pregnancy on maternal cardiometabolic markers and early childhood growth outcomes.
We utilized data from the Pregnancy, Infection, and Nutrition (PIN) study. Multivariable linear
regression and linear mixed effects regression were used to examine the specific aims. The
following sections will detail the study design and population, data collection, and statistical
analyses.
Study Design
To investigate the role of maternal dietary patterns on short-term cardiometabolic
markers during pregnancy and early childhood growth, we conducted a secondary data analysis
using data from the PIN study, a prospective longitudinal cohort study examining risk factors for
preterm birth (83). Our first specific aim used data collected from women participating in the
third cohort of the PIN study (PIN 3). Our second aim included eligible mother-child pairs from
the PIN 3 study who participated in the follow-up studies at 3 and 12 months (PIN Postpartum)
and 36 months (PIN Kids) postpartum. All PIN study protocols were reviewed and approved by
the Institutional Review Boards of the School of Medicine at the University of North Carolina
Study Population PIN 3-Prenatal
For the PIN 3 study (2001-2005), women who were less than 20 weeks’ gestation were
recruited from private and public prenatal clinics at UNC Hospitals. Women were excluded if
they were under 16 years of age, did not speak English, greater than 20 weeks’ gestation,
carrying multiple gestations, no telephone accessibility, or planned to continue care or deliver at
a different site. Pregnant women who agreed to participate signed informed consent and provided
basic demographic data to schedule the first telephone interview. Interviews were completed at 2
research clinic visits (15-20 weeks’ gestation and 24-29 weeks’ gestation), during 2 telephone
interviews (17-22 weeks’ gestation and 27-30 weeks’ gestation), and following delivery at the
hospital. Data collection via the telephone interviews and self-administered questionnaires
solicited information on sociodemographic characteristics, psychosocial factors, dietary intake,
physical activity, other health behaviors, medical history, and prior birth outcomes. Biological
specimens were collected at the first and second research visits and the placenta was collected at
delivery. Medical abstraction was conducted for information on reproductive history, gestational
weight gain, pregnancy complications, medical lab values, and labor and delivery events. A total
of 1,875 pregnant women (2,006 pregnancies) were enrolled into the prenatal component of the
prenatal study.
PIN Postpartum
The PIN Postpartum study, which began in 2002, was a longitudinal study designed to
examine factors related to postpartum weight retention. PIN Postpartum included home visits at
postpartum study recruitment period began, were eligible for participation in the follow-up study.
Women who had a pregnancy loss, did not complete the first telephone interview, or delivered at
a hospital other than UNC were not included. A total of 1,169 (62%) from the PIN 3 study were
eligible to participate. Four hundred and eighty women were not included in the PIN Postpartum
study for the following reasons: 24 had medical constraints, 153 were unreachable, 187 refused
to participate, and 116 had timing or scheduling issues (Figure 2). A total of 689 (73%) eligible women agreed to participate and completed a 3-month interview. Women who became pregnant
during the follow-up period (n=25) or moved outside of the catchment area or became
unreachable (n=73) were excluded from participation in the 12-month visit. An additional 11
women requested to leave the study and 10 were excluded for other reasons, resulting in 550
mother-child pairs participating in the 12-month interview. During these home visits
information on maternal socio-demographics, which may have changed since the prenatal period
were collected, as were diet, smoking, vitamin/mineral supplement use, medications, health
status, physical activity, neighborhood characteristics, psychosocial measures, and body image.
Maternal weight and height were measured. For the child, information on breast or
bottle-feeding, diet, anthropometry, illnesses and childcare were also collected. The study provided
doctor cards to the mothers so that during pediatrician visits, a health care provider could record
the child’s weight and height.
PIN Kids
PIN Kids began in 2004 and followed-up with the index child at 36 months of age.
Children were only able to participate in this study if their mothers participated in PIN 3 and PIN
recruited to participate, there were 409 mother-child pairs who completed the 36-month visit
(Figure 2). At the 36-month study visit, data were collected on child’s diet, physical activity, hospitalizations, health status, and participation in childcare. PIN research staff measured the
child’s weight and height during the home visit. Updated socio-demographic information for the
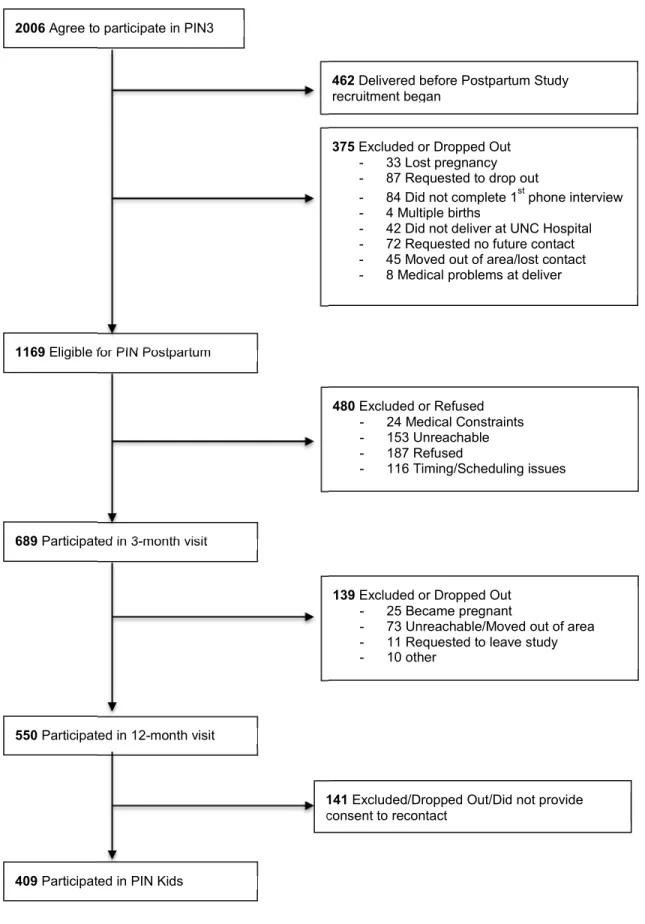
Figure 2. Flow chart of PIN studies that will be included in the proposed dissertation research
2006 Agree to participate in PIN3
462 Delivered before Postpartum Study recruitment began
375 Excluded or Dropped Out - 33 Lost pregnancy - 87 Requested to drop out
- 84 Did not complete 1st phone interview - 4 Multiple births
- 42 Did not deliver at UNC Hospital - 72 Requested no future contact - 45 Moved out of area/lost contact - 8 Medical problems at deliver
1169 Eligible for PIN Postpartum
480 Excluded or Refused - 24 Medical Constraints - 153 Unreachable - 187 Refused
- 116 Timing/Scheduling issues
689 Participated in 3-month visit
139 Excluded or Dropped Out - 25 Became pregnant
- 73 Unreachable/Moved out of area - 11 Requested to leave study - 10 other
550 Participated in 12-month visit
141 Excluded/Dropped Out/Did not provide consent to recontact
We examined distributions of select baseline maternal characteristics for PIN 3
mother-child pairs who were eligible but did not participate in PIN Postpartum (n=480) versus those who
participated in PIN Postpartum (n=689). Eligible mothers who did not participate in the PIN
Postpartum study were younger, had a higher pre-pregnancy BMI, and were more likely to be
Black, unmarried, and had a lower education and household income than women participating in
the PIN Postpartum study (Appendix 1). Similarly, we compared distributions of select baseline maternal characteristics for PIN Postpartum mother-child pairs who were eligible but did not
participate in PIN Kids (n=280) versus those who did participate in PIN Kids (n=409). Women
who participated in PIN Postpartum but not in PIN Kids were younger and more likely to be
Black, unmarried, have lower education level and lower household income, and obese prior to
pregnancy (Appendix 2).
Exposure Assessment
Maternal diet during pregnancy was collected at 26-29 weeks gestation with a
self-administered, semi-quantitative, 119-item Block food frequency questionnaire (FFQ) to reflect
dietary intake over the previous three months. Detailed information on the validity of the FFQ
has been described elsewhere (77, 84, 85). Dietsys+Plus version 5.6 with an updated food
composition table based on nutrient values from the National Health and Nutrition Examination
Survey (NHANES) III and United States Department of Agriculture (USDA) 1998 nutrient
databases were used to calculate daily energy intake in calories (kcals) and grams per day from
the FFQ data.
Vegan and Vegetarian. Our research focused on the score-based and data-driven methods.
Score-based approaches are based on dietary recommendations or prior knowledge on the subject
area (7). Individual’s adherence to the score-based dietary pattern is estimated using a summary
score. Data-driven approaches utilize statistical techniques, like factor and cluster analyses, to
derive eating behaviors based on dietary data collected from diet assessment instruments. To
characterize overall diet quality, the Dietary Approaches to Stop Hypertension (DASH) diet was
used as the a priori method, while latent class analysis (LCA) was used as the a posteriori
approach.
Method 1: Dietary Approaches to Stop Hypertension (DASH) diet.
The National Heart, Lung, and Blood Institute extensively promotes the DASH diet for
prevention and treatment of hypertension based on results from the DASH randomized
controlled trial (86). The DASH diet places emphasis on eight food components: fruits,
vegetables, nuts and legumes, low fat dairy, whole grains, sodium, red and processed meat,
sugar-sweetened beverages, and sodium (Appendix 3). We used a previously developed scoring algorithm, where individuals are scored based on their quintile of intake (87). Briefly, high
intake of fruits, vegetables, nuts and legumes, low fat dairy, and whole grains were assigned one
point for each quintile ranking (e.g. bottom quintile = 1 point, top quintile = 5 points). Sodium,
red and processed meat, and sweetened beverages were reversed scored and the bottom quintile
of intake received five points, while the top quintile received one point. Each component’s score
was summed to derive a total DASH adherence score for each participant, which could range
Method 2: Latent Class Analysis (LCA)
We chose latent class analysis (LCA) as the data-driven approach to derive dietary
patterns from the FFQ data, which classifies women into mutually exclusive groups. The
methodology for deriving mutually exclusive groupings is described in full detail in previous
studies (77, 78). The number of food items used to derive the latent classes were reduced from
119 to 105 due rarely consumed food items that were excluded (< 10%) and combining low-fat
milks (skim, 1%, and 2%) into one group due to small cell counts. Because many of the food
items had skewed distributions due to high prevalence of non-consumers, we used categories of
intake were utilized. Food items with a high prevalence of consumption (non-consumption
<10%; n=17 items), such as green beans and pizza, were dichotomized at the median. Food items
with a low prevalence of consumption (non-consumption >70%; n=8), like grapefruit and whole
milk, were dichotomized as consumed vs. non-consumed. The remaining food items (n=80)
were categorized into three levels: non-consumers, below the median of consumption among
consumers, and above the median of consumption among consumers. More details about the
prevalence of food item consumption and categorization of food items is provided in Appendix 4. We fit 2-4 classes using energy-adjusted LCA models in Mplus 7.3 (88). The number of classes was selected based on the Lo-Mendell-Rubin likelihood ratio test (LRT) and women
were classified into mutually exclusive classes according to their highest predicted probability of
Outcome Assessment
Maternal cardiometabolic markers
Maternal blood samples were collected at 24-29 weeks gestation (Mean: 27.2 ± 1.4
weeks; Range: 24.0-30.9 weeks). Maternal fasting glucose (mg/dL) was assayed by LINCO
Research, Inc. using a standard hexokinase method. Fasting insulin (µU/mL) was assayed by
LINCO Research, Inc. using the double antibody/PEG technique. Fasting cholesterol (mg/dL)
and triglycerides (mg/dL) were assayed by LipoScience Inc. (Raleigh, NC) using nuclear
magnetic resonance technique (NMR LipoProfile®). We estimated insulin resistance from
fasting plasma glucose and insulin concentrations using the homeostasis model assessment for
insulin resistance (HOMA-IR) and calculated using the following equation (90, 91):
HOMA-IR= Fasting glucose (mg/dL) x Fasting insulin (µU/mL)
405
Child Anthropometrics
Child anthropometrics examined in this dissertation included: BMI z-score at 36 months
of age and weight-for-height z-score (WHZ) from birth to 36 months of age. Child’s birth weight
and sex were collected from delivery records. The study provided doctor cards to the mothers so
that during pediatrician visits, a health care provider could record the child’s weight and height.
We calculated the child’s precise age at each measurement using the difference between the
documented date of visit and the child’s birth date. Trained PIN personnel measured children’s
standing height and weight at the 36-month in-home visit using stadiometers and scales
WHZ for children from birth to 24 months were calculated using the 2006 World Health
Organization (WHO) growth charts and for children 2 years of age and older using the 2000
CDC growth charts (22, 93). WHZ, a measure of relative weight, was used to examine child
growth from birth to 36 months of age. BMI z-scores were calculated based on the 2000 Center
for Disease Control and Prevention (CDC) growth charts to examine the association between
maternal dietary patterns during pregnancy and child BMI z-score at 36 months of age.
Covariates
This section describes data collection and classification of covariates of interest. These
variables have been divided into maternal and child variables.
Maternal variables
Maternal age
Maternal age at the time of recruitment was collected during the prenatal period. This factor was
categorized as: 16-24, 25-29, 30-34, and ≥35 years.
Maternal race
Maternal race was based on mother’s self-identified race and was dichotomized as non-black and
black. Mother’s also provided child’s race/ethnicity.
Marital status
Marital status was based on cohabitation status and dichotomized as married/living with a
Gestational age at delivery
Gestational age was estimated from the first ultrasound measurement performed prior to 22
weeks’ gestation (>90%); however, if an ultrasound was not performed prior to 22 weeks’
gestation, then the date of last menstrual period was used.
Parity
Parity was defined based on the number of births prior to the index pregnancy at enrollment into
the PIN3 study and was dichotomized as nulliparous and parous.
Household income
Household income was converted into percent of the poverty line by including the number of
family members in the household based on the 2001 US Department of Health and Human
Services Federal Poverty Guidelines (94) and cut-points were based on the Special Supplemental
Nutrition Program for Women, Infant, and Children (WIC) eligibility guidelines: <185%,
185-350%, and >350%.
Maternal Education
The number of years of completed education was categorized as ≤Grade 12 (high school
completion or less), Grades 13-16 (high school with some college), ≥Grade 17 (some
Pre-pregnancy BMI
Pre-pregnancy BMI was based on height measured at either the first prenatal clinic visit or
during the 3-month postpartum visit and self-reported pregnancy weight. Missing
pre-pregnancy weight was imputed based on measurements taken at the first prenatal care visit (95).
Maternal smoking status during pregnancy
Smoking status (smoker vs. nonsmoker) during the first six months of pregnancy was collected
from self-administered questionnaires.
Child variables
Birth weight
Birth weight (grams) was collected from delivery logs. This variable was examined in the
statistical analysis for Aim 2 to understand the influence on the associations between dietary
patterns and child anthropometrics.
Infant diet
PIN Kids collected 2 dietary recalls to use for child dietary intake. We created DASH scores for
children with available data at 36 months of age. At the 3- and 12-month PIN Postpartum
interviews, data about breastfeeding were collected. Infant diet and duration of exclusive
breastfeeding (months) were considered in analyses for Aim 2 to examine the influence of these
Statistical Analysis Plan
Descriptive statistics (means, standard deviations, frequencies, and percentages) were
computed for selected baseline characteristics, exposures, and outcomes. Potential confounders
were determined based on a priori review of the literature and directed acyclic graphs (96). Effect measure modification was assessed using likelihood ratio tests (LRT) with an a priori
significance level set at p-value <0.15. A brief description of the statistical analyses conducted in
each specific aim of this dissertation are provided below and detailed in their corresponding
chapters:
Aim 1: To assess the relationship between maternal dietary patterns and the following
maternal cardiometabolic markers during pregnancy: glucose, insulin, insulin resistance
(HOMA-IR) triglycerides, and total cholesterol
To study the association between maternal dietary patterns during pregnancy and fasting
glucose, insulin, HOMA-IR, triglycerides, and total cholesterol, we used multivariable linear
regression. DASH diet scores and latent dietary classes were analyzed categorically, where
Tertile 1 was the referent for DASH and Class 1 for LCA. We examined three models separately.
First, we assessed the crude association between maternal dietary patterns and cardiometabolic
markers. Second, we adjusted the crude model for maternal age, race, poverty level, parity,
smoking status, physical activity, and energy intake. In a third model, we further adjusted for
continuous pre-pregnancy BMI, to examine a potential confounding pathway between maternal
AIM 2: To explore the effects of maternal dietary patterns in early pregnancy on early
childhood growth outcomes from birth to 36 months of age
We used multivariable linear regression to examine the association between maternal
dietary patterns and child BMI z-score at 36 months. In addition, we used linear mixed models
to estimate child growth (WHZ), defined as intercept (birth) and slope (rate of change), from
birth to 36 months in relation to maternal DASH score and latent dietary classes during
pregnancy. Linear mixed models are used for continuous repeated outcome measures and can
account for unbalanced data (varying number of repeated outcomes across children), unequal
spacing of measurements across time, and the correlations between measurements within each
child (97, 98). The mixed models were fit using restricted maximum likelihood for repeated
measures, which accounts for the correlated measures at the different time points in the variance
and covariance matrices. Children with at least one measurement were included in the analysis.
Results from the DASH score analysis are provided in Chapter 3. Results from the LCA were
not included in the manuscript, but are provided in Appendices 5-8. All analyses were performed
CHAPTER IV: MATERNAL DIETARY PATTERNS AND CARDIOMETABOLIC MARKERS DURING PREGNANCY
INTRODUCTION
Early life risk factors for childhood obesity have become a focus of epidemiologic
research, as emerging evidence suggests that intrauterine exposures on the fetus can have effects
on obesity development in childhood (25). During a typical pregnancy, several adaptations to
metabolic profiles occur to sustain pregnancy and promote fetal growth and development (99,
100). Although elevated levels of metabolic markers are characteristic of a normal pregnancy,
an intrauterine environment with profound insulin resistance and increased glucose, triglyceride,
and cholesterol levels can result in higher birth weight, increased infant adiposity, and infant
weight gain, and increased risk of subsequent childhood obesity (30, 40, 42, 43, 45-47, 101, 102).
Diet during pregnancy is a modifiable behavior that could influence offspring adiposity
by optimizing levels of important cardiometabolic markers. While individual food and nutrient
studies provide an understanding of biological mechanisms, dietary patterns offer a more holistic
approach that can be applied to real world settings and, thus, public health interventions (8).
Additionally, studies of dietary patterns can account for the interaction and synergistic effects of
individual foods and nutrients on health outcomes.
Previous studies have used both score-based and data-driven approaches to investigate
the relationship between diet patterns and cardiometabolic markers. Diet quality indices, like the
Healthy Eating Index, Dietary Approaches to Stop Hypertension (DASH) diet, and the
guidelines and recommendations, whereas data-driven methods, such as factor analysis and
latent class analysis (LCA), empirically derive patterns using the correlations of foods eaten
together (8). Both randomized controlled trials (RCTs) and observational studies in healthy
non-pregnant individuals have found associations between greater adherence to healthy dietary
patterns, using the Mediterranean-style diet score and factor analysis, and lower glucose and
lipid levels and decrease odds of insulin resistance (103-105). The influence of a healthy dietary
pattern on metabolic markers in pregnant women is not as well established. Studies in pregnant
women are limited to small sample sizes, racially and socioeconomically homogenous study
populations, and analyses among pregnant women with gestational diabetes (9-11, 108).
To our knowledge, only one previous study has examined the effects of dietary patterns
and cardiometabolic markers in a normal pregnant population. In this prospective study, the
authors reported an inverse association between the Mediterranean-style diet score and maternal
fasting glucose levels (106). Unfortunately, important cardiometabolic markers other than
glucose were not assessed. Additionally, the Mediterranean-style diet is just one of many
score-based diet quality indices used to assess the overall quality of diet in relation to health outcomes.
Another score-based diet quality index is the DASH diet, which examines the overall healthiness
of the diet and has been shown to positively impact components of the metabolic syndrome and
metabolic profiles in pregnant women (10, 11). We used data from a prospective study of
pregnant women to investigate the association between maternal dietary patterns and
cardiometabolic markers during pregnancy using both a diet quality index and data-driven
METHODS
Study design and population
We conducted a secondary analysis of data from the third cohort of the Pregnancy,
Infection, and Nutrition (PIN3) study, which recruited women from private and public prenatal
clinics at University of North Carolina (UNC) Hospitals (95). From January 1, 2001 to June 30,
2005, pregnant women who were ≤20 weeks’ gestation, 16 years of age and older, carrying
singleton gestation, had telephone accessibility, and were planning to continue care at the same
clinic were recruited to participate in a prospective study of fetal growth and preterm delivery. A
total of 1,875 pregnant women (2,006 pregnancies) were enrolled into the study, of which 1,352
women (1,442 pregnancies) had complete dietary information. Because it was possible for a
woman to have multiple pregnancies during the PIN 3 study, we randomly selected one
pregnancy per woman from those with complete dietary information to be included in this
analysis (1,352 women = 1,352 pregnancies). Women provided written informed consent at
recruitment and all procedures were reviewed and approved by the UNC Institutional Review
Board.
Assessment of primary outcomes
Maternal blood specimens were collected at 24-29 weeks gestation. Using a standard
hexokinase method, maternal fasting glucose (mg/dL) was assayed by LINCO Research, Inc.
Fasting insulin (µU/mL) was assayed by LINCO Research, Inc. using the double antibody/PEG
technique. Fasting cholesterol (mg/dL) and triglycerides (mg/dL) were assayed by LipoScience
Inc. (Raleigh, NC) using nuclear magnetic resonance technique (NMR LipoProfile®). We
homeostasis model assessment for insulin resistance (HOMA-IR) and calculated using the
following equation (90, 91):
HOMA-IR = Fasting glucose (mg/dL) x Fasting insulin (µU/mL) 405
Assessment of primary exposures
Information on diet was collected at 26-29 weeks gestation using a self-administered,
semi-quantitative, 119-item Block FFQ to assess dietary intake over the previous three months.
Detailed information on the validity of FFQ has been described elsewhere (84). To calculate
daily energy intake in kcals and grams per day from the FFQ data, we used Dietsys+Plus version
5.6 with an updated food composition table based on nutrient values from the NHANES III and
USDA 1998 nutrient databases.
Dietarypatterns
We examined dietary patterns using two different approaches, one score-based and
another data-driven. Diet quality score-based methods define dietary patterns using established
consensus reports (e.g. dietary guidelines or recommendations) and then assign scores at the
individual level to reflect their adherence to the guidelines, whereas data-driven methods use
statistical models to derive dietary patterns based on data collected from diet instruments (7). For
the diet quality score-based approach, we assessed adherence to the DASH diet (86). The DASH
scoring method was based on a previously developed approach, where participants received
points based on their quintile of intake (87). High intake of fruits, vegetables, nuts and legumes,
quintile = 1 point, highest quintile = 5 points). Sodium, red and processed meat, and sweetened
beverage intakes were reverse scored, where the lowest quintile of intake received five points,
while the highest quintile of intake was assigned one point. Each component score was summed
to derive a total DASH adherence score for each participant, which could range from 8 (not
adherent) to 40 (adherent). We then divided DASH scores into tertiles for all analyses, where the
highest tertile represented healthier diet quality.
We chose LCA as the data-driven approach to derive dietary patterns, which classify
women into mutually exclusive groups. The methodology for deriving mutually exclusive
groupings is described in full detail in previous studies (77, 78). Here, the number of FFQ food
items used to derive the latent classes was reduced from 119 to 105 due to excluding rarely
consumed food items (< 10%) and combining low-fat milks (skim, 1%, and 2%) into one group
due to small cell counts. Many of the food items had skewed distributions due to high
prevalence of non-consumers; therefore, we used categories of intake. Food items with a high
prevalence of consumption, such as green beans and pizza, (non-consumption <10%; n=17
items) were dichotomized at the median. Food items with a low prevalence of consumption, like
grapefruit and whole milk, (non-consumption >70%; n=8) were dichotomized as consumed vs.
consumed). The remaining food items (n=80) were categorized into three levels:
non-consumers, below the median of consumption among non-consumers, and above the median of
consumption among consumers. We fit energy-adjusted LCA models with 2-4 classes. The
number of classes was selected based on the Lo-Mendell-Rubin likelihood ratio test (LRT) and
women were classified into mutually exclusive classes according to their highest predicted
Covariates
The following variables were evaluated as potential confounding factors of the maternal
dietary patterns-cardiometabolic markers association based on extant literature and causal
diagram analysis (96). At enrollment, women reported their age, race, marital status, parity,
household income, education level, pre-pregnancy weight, smoking status, and physical activity.
Age in years at time of conception was categorized into four categories: 16-24, 25-29, 30-34, and
≥35 years. Due to the small number of women self-identifying with a race/ethnicity other than
“white” or “black”, race was dichotomized as non-black and black. Marital status was based on
cohabitation status and dichotomized as married or living with a partner and unmarried. Parity
was defined based on the number of births prior to the index pregnancy at enrollment into the
PIN3 study and was dichotomized as nulliparous and parous. Household income was converted
to percent of poverty and categories were based on the Special Supplemental Nutrition Program
for Women, Infant, and Children (WIC) eligibility guidelines: <185%, 185-350%, and >350%
(94). This categorization was used because women with a household percentage <185% are
eligible for WIC support. The number of years of completed education was categorized as
≤Grade 12 (high school completion or less), Grades 13-16 (high school with some college or
college completion), ≥Grade 17 (some post-college education). Maternal pre-pregnancy BMI
was calculated based on self-reported pre-pregnancy weight and height that was measured at the
first clinic visit. BMI classifications followed the 2009 Institute of Medicine recommendations:
underweight <18.5 kg/m2; normal weight 18.5-24.9 kg/m2; overweight 25.0-29.9 kg/m2; and obese ≥30.0 kg/m2. Smoking during pregnancy was dichotomized as non-smoker and smoker
during the first six months of pregnancy, which was asked at 17-22 weeks and 27-30 weeks
(MET) hours that were calculated from self-reported physical activity information at <20 weeks
and 24-29 weeks gestation.
Statistical analysis
To avoid excluding women with missing covariate information from the analysis, we
used data from the three months postpartum survey when possible for missing federal poverty
level (n=12) and smoking status (n=9). In addition, we used multiple imputation methods to
estimate values of other missing covariate data for maternal race (n=1), prenatal smoking (n=18),
and federal poverty level (n=20). All covariates and outcomes discussed previously were
included in the multiple imputation models (107). We used 10 iterations to produce 10 imputed
datasets for regression analyses.
Of the 1,352 women included in this study, 569 had biomarker data for all
cardiometabolic markers of interest (fasting glucose, insulin, total cholesterol, and triglycerides).
We compared select baseline characteristics to determine whether women with data for all
cardiometabolic markers (n=569) differed from women excluded (n=783). While those with
complete biomarker data had a slightly lower mean ± SD pre-pregnancy BMI (25.3 ± 6.5 kg/m2
vs. 26.2 ± 7.3 kg/m2 for those excluded; (P<0.01)), all other comparisons of baseline
characteristics were not statistically different. In addition, we further excluded women with
pre-existing diabetes (n=12), chronic hypertension (n=34), or who had both conditions (n=10)
because it is possible that these women had received preconception dietary advice for their
conditions, which could have influenced their dietary habits during pregnancy, resulting in 513
Frequencies and descriptive statistics were expressed as n (%) and means ± SDs,
respectively. Cardiometabolic markers were examined for normality using the Shapiro-Wilk test
and observation of box-plots. Those with skewed distributions were transformed using the
natural log. Statistical significance was evaluated using χ2 and Analysis of Variance (ANOVA)
tests for categorical and continuous variables, respectively (P<0.05). We examined the correlation between continuous DASH score and nominal latent classes using Spearman
correlation. To study the association between maternal dietary patterns during pregnancy and
fasting glucose, insulin, HOMA-IR, triglycerides, and total cholesterol, we used multivariable
linear regression. DASH diet scores and latent dietary classes were analyzed categorically, where
Tertile 1 was the referent for the DASH diet and Class 1 for LCA. We examined three models
separately. First, we assessed the crude association between maternal dietary patterns and
cardiometabolic markers. Second, we adjusted the crude model for maternal age, race, poverty
level, parity, smoking status, physical activity, and energy intake. In a third model, we further
adjusted for continuous pre-pregnancy BMI, to examine a potential confounding pathway
between maternal dietary patterns and cardiometabolic markers during pregnancy (Figure 3). Other covariates (maternal education and marital status) were tested as potential confounders,
but were excluded because they did not meaningfully influence our estimates
(change-in-estimate <10%). We further assessed the relationship between dietary patterns, maternal
pre-pregnancy BMI, and cardiometabolic markers by calculating predicted means for each
cardiometabolic marker, given the following profile: pregnant women 30-34 years of age who
are non-Black, nulliparous, nonsmokers, 350% above federal poverty level, and median MET
hours of 17.66 and median energy intake of 1994.9 kcal. All analyses were performed using
RESULTS
Three latent classes were identified from the LCA. Class 1 was characterized by high
intake of hamburgers, hot dogs, French fries, fried chicken, white bread, bacon, and soft drinks.
Class 2 was characterized by a high intake of some vegetables, refined grains, mixed dishes,
meat, poultry, processed meat, salty snacks, sweets, some fast foods, and fruit juice. Class 3
included high intake of fruits, vegetables, whole grains, low fat dairy, breakfast bars, and water.
DASH scores ranged from 12 to 37 with a mean of 24.2 ± 5.1. A higher proportion of
women were grouped into Latent Class 3, which represented a healthier dietary pattern, as
compared to Latent Classes 1 and 2. Twenty-two percent (n=114) of the total sample was
grouped into both DASH Tertile 3 and Latent Class 3. Continuous DASH score and latent
classes were significantly correlated (ρ=0.50; p=<0.001). On average, women who were
grouped into DASH Tertile 3 or Latent Class 3 were older and more likely to be non-Black and
married (Table 1). They also had a lower prevalence of pre-pregnancy obesity and smoking during pregnancy. These women were also more likely to have a high household income
(>350% federal poverty level) and more than a college education (≥ Grade 17).
By definition, women with a DASH score in the highest tertile had a higher consumption
of healthy food items (i.e. fruits, vegetables, whole grains, etc.) and lower intake of unhealthy
foods (i.e. red meat, sweetened beverages, etc.) as compared to women with scores in the lower
tertiles (Table 2). Similarly, women grouped into Latent Class 3 had higher mean intake of vegetables, whole grains, and low fat dairy, and lower intake of red meat and sweetened
beverages than women in Latent Classes 1 and 2. For example, mean intake of vegetables
among women grouped into Latent Class 3 was 2.6 ± 2.0 compared to 2.3 ± 1.7 for Latent Class
Class 3 compared to 0.6 ± 0.3 and 0.5 ± 0.8 for Latent Class 2 and 1, respectively. Saturated fat
intake was also lower for women categorized into DASH Tertile 3 and Latent Class 1 as
compared to women grouped into other categories.
In the multivariable analysis, an inverse association was observed between maternal
dietary patterns and fasting glucose (Table 3). In adjusted Model 2, a Latent Class 3 diet (characterized by high intake of fruits, vegetables, whole grains, low fat dairy, breakfast bars,
and water) was associated with a significantly lower (β= -2.33, 95% CI: -4.17, -0.50) fasting
glucose level compared to a Latent Class 1 diet (characterized by high intake of hamburgers, hot
dogs, French fries, fried chicken, white bread, bacon, and soft drinks). There was suggestion that
better adherence to the DASH diet was also associated with lower levels of maternal glucose
(DASH Tertile 3 vs. Tertile 1 adjusted β= -1.01; 95% CI: -2.82, 0.81). When we further adjusted
for pre-pregnancy BMI, the results were attenuated towards the null value. In contrast, there
was indication of a positive association for adherence to a healthy dietary pattern (DASH Tertile
3 and Latent Class 3) and total cholesterol.
Table 4 presents the ratio of geometric means for log-transformed markers (fasting inulin, HOMA-IR, and triglycerides) according to DASH score tertile and latent dietary classes. As
observed with fasting glucose, we found that adherence to a healthier dietary pattern was
inversely associated with insulin, HOMA-IR, and triglyceride levels after adjustment for
potential confounders. In adjusted Model 2, we found that women with a DASH score in Tertile
3 had 12-18% lower levels of insulin, HOMA-IR, and triglycerides compared to women with a
DASH score in Tertile 1. The ratio of geometric mean for insulin, HOMA-IR, and triglycerides
were 0.83 (95% CI: 0.74-0.94), 0.82 (95% CI: 0.72-0.94), and 0.88 (95% CI: 0.81-0.96),