A STUDY OF CD4-STRATIFIED TIMING OF ANTIRETROVIRAL THERAPY AMONG PATIENTS RECEIVING INTEGRATED TUBERCULOSIS AND HIV TREATMENT IN A
HIGHLY RESOURCE-LIMITED SETTING
Monita R. Patel
A dissertation submitted to the faculty of the University of North Carolina at Chapel Hill in partial fulfillment of the requirements for the degree of Doctor of Philosophy in the Department
of Epidemiology in the Gillings School of Global Public Health.
Chapel Hill 2013
iii ABSTRACT
Monita R. Patel: A Study of CD4-Stratified Timing of Antiretroviral Therapy among Patients Receiving Integrated Tuberculosis and HIV Treatment in a Highly Resource-Limited Setting
(Under the direction of Annelies Van Rie)
In 2012, the World Health Organization recommended that HIV-infected patients starting tuberculosis (TB) treatment be initiated on antiretroviral therapy (ART) after 8 weeks if CD4 count ≥50 cells/mm3 and after 2 weeks if CD4 count <50 cells/mm3. Examination of this type of CD4-stratified ART timing strategy would be useful to inform development and implementation of this new recommendation. In the Integration of TB and AntiRetroviral Treatment study, nurses implemented a CD4-stratified timing strategy for ART initiation among HIV-infected patients starting TB treatment in Kinshasa, Democratic Republic of Congo. Participants were eligible for ART initiation at 1 month if CD4 count <100 cells/mm3 or WHO clinical stage 4 for reason other than extrapulmonary TB, at 2 months if CD4 count 100-350 cells/mm3, or at
iv
1.08-1.33 per 100 cells/mm3), TB drug intolerance (adjOR 1.93, 95% CI 1.23-3.02), and non-disclosure of HIV-infection (adjOR 1.50, 95% CI 1.03-2.18) predicted delayed ART initiation. In the subset of 395 patients eligible at 1 or 2 months, mortality risk was 12.0% with observed fidelity and 7.8% with complete fidelity, corresponding to a risk difference of 4.2% (95% CI: -8.1, -0.3, %) and preventable fraction of mortality of 35.1% (95% CI: 2.9-67.9%).
v
ACKNOWLEDGEMENTS
I would like to acknowledge several persons and resources who contributed to my ability to complete this dissertation. First, my dissertation committee, who provided valuable advice on the design, implementation, analysis, and interpretation of this study. In particular, Dr. Annelies Van Rie, who served as both my dissertation chair and academic advisor during the PhD
program and provided excellent mentorship throughout that exceeded my expectations. Second, my family and friends, who provided emotional support and encouragement throughout the dissertation process, but especially when things did not go as planned. My parents, Ramesh and Bharti Patel were a constant source of optimism and unconditional support during the PhD program and dissertation and instilled the important of higher education to me from an early age. My PhD cohort members were a constant resource, both academically and on a personal level, particularly, Jessica Rinsky, Virginia Senkomago, Heidi Soeters, Nicole Davis, and Anna Barry Cope. Third, the National Institutes of Health, National Institutes for Allergy and Infectious Diseases provided me with one-year of funding for my dissertation work. Finally, several persons at the University of North Carolina provided essential assistance during dissertation work. The following people assisted me in preparing the dataset: Liz Cromwell in Chapel Hill; and Martine Tabala, Steven Mapuate in Kinshasa. Also, Nancy Colvin and Carmen Woody at The University of North Carolina in Chapel Hill provided essential support and advice through the PHD program and dissertation, for which I am tremendously grateful.
vi
TABLE OF CONTENTS
LIST OF TABLES………..vi
LIST OF FIGURES………...…vii
LIST OF ABBREVIATIONS………..viii
CHAPTER ONE: SPECIFIC AIMS………1
CHAPTER TWO: BACKGROUND AND SIGNIFICANCE…………..………..5
CHAPTER THREE: STUDY DESIGN AND METHODS………..………23
CHAPTER FOUR: TIMING AND PREDICTORS OF DELAY OF ANTIRETROVIRAL THERAPY INITIATION AMONG PATIENTS RECEIVING INTEGRATED TUBERCULOSIS AND HIV TREATMENT………...…40
CHAPTER FIVE: EFFECT OF CD4-STRATIFIED TIMING OF ANTIRETROVIRAL THERAPY INITIATION ON MORTALITY IN PATIENTS DIAGNOSED WITH TUBERCULOSIS IN A HIGHLY RESOURCE-LIMITED SETTING………...47
CHAPTER SIX: DISCUSSION………...53
vii
LIST OF TABLES
TABLE 2.1 - Summary of Studies of Effect of ART Timing Among
HIV-infected Tuberculosis Patients on Clinical Outcomes of Interest...21 TABLE 3.1 - Table 3.1 Definition of Key Covariates of Interest for Analyses
of CD4-Stratified ART Timing...…...33 TABLE 4.1 - Characteristics at baseline of 492 patients participating in the Integrated
Tuberculosis and Anti-Retroviral Treatment (ITART) study at five primary
care clinics in Kinshasa, Democratic Republic of Congo...44 TABLE 4.2 - Predictors of Delayed ART Initiation in 492 patients participating in
the Integrating Tuberculosis and Anti-Retroviral Treatment (ITART) study at five
primary care clinics in Kinshasa, Democratic Republic of Congo...46 TABLE 5.1 - Baseline characteristics of patients in the Integrating Tuberculosis
and Anti-Retroviral Treatment (ITART) study analytical population by timing
of ART initiation per CD4-stratified strategy (N=395)...50 TABLE 5.2 - Predictors of mortality in 395 HIV-infected patients diagnosed with
TB with observed implementation fidelity to CD4-Stratified timing of ART initiation...51 TABLE 5.3 - Six-month mortality risk in the Integrating Tuberculosis and
Anti-Retroviral Treatment (ITART) study population (N=395) under observed and complete implementation fidelity to timing of ART initiation per CD4-stratified
viii
LIST OF FIGURES
FIGURE 2.1 - Estimated HIV Prevalence in New Cases of Tuberculosis Disease, 2012...20 FIGURE 3.1 - Figure 3.1 Application of Inclusion/Exclusion Criteria to Generate
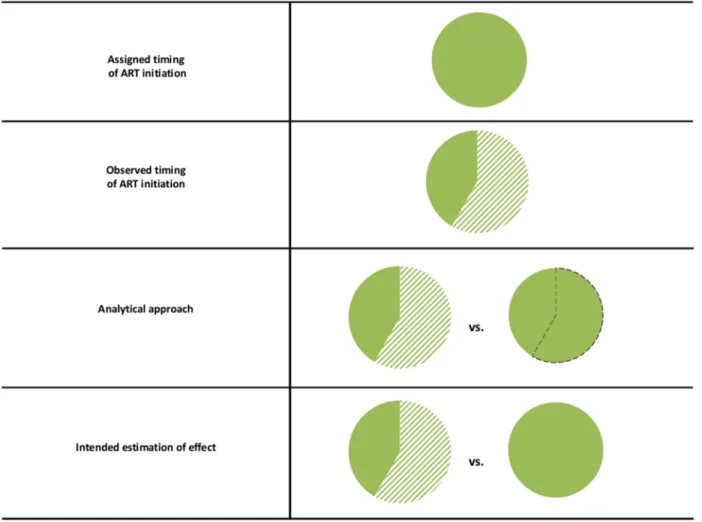
Analytical Populations...36 FIGURE 3.2 - Graphical depiction of analytical approach to examine the effect of
implementation fidelity to CD4-stratified timing of ART initiation on mortality…...37 FIGURE 3.3 - Steps of the parametric g-formula method to estimate the risk
difference between the ITART population under observed and complete implementation
fidelity to timing of ART initiation per CD4-stratified strategy...38 FIGURE 3.4 - Direct Acyclic Graph (DAG) of Association between ART
Initiation Per CD4-Stratified Timing and Mortality...39 FIGURE 4.1 - Distribution of ART eligibility, expected timing of ART initiation,
and observed timing of ART initiation in 492 patients receiving integrated TB and HIV
ix
LIST OF ABBREVIATIONS AIDS Acquired Immunodeficiency Syndrome
BMI Body mass index
CD4 Cluster of differentiation 4 CI Confidence interval
DRC Democratic Republic of Congo
HR Hazard ratio
HIV Human immunodeficiency virus IQR Interquartile range
IRIS Immune reconstitution inflammatory syndrome
ITART Integration of Tuberculosis and Anti-Retroviral Treatment LTFU Lost-to-follow up
OR Odds ratio
RCT Randomized controlled trial RD Risk difference
RR Risk ratio
SES Socio-economic status
TB Tuberculosis
1
CHAPTER ONE: SPECIFIC AIMS
Tuberculosis (TB) is among the top fifteen causes of death in the world and is curable through a 6-9 month course of anti-tuberculosis treatment.[1]
In 2012, there were approximately 8.6 million new cases of TB and 1.3 million deaths from TB; the majority of which were in limited-resource countries.[2]
Human immunodeficiency virus/acquired immunodeficiency syndrome (HIV/AIDS) ranks as the sixth leading cause of death in the world and is manageable through life-long antiretroviral therapy (ART).[1] By end 2012, there were approximately 35 million people infected with HIV, 2.3 million of which were infected within the preceding year; and, 1.6 million deaths from AIDS.[3]
Similar to TB, the majority of AIDS cases and deaths are in limited-resource countries. In fact, a large proportion of patients with TB disease are also HIV-infected; TB and HIV/AIDS are overlapping epidemics. In most countries, the HIV prevalence among patients with TB disease is typically higher than that in the general population; and in some sub-Saharan countries, as high as 50-80%.[4]
A review conducted by Mukadi et al in 2001, found that without ART, case-fatality rates in HIV-infected TB patients across several sub-Saharan African countries range from 16-35%.[5]
Thereafter, several
observational studies have compared mortality between patients with and without ART. Lawn et al reviewed the findings from these studies in 2009 and found that ART reduced mortality in HIV-infected TB patients by 54% to 95%.[6]
2
Despite this evidence, the proportion of HIV-infected patients diagnosed with TB who initiated ART during TB treatment has only increased from 36% in 2005 to 57% worldwide in 2012.[2]
One obstacle to ART initiation among HIV-infected TB patients is the need to refer patients from the TB clinic to the HIV clinic. TB treatment services are highly decentralized in most countries, while HIV treatment services are not. Implementation studies have demonstrated that the more integrated HIV services are into TB clinical settings, the higher the uptake among TB patients.[7, 8]
A second obstacle to ART initiation is the concern among healthcare providers that co-treatment for TB and HIV may result in drug-drug interactions, immune reconstitution inflammatory syndrome (IRIS), and poor adherence due to high pill burden. These concerns may contribute to delay or failure to initiate ART during the course of TB treatment.
The World Health Organization (WHO) 2004 “Interim Policy on Collaborative TB/HIV Activities” recommended that ART be offered to all TB patients who are eligible per national guidelines, but provided no details on timing of ART treatment in patients receiving TB treatment. In 2006, the WHO recommended that ART be initiated between 2 weeks and 2 months after the start of TB treatment for patients with cluster of differentiation 4 (CD4) count <200 cells/mm3, after 2 months for patients with CD4 count 200-350 cells/mm3, or, after
completion of TB treatment for patients with CD4 count >350 cells/mm3. This recommendation weighs healthcare provider concerns with the level of patient immunosuppression, and provides more concrete criteria on when to initiate ART during TB treatment. No formal evaluation of this recommendation was done to date. Consequently, it is not clear whether this type of CD4-stratified ART initiation is efficacious or effective.
3
evidence, and caters to settings in which CD4 cell count is not readily available. Several randomized controlled trials (RCTs) evaluated “early” vs. “delayed” ART initiation in TB patients. Results suggest a benefit to “early” ART initiation (within 2-4 weeks), but only among those with low CD4 cell count. The Starting Antiretroviral Therapy at Three Points in
Tuberculosis (SAPiT) study in South Africa, concluded that starting ART during TB treatment, compared to waiting to start ART after completion of TB treatment, reduced the risk of death by 60%. Analysis of the two “early” ART arms in SAPiT demonstrated that initiating ART within 4 weeks v. 2-3 months of TB treatment, relatively reduced the risk of AIDS or death by 70% among those with CD4 cell count <50. The Immediate Versus Deferred Start of Anti-HIV Therapy in HIV-Infected Adults Being Treated for Tuberculosis (STRIDE) study, conducted across multiple countries, demonstrated that initiating ART within 2 weeks v. 2-3 months of TB treatment, absolutely reduced the risk of AIDS or death by 11%, only among those with CD4 cell count <50. The Cambodian Early versus Late Introduction of Antiretroviral Drugs (CAMELIA) study found that, in a population where 71% of participants have a CD4 cell count < 50
cells/mm3, the risk of death was relatively reduced by 40% by initiating ART at 2 weeks v. 2 months of TB treatment. Taken together, these RCTs suggest that early ART initiation is efficacious among those with severe immunosuppression. For that reason, a CD4-based ART timing strategy, such as the one suggested in the 2006 WHO recommendation, may be
appropriate. In fact, the recent 2012 WHO TB/HIV Policy for Collaborative TB/HIV Activities moves in this direction by recommending that patients with CD4<50 initiate ART within 2 weeks; and that patients with CD4 ≥50 initiate ART within 8 weeks.
4
by the University of North Carolina (UNC) in the Democratic Republic of Congo. The main objective of this study was to evaluate the feasibility and effectiveness of integrated treatment for TB and HIV delivered by nurses at the primary health center-level using a CD4-stratified timing strategy based 2006 WHO recommendation. The ITART study generated an electronic database that contains data on TB and HIV diagnosis and treatment outcomes, as well as a number of covariates of interest for a cohort of adult and children newly diagnosed with TB across 5 sites. Data were prospectively collected on patients at baseline/enrollment, monthly follow-up visits during TB treatment, and at 6 months post-TB treatment start.
This analysis will address two specific aims:
Aim 1: To identify demographic, clinical, and behavioral factors that predict “delayed ART initiation” among patients in a highly resource-limited setting; with delayed ART initiation defined as ART timing deviating from the CD4-stratified timing strategy.
5
CHAPTER TWO: BACKGROUND AND SIGNIFICANCE
The Burden of TB
Tuberculosis (TB) is among the top fifteen causes of death in the world and is a major source of morbidity and mortality in limited-resource.[1]
Tuberculosis (TB) disease is caused by infection of Mycobacterium tuberculosis (M.TB). A subset of those persons with M.TB
infection will progress to TB disease, a state during which patients are symptomatic and
infectious. TB disease is curable through a multi-drug treatment regimen that is typically given over the course of six months with close monitoring by health care providers. Despite this, in 2012, there were approximately 8.6 million new cases of TB and 1.3 million deaths from TB; the majority of which were in limited-resource countries.[1]
The Burden of HIV
HIV/AIDS ranks as the sixth leading cause of death in the world and is a major source of morbidity and mortality in limited-resource settings.[9]
6
infected within the preceding year; and, 1.6 million deaths from AIDS.[3]
Similar to TB, the majority of AIDS cases and deaths are in limited-resource countries.
The Burden of TB/HIV
HIV-infected persons are 20-30 times more likely to develop TB disease after M.TB infection and one-fourth of all HIV deaths are attributable to TB disease.[4] The HIV prevalence among patients with TB disease is typically higher than that in the general population; and as depicted in Figure 2.1, in some sub-Saharan countries, as high as 50-80%. In addition, higher levels of immunosuppresion are associated with extrapulmonary TB, disseminated TB, and rare atypical clinical presentations. The diagnosis of these types of TB disease is relatively complex and may result in treatment delay and subsequently, in increased morbidity and mortality.[10]
Furthermore, laboratory research suggests that TB disease enhances HIV replication.[11, 12]
This is supported by the finding of shorter survival among HIV-infected patients with TB disease
compared with HIV-infected patients without TB disease in numerous observational cohorts.[13, 14]
Mortality Due to TB/HIV in Patients With and Without ART
A review conducted by Mukadi et al in 2001, found that during the pre-ART era, case-fatality rates in HIV-infected TB patients across several sub-Saharan African countries ranged from 16-35%.[5]
7
Two of these studies, conducted by Dheda et al in the United Kingdom from 1998 to 2001 and Haar et al in The Netherlands from 1993-2001, were similar. The investigators retrospectively reviewed medical records to identify HIV-infected patients who were diagnosed and treated for TB disease. The primary objective of these studies was to compare risk of death between patients who were treated for TB before and during the ART era. Dheda et al found a 72% reduction in mortality (adjusted-HR=0.28; 95% CI: 0.13, 0.63).[15]
Similarly, Haar et al found a 54% reduction in mortality (adjusted-OR=0.46; 95% CI: 0.24, 0.89).[16]
Three of these studies, conducted by Manosuthi et al in Thailand from 2000 to 2004, Nahid et al in the United States from 1990 to 2001, and Velasco et al in Spain from 1996 to 2004, were similar. The investigators retrospectively reviewed medical records to identify HIV-infected patients diagnosed and treated for TB disease. The primary objective of these studies was to compare patients the risk of death between patients on and not on ART. Manosuthi et al found that patients not on ART had an increased risk of mortality (adjusted-HR=20.0; 95% CI: 8.62, 45.45).[17]
Nahid et al found that patients on ART had a decreased risk of mortality (adjusted-RR=0.36; 95% CI: 0.14, 0.91).[18]
Velasco et al found that patients on ART had a decreased risk of mortality (adjusted-HR=0.38; 95% CI: 0.20, 0.72).
Although these five studies provide evidence that ART reduces mortality among patients with TB disease, they are limited by retrospective study design, and subsequent potential for selection, information, and confounding biases, and reverse causality.
8
reduced risk of mortality (adjusted-RR=0.20; 95% CI: 0.1, 0.4).[19]
Varma et al found that ART during TB treatment reduced the risk of mortality (adjusted-RR=0.16; 95% CI: 0.07, 0.36).[20]
These findings confirm the substantial effect of ART on survival among patients with TB disease.
Current Uptake of ART Among Patients with TB/HIV
Despite this evidence, the proportion of HIV-infected TB patients who initiated ART has only increased from 36% in 2005 to 57% in 2012.[2]
One obstacle to ART initiation among HIV-infected TB patients is the need to refer patients from the TB clinic to the HIV clinic. TB treatment services are highly decentralized in most countries, while HIV treatment services are not. Implementation demonstrated that the more integrated HIV services are into TB clinical settings, the higher the uptake among TB patients.[7, 8]
A second obstacle to ART initiation is the concern among healthcare providers that co-treatment for TB and HIV may result in drug-drug interactions, immune reconstitution inflammatory syndrome (IRIS), and poor adherence. These concerns may contribute to delay or failure to initiate ART during the course of TB treatment.
WHO Guidelines on Timing of ART Among Patients with TB/HIV
The WHO (WHO) 2004 “Interim Policy on Collaborative TB/HIV Activities”
9
concerns with the level of patient immunosuppression, and provides more concrete criteria on when to initiate ART during TB treatment. No formal evaluation of this recommendation was done to date.Consequently, the effectiveness of this this type of CD4-stratified strategy for timing of ART initiation is unclear.
In 2009, WHO recommended that ART be initiated in all TB patients within 2-8 weeks, regardless of CD4 count. This recommendation was based on only moderate evidence, and caters to settings in which CD4 count is not readily available. Based on the results of 3 recent RCT studies, 2012 WHO TB/HIV Policy for Collaborative TB/HIV Activities recommended that patients with CD4<50 initiate ART within 2 weeks; however, still suggest that all other patients be initiated within 8 weeks regardless of CD4 count. This reflects a shift back toward CD4-stratified timing of ART initiation.
Predictors of Delay of ART Initiation in TB Clinical Settings
Lawn et al conducted a retrospective observational study among HIV-TB patients from one site in South Africa from 2002 to 2008. The purpose of this study was to quantify and explore determinants of time delay between TB treatment start and ART initiation. Patients were categorized by whether they received integrated TB/HIV care, defined as diagnosis and
10
receiving integrated TB/HIV care, than among those who were not (41 days versus 116 days; p-value <0.0001).[21] The proportion of patients who initiated ART within 8 and 12 weeks was significantly lower among patients receiving non-integrated TB/HIV care (19% and 24%, versus, 59% and 77%; p<0.001). Recent calendar period, lower CD4 cell count, smear-positivity,
extrapulmonary TB, and integrated TB/HIV care, were each independently statistically
associated with shorter time to ART initiation; while, age, gender, and new/recurring TB status, were not. Although successful in quantifying the time to ART initiation, especially between patients who did and did not receive integrated TB/HIV care; this study falls short in identifying predictors of time to ART initiation. The number and scope of predictor variables assessed, especially those that would be potentially modifiable, were limited; and there is a need for more comprehensive study.
Lawn et al conducted a similar second study in South Africa from 2002 to 2008 with the same primary objective. This study included patients from across three non-integrated TB/HIV care sites and used accelerated failure time modeling. In this study, the mean time to ART initiation was 2.66 months (IQR: 1.58, 4.17).[22]
Lower CD4 count, more recent calendar year, and clinic site, were each independently significantly accelerated time to ART initiation; while, age, gender, new/reoccurring TB status, and type of TB were not. This study has similar limitations as the other study by Lawn et al, and additionally, does not account for competing risks to ART initiation including death and loss-to-follow-up.
11
initiation. The reasons for delay varied by patient CD4 category.[23]
The reason for delay in patients with CD4<100 seems to be clinically-related and physican-determined; while in patients with CD4>200 seems to be non-clinical and patient-determined. A major limitation of this study was that reason for delay was collected from existing medical records, which limits the ability to obtain specific information and also creates potential for information bias. In addition, this study was conducted in the United Kingdom and the reasons for delay may not translate to limited-resource settings.
Although these studies provide some insight in to factors that may predict timely ART initiation, they are few and all have limitations that justify Aim1 of the proposed study.
Timing ART Initiation in HIV Patients in General
There is extensive body of published research that examines the optimal time to initiated ART in HIV-infected patients in general. All of these studies examine the impact of initiating ART at different time points corresponding to a patient’s CD4 cell count fall below a specified value. Early randomized controlled trials conducted in severely immuno-compromised patients (with CD4<200 cells/mm3) showed that ART initiation can reduce the rate of AIDS or death by half.[24, 25]
Based on this evidence, WHO issued guidance in 2004 that recommended ART initiation in patients with CD4<200. The question of whether the benefit of ART would hold in HIV-infected patients with higher CD4 counts remained unanswered. Since then, several observational and randomized controlled trials have examined this question.
There have been four major observational studies conducted among HIV-infected
12
When to Start Consortium conducted a retrospective observational study of 21,247 HIV-infected patients who initiated ART at CD4 cell count <550 cells/mm3 across 15 cohorts in the United States and Europe between 1998 and 2006.[26]
The primary finding from this study was that initiating ART at CD4 cell count 251-350 cells/mm3, compared to initiating at CD4 cell count 351-450 cells/mm3, resulted in increased risk of incident AIDS or death (HR=1.28; 95% CI: 1.40 - 1.57). Kitahata et al conducted an retrospective observational study that included parallel analyses of 8362 patients from 1996 to 2005 with baseline CD4 cell count 351-500 cells/mm3 and 9155 patients with baseline CD4 cell count >500 cells/mm3.[27] The primary findings of this study were that deferment (v. immediate initiation) of ART was associated with a higher risk of death in both groups of patients. In patients with baseline CD4 cell count 351-500 cells/mm3, the RR=1.69; 95% CI: 1.26 - 2.26; in patients with baseline CD4 cell count >500 cells/mm3, the RR=1.94; 95% CI: 1.37 – 2.79). Kaplan et al conducted an observational study of 4976 patients from 1996 to 2002 who initiated ART across a range of baseline CD4 cell counts.[28]
13
studies suggest that initiating at either <350 or <500 CD4 cell count is warranted in the general HIV population.
Two RCTs have aimed to examine whether initiation of ART when a patient’s CD4 cell count is <350 cells/mm3 provides clinical benefit. In the first of these, the multi-site
international Strategies for Management of Antiretroviral Therapy (SMART) RCT, investigators randomized patients with CD4<350 cells/mm3 to two treatment groups; one in which ART was initiated immediately and one in which ART was initiated when CD4 cell count fell to <250 cells/mm3.[30]
The primary finding of this study was that patients who initiated ART at CD4<250 cells/mm3 (compared to <350 cell/mm3) had higher risk of death or opportunistic infection (HR=3.47; 95% CI: 1.26-9.56). In the second, conducted in Haiti by Severe et al, HIV-infected patients with 200<CD4<350 cells/mm3, were randomized to received immediate ART or ART delayed until CD4 fell below 200 cells/mm3 and followed up for the primary endpoint of death. This study was stopped by the DSMB at interim analysis due to substantially higher mortality in the delayed ART group (HR=4.0; 95% CI: 1.6-9.8).[31]
Based on the evidence from these studies, in 2009 the WHO recommendation rais5ty56ed the recommended CD4 cell count threshold for ART initiation from 200 to 350 cells/mm3.
Timing of ART Initiation in Patients with TB/HIV
smear-14
positive, pulmonary TB disease. Patients were followed-up for a maximum of 2 years. An interim analysis was conducted approximately three months after the end of study recruitment. The main finding of this analysis was that ART initiation under either of the integrated arms, reduced mortality by 54% (HR=0.44; 95% CI: 0.25-0.79).[32]
Based on the results of this
analysis, the data safety and monitoring board (DSMB) required that all patients in the sequential arm who had not initiated ART, be offered ART as soon as possible. The subsequent analysis compared the early-integrated and late-integrated arms, with stratification across baseline CD4 categories. The main finding from this analysis was that ART in the early integrated arm reduced the risk of mortality or AIDS, however, only among patients with baseline CD4<50 (stratum-specific HR=0.32; 95%: 0.07-1.13).[33]
Patients in the early integrated arm had a higher incidence of IRIS and this effect was inversely proportional to baseline CD4 [among CD4>50, IRR=2.16 (1.12, 4.47); among CD4<50, IRR=4.71 (1.48, 19.64)]. The findings of the study did not suggest that earlier ART had any effect on adherence or outcome of TB treatment. A major limitation of this study is that was not originally powered for stratified analysis using the CD4 50 cut-point. There were only 35 patients with CD4<50, and this may have contributed to the lack of statistical significance for several of the key outcomes.
The STRIDE RCT by Havlir et al in multiple countries, examined the effect of ART initiation within 2 weeks (earlier ART) or between 2 and 3 months (later ART), on mortality or AIDS. The study population consisted of 806 HIV-infected patients aged 13 years or older, with baseline CD4 cell count<250, and confirmed or probable TB disease based on either smear or culture or clinician assessment. Patients were followed-up for a maximum of 2 years. The main finding of this study was that earlier ART reduced the risk of mortality or new AIDS-defining illness, however, only among patients with CD4<50 cells/mm3 (15.5% v. 26.6%; p=0.02).[34]
15
risk of IRIS was higher in the earlier ART group, compared to the late ART group, regardless of baseline CD4 cell count (11% v. 5%; p<0.001), however; none of the deaths that occurred were attributable to IRIS. In contrast to the SAPiT study, the STRIDE study was powered for stratified analysis by baseline CD4 cell count ≥ or <50 and patients. A major limitation of STRIDE, however, was that the results are presented as an absolute risk (not rate or hazard), and does not take into account actual person-time at risk. For example, it is not clear how the 62 patients who were lost to follow-up or withdrew from the study were analyzed, since they were not at risk for the entire 48 week period. If the person-time at risk varied across the two study groups, this may potentially impact the main study finding; however, this is not addressed by the investigators.
The CAMELIA RCT by Blanc et al in Cambodia, examined the effect of ART initiation at 2 weeks (earlier ART) or at 8 weeks (later ART), on mortality. The study population
consisted of 661 HIV-infected patients aged 18 years or older, with CD4 cell count<200, and smear-positive TB disease. Patients were followed-up for a minimum of 50 of weeks. The main finding of this study was that earlier ART reduced the risk of mortality [HR=0.62; 95% CI: (0.44-0.86)].[35]
16
with TB disease, especially in other geographic settings such as sub-Saharan Africa, is questionable.
The TIME RCT by Manosuthi et al in Thailand, examined the effect of ART initiation at 4 weeks or at 12 weeks, on the primary endpoint, mortality at 1-year. The study population consisted of 156 HIV-infected patients aged 18-65 years, with CD4 cell count<350, clinically or bacteriologically diagnosed active TB, no previous ART, and normal serum creatinine and aspartate aminotransferase and alanine aminotransferase (ALT) levels. Additionally, pregnant women were excluded from the study. The intended follow-up period was 96 weeks, however, because this study was prematurely ended on May 2011, some patients had shorter or insufficient follow-up and consequently, power was only 70%. The primary finding of this study was no statistically significant association between early ART initiation and mortality at 1-year
(RR=0.85; 95% CI: (0.25 – 2.89).[36] In contrast to previous studies, this finding did not change after stratification by CD4 count; in fact, although still non-significant, the direction of the effect changed from protective to harmful [RR=1.59; 95% CI: (0.40 – 6.40) among CD4 count <50 cells/mm3 and RR=1.24; 95% CI: (0.34 – 4.54), among CD4 count <100 cells/mm3].
17
methodological reasons for this discrepancy. For example, it is not clear what sample sizes in each exposure category were generated by each of the timing cut-points. Since this study was not randomized, if only a small proportion of patients initiated ART within 2 months or 4 months, this may have negatively affected power to detect a difference using these cut-points. Furthermore, it is not clear whether the investigators adjusted for covariates in the models used to generate the HR estimates for the timing analyses; a necessary step to address potential confounding bias.
A prospective observational study by Varma et al in Thailand, examined the effect of initiating ART within various timepoints following start of TB treatment (versus not) on
survival. The study population for timing analyses consisted of 200 HIV-infected patients, aged 17 or older, receiving treatment for TB disease for <4 weeks between May 2005 and Sep 2006, who initiated ART during the period of TB treatment. The main finding from this study was that ART initiation within 4 months (versus not), improved survival among bacteriologically
confirmed cases of TB disease (HR=9.0; 95% CI: 1.1-73.0). Overall, there appeared to be a linear relationship between time to ART initiation and mortality; the longer ART was delayed, the higher the risk of mortality. Although, a Cox proportional hazards model was used to generate these estimates, because of the relatively small sample size, the investigators only adjusted for the severity of TB disease and baseline CD4 count. In addition, the incidence of IRIS was not studied according to ART timing status; therefore, the potential trade-off associated with early initiation was not apparent.
18
initiated ART between time of TB diagnosis and the end of the study period. The main finding of this study was that ART initiation within 2 months reduced mortality, particularly in the time soon after TB diagnosis [adjusted-HR: for 6 months=0.15 (0.03-0.59); 1 year=0.33 (0.14-0.78); full follow-up period=0.37 (0.17-0.66)].[37]
A major limitation of this study is the retrospective design and subsequent potential for selection, information, and confounding biases, and reverse causality. In addition, because this study was conducted in Spain, the results may not be generalizable to limited-resource settings.
A retrospective observational study by Franke et al in Rwanda, utilized advanced modeling methods to examine the effect ART initiation at various timepoints during TB treatment on survival. The study population consisted of 308 HIV-infected patients, aged 15 years or older, with baseline CD4 cell count <350, who were treated for TB disease at one of 5 ART sites between January 2004 and February 2007. The probability of survival was modeled to simulate a hypothetical scenario in which all patients with baseline CD4 cell count of 50, 100, 200 or 300 cells/mm3, initiate ART at 15, 30 60, 180 days, or not at all, after start of TB
treatment. Survival probabilities for ART initiation at 30, 60, 180 days and not at all, were statistically lower than for 15 days, but only when baseline CD4 cell count was set to 50 or 100 cells/mm3.[38]
A major limitation of this study is use of advanced modeling methods that make additional assumptions beyond those in typical regression modeling that is used in
epidemiological studies. A key assumption is that the model that was used to generate survival probabilities was correctly specified and provided accurate predictions. The reliance on
19
As summarized in Table 2.1, taken together, these studies suggest that ART initiation early during the course of TB treatment may offer a survival benefit; however, only among patients with severe immunosuppression. For that reason, a CD4-stratified timing strategy for ART initiation, such as the one suggested in the 2006 and 2012 WHO recommendations, may be appropriate.
Translation of RCT Findings into Real-World Practice: Implementation Fidelity
Findings from RCTs are not always replicable in less strictly controlled settings; this is particularly likely at the primary care level in resource-limited settings. Observational studies from sub-Saharan Africa have found that most patients initiate ART late, after 8 weeks of TB treatment.[6-10] Lack of integration of TB and HIV treatment services has been identified as one of the key contributors to this delay.[9, 10] Interventions to integrate TB and HIV services have been shown to reduce, but not eliminate delay in ART initiation.[11, 12]
20
Figure 2.1 Estimated HIV Prevalence in New Cases of Tuberculosis Disease, 2012
2
1
Table 2.1 Summary of Studies of Effect of ART Timing Among HIV-infected Tuberculosis Patients on Clinical Outcomes of Interest
Study Country/
Design Study Population
ART Timing
Exposure Outcome
Death AIDS or death
SAPiT – Abdool Karim et al, 2010 & 2011
S. Africa/
RCT •
HIV+
•≥18
•smear+ PTB •CD4<500 •(N=642)
Within 2 months v. after 6 months (ref)
HR=0.44 (0.25, 0.79)
Not studied.
Within month v. within 2-3 months (ref)
Death: NS, but, few events, and small sample of patients with CD4<50 (N=37)
Among patients with CD4<50, IRR=0.32 (0.07, 1.13) ACTG 5221 – Havlir et al, 2011 Multiple/ RCT • HIV-infected
• ≥13 yrs
• confirmed or
probable TB
• CD4<250 • (N=806)
Within 2 weeks v. between 8 and 12 weeks (ref)
Not studied as an outcome separate. Among patients with CD4<50, proportion with outcome= 15.5% v. 26.6%; (1.5 – 20.5%; p=0.02 CAMELIA
– Blanc et al, 2011
Cambodia/
RCT •
HIV-infected
• ≥18 yrs
• smear+ TB • CD4≤200
• (N=661)
At 2 weeks v. at 8 weeks (ref)
HR=0.62 (0.44-0.86) Not studied.
TIME – Manosuthi et al, 2012
Thailand/
RCT •
HIV-infected
• 18-65 yrs
• Clinical or bacteriology
confirmed TB
• CD4<350 • (N=156)
At 4 weeks v. at 12 weeks (ref)
RR=0.85 (0.25 - 2.89) Not studied, but
2
2
Manosuthi et al, 2006
Thailand/ retrospective observational
• ART-naïve • HIV-infected • ≥15 yrs
• Dx and Tx TB between Jan
2000 and Dec 2004
• treated for TB • (N=411 on ART)
Binary using 2 month cutpoint
Survival: HR=2.04 (0.69-6.00)
Not studied
Binary using 4 month cutpoint
Survival: HR= 1.97 (0.83-4.72)
Not studied
Binary using 6 month cutpoint
Survival: HR=2.65 (1.15-6.10)
Not studied
Binary using 9 month cutpoint
Survival: HR=2.68 (1.26-5.68)
Not studied
Binary using 12 month cutpoint
Survival: HR=2.37 (1.11-5.06) Not studied Varma et al, 2009 Thailand/ Prospective observational • HIV-infected
• Receiving TB Tx <4 weeks at
enrollment between May 2005 and Sep 2006
• >17 years
• (N=200); restricted timing
analysis to patients who initiated ART during TB treatment
Binary using various timing cutpoints
Survival: 4 month cutpoint, among bacteriologically confirmed TB cases, HR=9.0 (1.1-73.0)
Other cutpoints: NS
Not studied
Within 2 months v. at ≥3 months (ref) Spain/ Retrospective observational • HIV-infected • Adult
• Dx TB between 1996-2004 • ART naïve at TB Dx, but on
ART
• (N=313)
Over full follow-up period: HR=0.37 (0.17-0.66) At 6 months follow-up: HR= 0.15 (0.03-0.59) At 1 year follow-up HR=0.33 (0.14-0.78) Not studied Franke et al Rwanda/ Retrospective observational and modeling • HIV-infected • >15 years • CD4≤350
• ART naïve
• TB Tx Jan 2004 Feb 2007 • (N=308)
ART at 15 (ref), 30, 60 or 180 days after start TB Tx
Survival probabilities for 30, 60, 180 days were
statistically lower than for 15 days, but only when baseline CD4 was set to 50 or 100
23
CHAPTER THREE: STUDY DESIGN AND METHODS
Overview of the ITART Study
24
Study Design of the ITART Study
The ITART study was a prospective observational cohort study consisting of patients diagnosed with TB disease and identified as HIV-positive as a part of TB diagnosis, who were offered ART within the TB clinic under a nurse-driven integrated model. The study enrolled 599 patients from August 2007 to November 2009. Inclusion criteria for the study were: 1. initiation of treatment for TB disease at one of 5 participating health centers, and, 2. confirmation of HIV-infection, and, 3. willingness and ability to provide informed consent. Exclusion criteria for the study were: 1. treatment for TB at non-participating health center, or, 2.on ART at time of TB diagnosis and preference to continue ART at a non-participating health center. Patients were informed of study by the on-site UNC counselor/nurse and asked for written informed consent to participate. The study was approved by institutional review boards at both UNC at Chapel Hill and the University of Kinshasa.
At enrollment, all patients were administered a baseline questionnaire that included demographic, clinical, and behavioral data deemed relevant to the study aims. In addition, laboratory testing including CD4, alanine aminotransferase(ALT), hemoglobin, and a physical exam were conducted. Patients were assessed for ART initiation at enrollment. A
25
Patients on ART were scheduled to receive CD4 and viral load testing every 6 months following ART initiation. Patients were scheduled for follow-up visits weekly during the first two month of TB treatment, monthly from the third month to the end of TB treatment, at the end of TB treatment, and semiannually after the end of TB treatment. During follow-up visits, in addition to any scheduled laboratory testing, a physical exam and questionnaire on adherence, sexual behavior, and disclosure status were administered. Patients who were more than 3 days late for a scheduled follow-up visit were traced using TB clinic nurses. If necessary, study staff contacted patients by phone or by home visit on 2 attempts before being regarded as “lost-to-follow-up”. Other reasons for inactivation from the study including death, loss-to-follow-up, and voluntary withdrawal were also documented. Per study strategy, patients received ART in the TB clinic during the period of TB treatment, and then were transferred to the ART clinic on-site within the same facility. In addition, based on patient preference, some patients were
transferred-out of the study to continue their TB treatment and/or ART at a non-ITART clinic. Patients were also administratively censored at the end the ITART study (in February 2010).
The overall (descriptive) cohort analyses for pediatric and adult patients in ITART have already been conducted, and provide valuable preliminary data for this dissertation study.
Analytical Population
26
diagnosis date, prior to ART initiation) available. The analytical population for Aim2 used the analytical population for Aim1 as a starting point and additionally excluded patients who were not eligible to initiate ART at 1 month or 2 months based on baseline CD4 and/or WHO staging criteria e.g. CD4>350 and no WHO stage 4 condition. Based on this, the analytical population for Aim1 included 492 patients, and the analytical population for Aim2 included 395 patients.
Exposure/Outcome Assessment
For Aim1, there was not a primary exposure since it focused on identifying predictors of the main outcome, which is binary: delayed ART initiation (or not). To define timing of ART eligibility, we compared the ART initiation date with TB treatment start date. To accommodate scheduling limitations, clinic closure on weekends and holidays, and on-site availability of consulting physician, patients eligible for ART initiation at 1 month of TB treatment who were expected to, but did not initiate ART within 1 month plus 5 days of TB treatment, were classified as experiencing delayed ART initiation. Similarly, a 5 day window was applied to define delayed ART initiation among patients eligible for ART initiation at 2 months and completion of TB treatment. Patients who died or were LTFU prior to the time they were eligible plus 5 days who did not initiate ART, were not categorized as experiencing delayed ART. Patients with both baseline and follow-up CD4 count >350 cells/mm3 who did not experience a WHO stage 4 condition during TB treatment, were also categorized as not experiencing delayed ART, since they were not scheduled to initiate ART during TB treatment.
27
period were systematically collected on the patient inactivation form. LTFU was defined as in the ITART study protocol. Patients who were lost to follow up (LTFU) prior to six months were assigned a missing outcome.
Covariate Assessment/Definitions
For Aim1, all covariates hypothesized as potential predictors of delayed ART initiation based on subject matter knowledge and previously published literature were assessed. For Aim2,
covariates were selected for inclusion in a directed acyclic graph (DAG) of the association between ART timing per CD4-stratified strategy and mortality at 6-months (Figure 3.4), based on published literature and subject matter knowledge. Descriptive statistics, distribution of association across sub-categories, substantive area standards, and clinical/programmatic relevance will be considered to define and categorize each covariate as detailed in Table 3.1.
Analytical Approach – Aim1
For Aim1, we used a logistic regression model to identify covariates that are predictive of delay in ART initiation (main outcome as defined above) in the analytical population (N=492). This model was selected because the predictor variables include a combination of both continuous and categorical variables and the outcome variable will be modeled as a categorical, and in this instance we are not attempting to estimate “risk”’; rather, we are attempting to estimate the odds or “ predicted probability” of experiencing delay in ART initiation.
28
assessed in order from highest to lowest Wald chi-square and eliminated from the model based on the likelihood ratio test using an alpha of 0.05.
In addition, we stratified patients by expected timing (1 month, 2 months, end of TB treatment, or deferred TB treatment) and then categorized observed timing as: 1. initiating ART before or at the expected time, 2. initiating ART after the expected time, or 3. not initiating ART. The
median and interquartile range of delay was calculated with each stratum of patients whose ART initiation was after expected.
Analytical Approach – Aim2
For Aim 2, logistic regression and the parametric g-formula was used to estimate the difference in mortality risk under observed and complete implementation fidelity to the strategy for CD4-stratified timing of ART initiation used in the ITART study.
We used a logistic regression model to assess baseline covariates, including timing of ART initiation, as potential predictors of mortality. We first ran a full logistic model containing all selected covariates. Subsequently, we used a backwards elimination stepwise method to generate a final (reduced) predictive model. Covariates were assessed in order from highest to lowest Wald chi-square and eliminated from the model based on the likelihood ratio test using an alpha of 0.10. We estimated crude (OR) and adjusted (adjOR) odds ratios with 95% confidence intervals (CI).
29
proportion of individuals who initiated ART timely, i.e. according to a priori defined CD4 criteria. We calculated each patient’s timing of ART initiation, by comparing the ART start date with TB treatment start date. We categorized timing of ART initiation as per CD4-count strategy
(per strategy) or deviating from CD4-count strategy (not per strategy); similar to how delayed
ART initiation was defined in Aim 1. To accommodate for scheduling limitations, clinic closure on weekends and holidays, and limited availability of consulting physician, a five-day grace period was added to the one or two month of TB treatment to define ART initiation per strategy.
Participants who initiated ART prior to the time they became eligible were classified as per
strategy. Participants who died or were LTFU prior to eligibility for ART and had not initiated
ART were categorized as initiating ART per strategy, since not initiating ART prior to death or LTFU did not constitute deviation from the CD4-stratified strategy. In sensitivity analyses, we explored the impact of narrowing the definition of ART initiation per strategy to exclude patients who were LTFU prior to time of ART eligibility, a subset of patients who could have started timely ART had they been retained in care.
Differences in proportions and medians of baseline characteristics between patients initiating
ART per strategy and those initiating not per strategy were assessed using chi-square or Fisher’s
exact tests and Kruskal-Wallis tests, respectively.
In our study observed timing of ART initiation likely deviated from assigned timing of ART initiation in a proportion of patients, resulting in incomplete implementation fidelity. To estimate the causal effect of implementation fidelity, we need to compare mortality in the study
30
our study, we did not have a comparison group and were not able to directly observe mortality in a population of patients with complete implementation fidelity to CD4-stratified timing of ART initiation. We overcame this by using the parametric g-formula to estimate mortality in the cohort under the counterfactual scenario of complete implementation fidelity.[46-48]
Figure 3.3 provides a step-by-step overview of this methodological approach.[46]
We built a logistic regression model to assess the association between initiating ART per
strategy and mortality (step 1), including baseline covariates hypothesized to be potential
confounders (depicted in the directed acyclic graph in Figure 3.4). We then used parameter estimates from the model to calculate predicted probabilities of death for each patient based on their baseline covariates and observed ART timing (step 2). This modeling method imputes an outcome for each patient based on the average risk across patients with observed outcomes with the same baseline characteristics. Consequently, the outcome of participants who were LTFU is no longer missing, as these participants are assigned an outcome based on their baseline
characteristics. By averaging these predicted probabilities of death across all participants, we estimated the risk of mortality in the full cohort under the observed, real-life level of
implementation fidelity (step 3).
To estimate the causal effect of implementation fidelity, a (counterfactual) probability of death corresponding to what would have happened to each participant had he or she initiated ART per
strategy is needed. We calculated this probability of death based on the outcomes of patients
31
We then calculated the risk difference (RD) by subtracting this mortality risk estimate in the cohort with complete fidelity from the mortality risk estimate in the cohort with observed fidelity (step 6). Bootstrapping was used to generate the 95% confidence interval around the risk
difference. This was done by creating multiple (n=500) datasets through random selection of 395 individuals with replacement from the original ITART study population, followed by rerunning step 1 through step 6, and using the standard error across all the risk differences estimates (step 7). Finally, we estimated the preventable fraction by dividing the RD by the estimated risk in the cohort under observed, real-life implementation fidelity (step 7). This measure is interpreted as the fraction of mortality that could be prevented if 100% implementation fidelity is achieved.
As a worked example, we apply this method for Patient X, who is 32 year old male, whose ART initiation was not per strategy, was tolerating TB treatment, had a CD4 of 45 cells/mm3, did not have any contraindication to ARVs, was diagnosed with smear-positive pulmonary TB, was WHO stage 3, and underweight (BMI <18.5).The logistic regression model that includes a variable corresponding to whether the patient initiated ART per strategy and covariates included in Table 1generated regression parameters such that:
Ln[P(D=1|X=x)]= -2.6590 + 0.0305(age) + -0.6731(female) + -0.9064(per_strategy) + -2.5365(tb_tx_tolerated) + 2.0222(cd4_less_50) + 0.6315(cd4_50_99) + 0.7738(cd4_200_350)+ 0.2346(contraindication) + 0.3727(smear_neg) + 0.0296(extrapulmonary) + 0.3744(who_4) +0.8832(underweight)
Scenario 1: Observed fidelity to CD4-stratified strategy for timing of ART initiation
32
Ln[P(D=1|X=x)]= -2.6590 + 0.0305(32) + -0.6731(0) + -0.9064(0) + -2.5365(1) + 2.0222(1) + 0.6315(0) + 0.7738(0)+ 0.2346(0) + 0.3727(0) + 0.0296(0) + 0.3744(0)+ 0.8832(1)
Ln [P(D=1|X=x)]= -1.3141
P(D=1|X=x)=[ exp(-1.3141)]/[1+ exp(-1.3141)]=0.21
Scenario 2: Complete Fidelity to CD4-stratified timing of ART initiation
In order to estimate the (counterfactual) predicted probability of for Patient X under complete fidelity to ART timing, we used the same regression parameters and baseline characteristics, however, we enter a “1” instead of a “0” for the coefficient corresponding to the regression parameter for ART per strategy. As shown in the calculation below, for Patient X, the predicted probability of death under complete fidelity was 9.5%:
Ln[P(D=1|X=x)]= -2.6590 + 0.0305(32) + -0.6731(0) + -0.9064(1) + -2.5365(1) + 2.0222(1) + 0.6315(0) + 0.7738(0)+ 0.2346(0) + 0.3727(0) + 0.0296(0) + 0.3744(0)+ 0.8832(1)
Ln[P(D=1|X=x)]= -2.251
P(D=1|X=x)=[ exp(-2.251)]/[1+ exp(-2.251)]=0.095
3
3
Table 3.1 Definition of Key Covariates of Interest for Analyses of CD4-Stratified ART Timing
Covariate Assessment in ITART Study Definition Used in Analyses
DEMOGRAPHIC
Gender Patient self-reported gender at enrollment as either female or male
Female v. male
Age Patient self-reported age in years at
enrollment
Aim1: ≥40 years v. <40 years Aim2: age in years
Marital Status Patient self-reported marital status as either married or unmarried at enrollment
Married v. unmarried
Education Patient self-report of highest level of
education completed as either none, primary, secondary, or higher education.
≥Secondary or <Secondary
Employment Patient self-report of employment status as either employed or unemployed at enrollment.
Employed or unemployed
Mode of transport to clinic Patient self-report of model of transport to clinic as walking, taking a taxi/bus, or other to be specified.
Walking v. vehicle
Travel time to clinic Patient self-report of travel time in minutes to clinic.
≥30 minutes v. <30 minutes
TB VARIABLES
Type of TB Data on sputum-smear status as either
positive or negative and site of TB disease as either pulmonary or extrapulmonary both were abstracted from the TB clinical records at baseline.
Smear-positive pulmonary v. smear-negative pulmonary v. extrapulmonary (including both)
History of TB Data on history of TB as either new, relapse, failure, or return after default were abstracted from the TB clinical records at baseline.
History of TB (not new) v. no history of TB (new)
Toleration of TB treatment Subjective provider assessment of the patient at the scheduled ART initiation visit as either tolerating (yes) or not tolerating TB treatment (no).
3
4
Disclosure of TB status Patient self-report of either disclosing or not disclosing their TB diagnosis to other healthcare worker, partner, household
member, friend, family member, employer, or other specified person.
Disclosure of TB (yes to one or more person) v. non-disclosure of TB
HIV VARIABLES
Contraindication to ARV Provider report of patient contraindication to any of the following ARVs that were
available in ITART: EFZ, NVP, d4T, and AZT.
Contraindication to any ARV v. no contraindication to any ARV
HIV diagnosis at TB clinic This variable was assessed based on whether the patient self-reported as HIV-positive at the time of TB diagnosis. These patients were re-tested as a part of the study to confirm their HIV diagnosis.
HIV diagnosis at TB clinic (newly diagnosed) v. HIV diagnosis prior to TB clinic
Baseline CD4 cell count Blood draw for selected laboratory testing (including CD4 count) was done at
enrollment visit and specimens were sent to a central laboratory for processing.
Baseline CD4 count was defined as the result available within 30 days of TB treatment start date, since this is the value that would have been considered in ART timing per strategy.
WHO clinical stage WHO clinical staging was assessed by the study nurse at enrollment based on National Institute of Allergy and Infectious Disease, Division of AIDS (NIAD DAIDS) standard guidelines. All patients with pulmonary TB are WHO stage 3 by default. Patients with HIV wasting syndrome, pneumocystis pneumonia, recurrent bacterial pneumonia, herpes simplex, esophageal candidiasis, Karposi’s sarcoma, cerebral toxoplasmosis, HIV-associated encephalopathy, or
extrapulmonary TB were defined as WHO stage 4.
3
5
Disclosure of HIV status Patient self-report of either disclosing or not disclosing their HIV diagnosis to other healthcare worker, partner, household
member, friend, family member, employer, or other specified person.
Disclosure of HIV (yes to one or more person) v. non-disclosure of HIV
GENERAL CLINICAL VARIABLES
Hospitalization in the prior year Patient self-report at enrollment of whether or not they have ever been hospitalized. For patients who reported prior hospitalization, the year of hospitalization was also noted.
Hospitalization in the calendar year prior to the calendar year of TB treatment start v. not (all other patients)
Functional status Health provider assessment of the patient’s functional status at enrollment as: no limitations, ambulatory, in bed more than usual, bedridden).
Poor (in bed more than usual or bedridden) v. good (no limitations or ambulatory)
Body mass index (BMI) Height and weight were assessed and
recorded by the provider at enrollment. BMI is calculated as weight in kilograms divided by height in meters squared.
Standard BMI categories of: underweight <18.5, normal 18.5-25, overweight 25-30 overweight, >30 obese.
Alcohol use Patient self-report on two alcohol-related variables that ask about frequency of drinking during a given week and the quantity of alcohol consumed in one sitting. There were few patients who met the definition of heavy drinking (frequent and high quantity).
36
Figure 3.1 Application of Inclusion/Exclusion Criteria to Generate Analytical Populations
• Diagnosed with TB at ITART clinic
• Confirmed HIV infection
• ART-naïve or ART-experienced
and willing to continue ART at ITART clinic
• Provided informed Consent
Enrolled in ITART Study N=599
Age ≥13 years at enrollment N=581
Baseline CD4 available N=492
ART-naïve at enrollment N=524
Enrolled in ITART within 1 month of TB treatment N=559
Included in Analytical Population Aim1 N=492
Scheduled to initiate ART at 1 or 2 months N=395
37
38
Figure 3.3 Steps of the parametric g-formula method to estimate the risk difference between the ITART population under observed and complete implementation fidelity to
timing of ART initiation per CD4-stratified strategy
1. Build a logistic regression model of the association between initiating ART per strategy and mortality.
2. Use parameter estimates from model to calculate predicted probabilities of death for each patient based on their baseline factors (summarized in Table1) and observed ART timing. 3. Estimate the risk of death in the ITART population with observed fidelity to ART timing
per CD4-stratified strategy, by taking the average of the predicted probabilities across all patients.
4. Recalculate predicted probabilities for each patient under scenario of complete fidelity to ART timing per CD4-stratified strategy.
5. Estimate the risk of death in the ITART population with complete fidelity to ART timing per CD4-stratified strategy by taking the average of the predicted probabilities of death calculated in step4 across all patients.
6. Estimate the risk difference by subtracting the risk of death in the ITART population with complete fidelity from the risk of death in the ITART population with observed fidelity. 7. Bootstrap the 95% confidence interval around the risk difference by creating multiple
39
40
CHAPTER FOUR: TIMING AND PREDICTORS OF DELAY OF ANTIRETROVIRAL THERAPY INITIATION AMONG PATIENTS RECEIVING INTEGRATED
TUBERCULOSIS AND HIV TREATMENT
Characteristics at Baseline and Scheduled ART Initiation
Between August 2007 and November 2009, 599 patients diagnosed with TB and HIV were enrolled within the ITART study. Among them, 107 were sequentially excluded based on age<13 years (n=18), enrollment more than one month after TB treatment initiation (n=22), exposure to ART prior to enrollment (n=35), and lack of baseline CD4 count (n=32). The remaining 492 patients were included in the analysis.
Baseline characteristics of these patients are shown in Table 4.1. Participants were 60.0% female, 44.5% married, and had a median age of 38 years (IQR 32-45). Most (92.3%) patients were of low SES, less than half (46.3%) were employed, and 61.6% had at least completed secondary education. The majority (75.4%) of patients walked to the clinic, with about half (48.6%) spending over 30 minutes to get to the clinic. Of patients with pulmonary TB (79.7%), half were smear-negative. Overall 25.4% had a prior history of TB treatment. Most (95.3%) patients were newly diagnosed with HIV as part of the TB diagnostic process.
41
disclosed their TB status, while less than half (40.0%) had disclosed their HIV status. At their scheduled ART initiation visit, 145 (29.5%) of patients were assessed by the health provider as not tolerating TB treatment. In total, 26 (5.3%) of patients had contraindication to one or more antiretroviral drug. Reasons for contraindication included: pre-existing peripheral neuropathy for stavudine (n=22), pregnancy for efavirenz (n=1), and anemia for zidovudine (n=2).
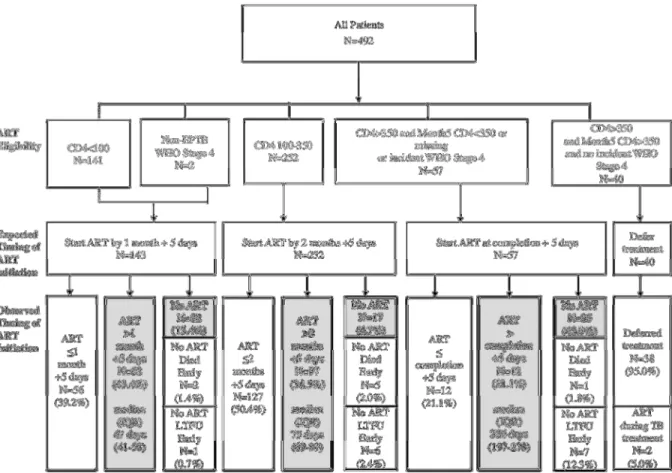
Timing of ART Initiation
A total of 143 (29.1%) patients were eligible for ART initiation at 1 month of TB treatment, nearly all (n=141) because of CD4<100 cells/mm3. Another 252 (51.2 %) patients were eligible for ART initiation at 2 months of TB treatment, based on CD4 100-350 cells/mm3. The majority (58.8%, n=57) of patients with baseline CD4 >350 (n=97) were eligible for ART initiation at completion of TB treatment based on a CD4 ≤350 cells/mm3 at month 5 (n=18), lack of follow-up CD4 count (n=32), or incident WHO stage 4 condition (n=7).
42
Of the 86 patients who never initiated ART, eight died a median of 20 days (IQR 8-30) before the time of eligibility for ART initiation. Of these, two had baseline CD4 count <100 cells/mm3, five had baseline CD4 count 100-350 cells/mm3, and one had baseline CD4 count >350
cells/mm3. Fourteen patients were lost-to-follow-up prior to the date they became eligible for ART initiation. One patient was considered ineligible for ART due to the presence of a terminal illness at their scheduled ART initiation visit and died thereafter. Three patients refused ART as they did not feel ready to start long-term therapy. Two patients who never initiated ART self-reported suboptimal adherence to TB treatment (at least one missed dose within the prior four days) at the scheduled time of ART initiation.
Predictors of Delay in ART Initiation
43
44
Table 4.1 Characteristics at baseline of 492 patients participating in the Integrated Tuberculosis and Anti-Retroviral Treatment (ITART) study at five primary
care clinics in Kinshasa, Democratic Republic of Congo
Characteristic n %
Female 295 60.0
Age <30 94 19.1
30-39 182 37.0
40-49 184 33.3
≥50 52 10.6
Married 219 44.5
Completed secondary education 303 61.6
Employed 228 46.3
Low socio-economic status 454 92.3
Walk to clinic 371 75.4
Travel time to clinic (minutes) <10 18 3.7
10-19 141 28.7 20-29 94 19.1 30-39 136 27.6 ≥40 103 20.9
TB type Smear + Pulmonary 193 39.2
Smear – Pulmonary 199 40.5
Extrapulmonary 100 20.3
History of TB 125 25.4
HIV diagnosis at TB clinic 469 95.3
CD4 count (cells/mm3) <50 77 15.6
50-99 64 13.0
100-199 136 27.6
200-350 118 24.0
>350 97 19.7
Hospitalization in Prior Year 77 15.7
Poor Functional Status 27 5.5
BMI Underweight (<18.5) 283 57.5
Normal (18.5-24.9) 194 39.4
Overweight (25.0-29.9) 12 2.4
Obese (≥30) 3 0.6
Alcohol use (any) 201 40.9
Disclosure of TB status 439 89.2
45
Figure 4.1 Distribution of ART eligibility, expected timing of ART initiation, and observed timing of ART initiation in 492 patients receiving integrated TB and HIV
treatment at five primary care clinics in Kinshasa, Democratic Republicof Congo.*
4
6
Table 4.2 Predictors of Delayed ART Initiation in 492 patients participating in the Integrating Tuberculosis and Anti-Retroviral Treatment (ITART) study at five primary care clinics in Kinshasa, Democratic Republic of Congo
Crude OR Univariate Model
(95% CI)
Adjusted OR Full Model
(95% CI)
Adjusted OR Reduced Model
(95% CI)
Female 1.00 (0.70-1.44) 0.97 (0.65-1.45) --
Age >40 years 1.06 (0.74-1.52) 1.01 (0.68-1.51) --
Married 0.73 (0.51-1.04) 0.69 (0.46-1.01) --
Secondary Education 0.88 (0.61-1.27) 0.94 (0.64-1.40) --
Employed 0.88 (0.62-1.26) 1.04 (0.69-1.58) --
Low SES 0.57 (0.29-1.12) 0.59 (0.29-1.22) --
Walk to Clinic 0.80 (0.53-1.20) 0.83 (0.54-1.16) --
Travel Time >30 min 0.85 (0.59-1.20) 0.79 (0.54-1.16) --
TB Type Smear + Pulmonary referent referent referent
Smear – Pulmonary 1.42 (0.95-2.12) 1.52 (0.98-2.34) --
Extrapulmonary 1.15 (0.71-1.87) 1.03 (0.61-1.72) --
History of TB 0.85 (0.57-1.28) 0.87 (0.56-1.35) --
HIV diagnosis at TB clinic 1.20 (0.52-2.79) 0.89 (0.36-2.20) --
CD4 count (per 100 cells/mm3 decrease) 1.12 (1.02-1.23) 1.18 (1.06-1.32) 1.20 (1.08-1.33)
Prior Hospitalization 1.01 (0.62-1.65) 0.92 (0.54-1.54) --
Poor Functional Status 1.19 (0.55-2.59) 1.42 (0.60-3.33) --
Underweight (BMI<18.5) 0.90 (0.63-1.29) 0.89 (0.60-1.33) --
Alcohol use (any) 0.97 (0.67-1.39) 0.96 (0.65-1.43) --
Non-disclosure of TB status 1.15 (0.65-2.04) 0.87 (0.46-1.64) --
47
CHAPTER 5: CHAPTER FIVE: EFFECT OF CD4-STRATIFIED TIMING OF ANTIRETROVIRAL THERAPY INITIATION ON MORTALITY IN PATIENTS DIAGNOSED WITH TUBERCULOSIS IN A HIGHLY RESOURCE-LIMITED SETTING
Baseline Characteristics of Analytical Cohort
Between August 2007 and December 2009, 599 participants enrolled in the ITART study. Among them, 204 were sequentially excluded based on age<13 years (n=18), lack of baseline CD4 count (n=88), enrollment more than one month after TB treatment initiation (n=1), exposure to ART prior to enrollment (n=0), and CD4>350 (n=97). The remaining 395 participants were included in the analysis.
Baseline characteristics of patients are presented in Table 5.1. Most (80%) participants were diagnosed with pulmonary TB. Type of TB was positive pulmonary in 35%, smear-negative pulmonary in 45%, and extrapulmonary in 20% of patients. Just over half (59%) were female and median age was 38 (IQR: 32-45). Most patients were underweight (median BMI 17.8, IQR: 16.5-19.7; 59.2% BMI<18.5). Patients presented late in the HIV disease process, with a median CD4 count of 131 cells/mm3 (IQR: 63-224). Of the 143 (36%) patients eligible for ART at 1 month, 77 (54%) had CD4<50 cells/mm3, 64 (45%) had CD4 50-99, and 2 (1%) had CD4>100 and WHO stage 4. Of the 252 (64%) patients eligible for ART at 2 months, 136 (54%) had CD4 100-199 and 116 (46%) had CD4 200-350. Few (n=24, 6%) of patients had
contraindication to one or more antiretroviral drugs.
48
Implementation Fidelity to CD4-stratified Timing of ART Initiation
Overall, 183 (46%) participants initiated ART per strategy. Among the 212 (54%) participants who initiated ART not per strategy, 53 (25%) never initiated ART and 159 (75%) initiated ART with a median delay of 11 days (IQR: 4-24). Median delay did not differ by time of eligibility (12 days for 1 month v. 10 days for 2 months, p=0.62). Patients whose timing of ART initiation
was per strategy had higher CD4 count (151 v. 113 cells/mm3, p=0.002) and higher frequency of
tolerating their TB drugs (96% v. 70%, p<0.0001) at the scheduled time of ART initiation than patients whose timing of ART initiation was not per strategy.
Predictors of Mortality in First Six Months of TB Treatment
Results of predictive modeling of mortality are presented in Table 5.2. In a series of crude (unadjusted) models, CD4 count <50 cells/mm3 (OR 6.0, 95% CI: 2.2-16.4), and TB treatment intolerance (OR 12.3, 95% CI: 5.6-27.3) were predictive of mortality. In the final (reduced) model, TB treatment intolerance (adjOR 12.7, 95% CI: 4.8-33.2), CD4 count <50 cells/mm3 (adjOR 7.3, 95% CI: 2.3-23.3), and male gender (adjOR 2.4, 95% CI: 1.0-5.6) were predictive of mortality. In addition, underweight (adjOR 2.2, 95% CI: 0.9-5.6), and not initiating ART per strategy (adjOR 2.5, 95% CI: 0.9-6.6) doubled the risk of mortality, although not statistically significantly.
Mortality under Observed Implementation Fidelity to CD4-stratified ART initiation
49
When estimating the risk in the full cohort (i.e. including those LTFU) using the predicted outcome probabilities from the logistic regression model, the six-month mortality risk under observed implementation fidelity was 12.0% (95% CI: 8.2-15.7%).
Causal effect of implementation fidelity on six-month mortality