World Resources Institute
World
Resources
Institute
10 G Street, NE
Washington, D.C. 20002 USA www.wri.org
For more information, visit www.safeclimate.net
Working 9 to 5 on Climate Change:
An Office Guide
Samantha Putt del Pino
Pankaj Bhatia
WHAT CAN
WE DO?
WHAT CAN
WE
DO?
T I T L E iiiii
Working 9 to 5 on Climate Change:
An Office Guide
Samantha Putt del Pino
Pankaj Bhatia
World
Resources
Institute
ii ii ii ii
ii W o rl d Re s o u r c e s I n s t i t u te
CAROL ROSEN Publications Director MARTHA SCHULTZ Production Manager WENDY VANASSELT Editor
MAGGIE POWELL Design and Layout BILL LAROCQUE Illustration
Each World Resources Institute report represents a timely, scholarly treatment of a subject of public concern. WRI takes responsibility for choosing the study topics and guaranteeing its authors and researchers freedom of inquiry. It also solicits and responds to the guidance of advisory panels and expert reviewers. Unless otherwise stated, however, all the interpreta-tion and findings set forth in WRI publicainterpreta-tions are those of the authors.
Copyright © 2002 World Resources Institute. All rights reserved. ISBN 1-56973-530-1
Library of Congress Control Number: ___________________ Printed in the United States on recycled paper.
Cover stock contains 100% postconsumer fiber; text stock contains 30% postconsumer fiber.
w w w . s a f e c l i m a t e . n e t i i ii i ii i ii i ii i i A
AA A
Ac kc kc kc kc knononononowledgmenwledgmenwledgmenwledgment swledgment st st s ...t s... i vi vi vi vi v I n
I nI n I n
I nt rt rt rt rt roooooducducducductionductiontiontiontion ... 11111 Step 1
S SS S
Securecurecurecure Orecure Ore Ore Organizae Organizaganizaganizaganizational Stional Stional Supptional Stional Suppuppuppuppo ro ro ro rttttt ...o r ... 77777 Step 2
P PP P
Plan lan lan lan Ylan YYYYour Cour Cour COour Cour COOOO22222 Inv In In In Invvvvenenenenenttttto ro ryo ro ro ryyyy ... 1 1...1 11 11 11 1 Step 3
G GG G
Gaaather Daather Dther Dther Dather Daaaat at a ...t at at a... 1 7...1 71 71 71 7 Step 4
C CC C
Calculaalculaalculaalculaalculattttte e e e Ye YYYour EYour Eour Eour Eour Emissionsmissionsmissionsmissionsmissions ... 3 13 13 13 13 1 Step 5
E EE E
Establish an Establish an Establish an Establish an Emissions Rstablish an Emissions Rmissions Rmissions Rmissions Reduceduceduceduceduction tion tion tion tion TTa rTTTa ra ra ra rgetgetget ...getget... 4 34 34 34 34 3 Step 6
R RR R
Reduceduceduceduceduce e e e e YYYYYour Cour Cour Cour Cour COOOOO2 2 2 2 2 EEEEEmissionsmissionsmissions ...missionsmissions... 4 54 54 54 54 5 Step 7
R RR R
Repepepepepo ro ro ro ro rt t t t t YYour CYYYour Cour Cour Cour COOOOO22222 In In In In Invvvvvenenenttttto renen o ro ro ro ryyyyy ... 5 15 15 15 15 1 N
NN N
Nototototesoteseseses ... 5 35 35 35 35 3 A
AA A
Appppppppppendicendicendicendicendiceses ...eseses... 5 4...5 45 45 45 4
table of contents
Your feedback is valuable!
We’d like to know who uses this Guideand how we can improve it. Send your comments, questions,
ideas, and experiences to
iv iv iv iv
iv Wo rl d R e s o u r ce s I n s t i t u t e
acknowledgments
We would like to thank our colleagues within the World Resources Institute and those from other organizations and businesses that peer-reviewed this Guide and provided valuable feedback. Reviewers
Gretchen Hoff, Frances Irwin, Nancy J. Kiefer, and James J. MacKenzie, World Resources Institute;
William Burnidge; Lily Donge, Calvert Asset Management Co.; Jill Gravender, California Climate Action Registry; Markus Ohndorf, World Business Council for Sustainable Development; J.P. Ross, Greenpeace Clean Energy Now!; Timothy Roskelley, NESCAUM; Holly S. Siprelle, American Psychological Association.
Special thanks also to
Rob Day and Gwen Parker for getting the idea of WRI’s CO2 commitment off the ground; Elizabeth Cook, Christian Layke, Janet Ranganathan, and the GHG Protocol Initiative partners for their continued guidance and support; Hyacinth Billings, Bill LaRocque, Maggie Powell, Martha Schultz, and Wendy Vanasselt for their editorial, design, and production expertise.
This publication is a joint activity of WRI’s GHG Protocol and SafeClimate projects. We would like to thank the following organizations for their generous financial support of these two initiatives: Anglo American, AT&T Foundation, Baxter International, BP, Conservation International, Det Norske Veritas, The Dow Chemical Company, DuPont, Energy
Foundation, Environment Canada, Ford Motor
Company, General Motors, Green Mountain Energy, International Paper, SC Johnson & Son, Steven and Michele Kirsch Foundation, Lafarge, Norsk Hydro, John D. and Catherine T. MacArthur Foundation, Monsanto Company, Charles Stewart Mott
Foundation, The New York Community Trust, Spencer T. and Ann W. Olin Foundation, Ontario Power Generation, Petro-Canada, PowerGen, SGS, Shell, Statoil, STMicroelectronics, Sulzer, Suncor, Swiss Re, Texaco, Tokyo Electric Power Company, Total Fina Elf, Toyota, TransAlta, U.S. Agency for International Development, U.S. Environmental Protection Agency, Volkswagen, and the World Business Council for Sustainable Development.
We would also like to express our special thanks to Nancy J. Kiefer and Bill LaRocque for their generous financial and in-kind support that made the illustrations in this Guide possible.
w w w . s a f e c l i m a t e . n e t 11111
INTRODUCTION
What Does the Guide Provide?
An introduction to climate change and the ways that offices contribute to this global problem
Seven simple steps you can take to measure your office’s carbon dioxide (CO2) emissions
Suggestions for reducing your office’s CO2 emissions
Who Should Use This Guide?
This Guide is for office-based organizations (“offices”) that do not undertake any manufacturing activities. Examples include consulting companies, research and educational institutions, government agencies, and nongovernmental organizations (NGOs). The methodologies and ideas for reducing your office’s emissions are applicable to a variety of office sizes, types, and locations. And, don’t worry, you won’t need advanced statistics skills to use this Guide, just basic math skills, a calculator, and a spreadsheet program. Organizations that undertake manufacturing activities or have complex organizational and ownership structures, such as partly owned entities or subsidiaries, should refer to The Greenhouse Gas (GHG) Protocol Initiative (GHG Protocol) for guidance on measuring and reporting emissions (See Box 1).
The information contained in this Guide, as well as the calculation spreadsheets provided on-line, build on and are consistent with the GHG Protocol. For more detailed guidance on measuring and reporting greenhouse gas emissions, see the GHG Protocol. The GHG Protocol standards, guidance, and calculation tools can be downloaded from the Protocol website at http://www.ghgprotocol.org.
BOX 1 THE GHG PROTOCOL
The GHG Protocol is a unique multi-stakeholder partnership of businesses, NGOs, and
governments, led by the World Resources Institute (WRI) and the World Business Council for Sustainable Development (WBCSD). It serves as the premier source of knowledge on corporate GHG accounting and reporting and draws on the expertise and contributions of individuals and organizations from around the world. The first edition was published in 2001 and a second edition will be released in 2003 (http://www.ghgprotocol.org).
According to the U.S. Department of Energy, 35 percent of the commercial workforce, or approximately 29 million people, work in office buildings across the country.
—U.S. Department of Energy,
2 2 2 2
2 Wo r l d Re s o u r c e s I n s t i t u te
BOX 2 GREENHOUSE GASES
The six main gases are:
CO2 Carbon dioxide
CH4 Methane
N2O Nitrous oxide
HFCs Hydrofluorocarbons
PFCs Perfluorocarbons
SF6 Sulphur hexafluoride
WHAT IS CLIMATE CHANGE?
Climate change is a gradual change in the global temperature caused by the accumulation of greenhouse gases (GHGs) in the atmosphere. (See Box 2.) These gases absorb infrared radiation as it is reflected from the Earth’s surface. The effect is similar to having a “blanket” of gases around the Earth keeping it warm. Increasing atmospheric GHG concentrations are causing the Earth’s temperature to rise as more and more infrared radiation is trapped in the atmosphere.
increase in violent storms and disease. The result is widespread harm to ecosystems.
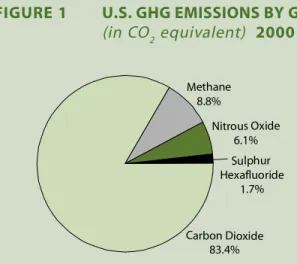
The most significant greenhouse gas is carbon dioxide (CO2), which makes up approximately 83 percent of U.S. GHG emissions. (See Figure 1.)
Current atmospheric CO2 concentrations are roughly 30 percent higher than pre-industrial levels. Although carbon is naturally occurring and essential to life, ever-increasing emissions of carbon from fossil fuel combustion and deforestation are upsetting the Earth’s natural balance; consequently, there is less carbon in the soil and vegetation and more in the atmosphere. Because CO2 in the atmosphere captures
the sun’s heat, increasing amounts destabilize the global climate.1 The Intergovernmental Panel on Climate Change (IPCC, http://www.ipcc.ch), the world’s most authoritative voice on climate change science, has stated that “the balance of evidence suggests a discernible human influence on global climate.” Nearly 85 percent of human-induced GHGs in the United States comes from the burning of fossil fuels (coal, natural gas, and petroleum).2
Greenhouse gases remain in the atmosphere for decades or centuries3 (depending on the type of gas), and their potential impacts may escalate over time. Even if we start reducing global emissions today, atmospheric CO2 concentrations (the most prevalent GHG) will continue to grow for years to come. To minimize risks, all sectors need to act now to reduce their CO2 emissions.
For on-line resources and data on climate change, see Appendix III.
Footnotes
1World Resources 2000–01, World Resources Institute. 2Greenhouse Gases, Global Climate Change and Energy,
Energy Information Administration, U.S. Department of Energy, http://www.eia.doe.gov/oiaf/1605/
ggccebrochapter1.html.
3 U.S. Environmental Protection Agency,
http://yosemite.epa.gov/oar/globalwarming.nsf.
Although climate change is often referred to as global warming, “climate change” is a more accurate term because although overall temperatures are rising, some regions may become colder. Scientists predict such changes will disrupt weather systems, generating floods and droughts, and cause an
FIGURE 1 U.S. GHG EMISSIONS BY GAS
(in CO2 equivalent) 2000
Source: Inventory of U.S. Greenhouse Gas Emissions and Sinks: 1990–2000 Nitrous Oxide
6.1% Methane
8.8%
Carbon Dioxide 83.4%
Sulphur Hexafluoride
w w w . s a f e c l i m a t e . n e t 33333 WHAT ARE THE IMPACTS OF CLIMATE CHANGE?
The impacts of climate change are manifold, and affect every aspect of our lives. Below is an overview of these impacts.
Negative Economic Impacts
The insurance industry has lost billions of dollars over the last few years as a result of extreme weather. Climate change will likely subject some regions to even more frequent storms and precipitation. Growing populations in areas considered vulnerable to flooding, like Florida, could exacerbate the economic impact of extreme weather events (EPA, http://yosemite.epa.gov/oar/globalwarming.nsf ).
Depletion of Natural Resources Climate change could magnify the cumulative impacts of other ecosystem stresses caused by human development, such as air and water pollution and habitat destruction, with costly repercussions. For some systems, such as coral reefs, the combined effects of climate change and other stresses are likely to bring large-scale irreversible impacts (U.S. Global Change Research Program, http://www.usgcrp.gov/). Fifty-eight percent of the world’s reefs are already at risk from over fishing, pollution, and fishing with poisons or dynamite,1 jeopardizing fish, tourism, and the natural coastal protection that reefs provide— a potential loss of about $375 billion a year.2
Flooding
A rise in sea level from climate change will threaten buildings, roads, and other infrastructure in
vulnerable places. For example, infrastructure damage in Alaska is related to permafrost melting, sea level rise, and storm surge in low-lying coastal areas (U.S. Global Change Research Program, http://www.usgcrp.gov/).
Disease
Climate change could increase the prevalence of some infectious diseases, like malaria, dengue fever, yellow fever, and encephalitis, which are carried by
mosquitoes and other insects, if warmer weather allows those insects to travel farther north (EPA, http://yosemite.epa.gov/oar/globalwarming.nsf ).
Water Shor tages
Many regions are already water-scarce because of drought, floods, or water pollution. Climate change will cause further water shortages in regions where summer water supplies are dependent on winter snowfall. Receding winter snow pack levels will leave less snow to melt and supply water in the summer (U.S. Global Change Research Program, http://www.usgcrp.gov/).
Habitat Destruction
Some major mammals may be seriously threatened by reductions of sea ice from warming in 50 to100 years. Whales in the Southern Hemisphere, for example, will be jeopardized by decreased abundance of krill, their primary food source.3 Local extinctions of polar bears are possible; as ice melts sooner in the spring in the northern ocean, and forms later in the fall, their hunting season will be reduced and they will be forced to rely on fat reserves longer. Studies show that females and their
cubs at the southern edge of their range already have lower body weights, and lighter cubs are less likely to survive than heavier ones.4
Ecosystem Disruption
Some ecosystems, such as alpine meadows, could disappear entirely, replaced by forests as tree lines move higher. Barrier islands could be flooded by rising sea levels (U.S. Global Change Research Program, http://www.usgcrp.gov/).
Glacial Melting
Increased temperatures over the last century have accelerated glacier loss worldwide. In Montana’s Glacier National Park, the largest remaining glaciers are now only a third as large as they were in 1850. Experts predict that under current rates of warming, all the glaciers in the park will melt by 2030 (EPA, http://yosemite.epa.gov/oar/globalwarming.nsf ).
For more resources detailing the impact of climate change, see Appendix III.
Footnotes
1 World Resources Institute, Reefs at Risk, 1998.
2 Robert Costanza et al. “The Value of the World’s Ecosystem
Services and Natural Capital,” Nature 387 (May 15, 1997),
256 as cited in Reefs at Risk, WRI, 1998.
3 Pacific Institute, From the Harpoon to the Heat: Climate
Change and the International Whaling Commission in the 21st Century, 2000. http://www.pacinst.org/IWCOP.pdf.
4 International Panel on Climate Change, 2001; World Wildlife
Fund, 1999; Climate Change and Polar Regions, EPA.
4 4 4 4
4 Wo r l d Re s o u r c e s I n s t i t u te
WRI’s Climate Goal
Protect the global climate system from further harm due to emissions of greenhouse gases and help humanity and the natural world adapt to unavoidable climate change.OFFICES AND CLIMATE CHANGE:
UNDERSTANDING THE CONNECTION
Lights, heating and cooling, computers, printers, copiers, business travel, and commuting—these are all ways that your office, even if it is small, contributes to global climate change, the gradual warming in global temperature which looms as one of the world’s most vexing environmental and economic problems.Usually we think of industry—of factories with
smokestacks—when we consider the major sources of the carbon dioxide emissions that contribute to climate change. And that’s right: The industrial sector is the largest source of emissions in the United States. (See Figure 2.) However, offices account for a surprisingly large part of the climate change problem. Here are some statistics provided by the United States Department of Energy (DOE):1
Office buildings account for 19 percent of all commercial energy consumption.
Seventy percent of office building energy consumption is electricity, which is used for lighting, heating, cooling, and office equipment.
Office buildings account for 21.8 percent of energy expenditures in commercial buildings, at a cost of approximately $17.8 billion annually.
More than one-fourth of U.S. GHG emissions are from transportation sources. This includes travel by road, rail, and air, including the transportation-related emissions generated by employees traveling for office-related business and commuting to and from their jobs.
Eighty percent of transportation-related fossil fuel use comes from road transportation and 13 percent from aviation.2 Forty-seven percent of
passengers on U.S. domestic flights are traveling for business.3
WRI’S CLIMATE COMMITMENT:
A CALL TO ACTION
When WRI moved to new, “green” office space in 1999, two forward-thinking staff members
suggested the organization could do even more to help the environment, and proposed the idea of publicly committing WRI to taking action on climate change by reducing its CO2 emissions. After an Institute-wide staff meeting to present the idea, staff were given opportunities to discuss the suggestion and consider what WRI’s emissions reduction target should be before the idea was put to a staff vote.
To prepare for the vote, staff developed a list of possible target areas and actions for CO2 emissions reductions, along with a list of possible reduction targets and the justification for each. To help colleagues understand the degree to which each action would benefit the environment and affect the Institute’s bottom line, WRI estimated the potential cost savings and emissions reductions for each proposed activity. Some proposed actions were achievable at no cost, such as encouraging staff to
use mass transit; some would potentially save WRI
money, such as turning off equipment when not in use; and others would be at some cost to the
Institute, such as purchasing green power. FIGURE 2 U.S. GHG EMISSIONS BY
ECONOMIC SECTOR
Source: Inventory of U.S. Greenhouse Gas Emissions and Sinks: 1990–2000
Agriculture 8.0%
Commercial 15.9%
Residential 19.4%
Transportation 26.8%
Industrial 29.3%
w w w . s a f e c l i m a t e . n e t 55555
1
T A K I N G R E S P O N S I B I L I T Y2
SETTING AN EXAMPLE3
LEARNING BY DOING4
LEARNING BY SHARINGBOX 3 THE KYOTO PROTOCOL
The Kyoto Protocol is an international agreement to reduce global GHGs that governments are currently ratifying. If entered into force, it will require developed nations to reduce their GHG emissions an average of 5.2 percent relative to their 1990 emission levels during the period from 2008 to 2012.
introduction
With overwhelming approval from staff and seniormanagement, WRI committed to reduce the organization’s emissions to “net” zero by 2005. This means that our total emissions would equal zero, after making internal reductions, such as reducing
energy use in our office, and after purchasing
offsets—that is, emissions reduction projects that
reduce another organization’s emissions.
To engage staff in its new commitment, a contest was organized to solicit the best ideas to achieve emissions reductions. Ideas submitted ranged from providing incentives for staff to walk or bike to work to regularly featuring the emissions reduction efforts of each WRI program on the organization’s intranet. Gift certificates were provided to contest winners.
Three years later, WRI has reduced its emissions by 12.7 percent. Each year the Institute has “offset” its remaining emissions to achieve the target of net zero emissions. Since WRI had already moved into a green, energy-efficient office when the decision was made to reduce emissions, we’ve found it challenging to make further reductions. However, there are still many opportunities available to us that we are continuing to pursue, such as purchasing green “emissions free” electricity for our office.
WRI’s commitment was based on four basic principles:
WRI staff wanted to demonstrate responsibility for our contribution to climate change by measuring and reducing our emissions.
As an environmental organization that encourages business and others to address climate change, we felt it was important to lead by example.
WRI helps design accounting standards and policy instruments to address climate change, including the Kyoto Protocol (See Box 3), so we wanted to learn first-hand
about the potential challenges and opportunities involved for businesses.
WRI wanted to help other organizations initiate their own CO2 reduction programs and innovate based on an exchange of experiences.
TIP!
Guidance and standards for accounting for offsets are being developed as part of the GHG Protocol. See “Accounting for GHG Reduction Projects” on page 50.6 6 6 6
6 Wo r l d Re s o u r c e s I n s t i t u te
The following pages will help you initiate, plan, and implement an organizational commitment
to reduce CO
2
emissions. “S&P Enterprises,” a fictional organization, is used to demonstrate each step.
S T E P
S T E P
S T E P
S T E P
S T E P
S T E P
STEP-BY-STEP SUMMAR
Y
1
2
3
4
5
6
7
S T E P
Reap benefits and be a leader! Report your organization’s commitment and CO
2
inventory publicly.
Take action! Identify and implement opportunities to reduce your office’s emissions.
If necessary and/or appropriate, pursue options for investing in offsets—projects that help
another organization reduce their emissions.
Agree on an emissions reduction target.
Calculate your organization’s emissions using the simple formulae in this handbook,
or spreadsheets provided on-line at http://www.safeclimate.net or http://www.ghgprotocol.org.
Learn what data you need to calculate your emissions and where to find it.
Learn what a CO
2inventory is and how to plan yours.
Secure employee and senior management support for your office’s CO
w w w . s a f e c l i m a t e . net 77777
Step 1:
SECURE
OR GANIZATIONAL
SUPPORT
No one person—office manager, concernedemployee, or member of senior management— can undertake an office CO2 emissions reduction program alone. Successful reduction of CO2 emissions requires (a) changes in an office’s administrative procedures, (b) participation by as many people as possible (in efforts to track use of energy or to use less energy), and (c) regular and effective communication among staff. That’s why your first step will be to build support for this endeavor throughout the organization as a whole, as well as among senior management.
MAKE THE CASE FOR TAKING ACTION
You and your colleagues will want to consider the following reasons for launching an organizational climate commitment:Achieving Cost Savings
For many companies reducing emissions not only results in environmental benefit but can translate into significant cost savings. For example, in the long term, investing in energy-efficient office equipment and appliances will benefit your organization’s
HEALTH BENEFITS OF GHG REDUCTION
Reducing GHG emissions could benefit public health by reducing the negative effects of particulate matter and ozone that result from the burning of fossil fuels. In a 1997 study, WRI, the World Health Organization (WHO), and others estimated that eight million avoidable air pollution-related deaths will occur worldwide by the year 2020.
More recently, researchers evaluated the health benefits in the next 20 years from reductions of GHG emissions from fossil fuels in four heavily populated cities—Mexico City, New York City, Santiago (Chile), and São Paulo (Brazil). The researchers calculated that adopting GHG mitigation technologies would reduce particulate
matter and ambient ozone concentrations by about 10 percent. Conservative estimates suggest these cities could avoid:
64,000 premature deaths (including infants)
65,000 cases of chronic bronchitis
37 million lost or restricted work days
Given that three billion people live in urban areas around the world, this makes a powerful
argument for taking early action to address climate change.
To obtain the full article, visit http:// www.sciencemag.org (access requires a subscription).
8 8 8 8
8 Wo r l d Re s o u r c e s I n s t i t u te
Times Square in New York utilized a variety of energy efficiency technologies to realize energy savings of $500,000. The Parker Chiropractic College in Dallas, Texas, reduced its electricity use by 43 percent by upgrading its chiller plant and control system. Reducing the need to travel can also translate into reduced expenses.
Taking Responsibility for the
Environment
This is an opportunity for your organization to take responsibility for its impact on the Earth’s climate. Potential climate change impacts are far-reaching and widespread action is required to address the problem.
Demonstrating Leadership
Your organization can set an example within your sector. Many leading companies, including SC Johnson & Son, IBM, Kinko’s, Ben and Jerry’s, DuPont, Shell, BP, and Alcoa have already made public commitments and/or are taking action to reduce their GHG emissions. The benefits include cost savings and great public relations for your firm.
Becoming Informed Advocates
Calculating and reducing your organization’s CO2 emissions will help you, your staff, and colleagues better understand the issues involved and help others understand them as well.
Improving Employee Morale
You likely already have advocates for a CO2 emissions project within your office. Polls showKINKO’S: LEADERSHIP IN THE OFFICE SUPPORT SECTOR
As a result of our physical footprint and the nature of our business, Kinko’s has the
potential to leave a substantial impact on the environment. That means we must do more
than our share of the work to leave the world in a better place than when we found it.
— Gary Kusin, President and CEO, Kinko’s
Kinko’s pledged in 1997 to transition its offices and business to energy-efficient technologies and renewable energy sources. As a partner in the EPA’s Green Lights and Energy Star programs, Kinko’s has installed energy-efficient lighting at all new store locations and retrofitted more than 1,000 existing stores with energy-efficient lighting. Kinko’s now prevents up to 66 million pounds of CO2 from being emitted each year— that’s about the same as taking 5,600 cars off the road. Kinko’s is also a founding member of WRI’s Green Power Market Development Group (http:// www.thegreenpowergroup.org), which seeks to
develop corporate markets for green power— power produced by clean, renewable sources like wind and solar. As of mid-2002, 93 Kinko’s stores nationwide are powered by renewable energy. The company buys 7.7 million kilowatt hours per year of green power, effectively displacing the energy usage of about 770 average American households. Thanks to such efforts, Kinko’s has earned its place as a leader among businesses committed to sustainability. For more information about Kinko’s environmental activities, visit http://www.kinkos.com/about_us/environment/ environment.php.
bottom line. According to the EPA, energy costs for a typical office building in the United States are $1.50 per square foot. Energy-efficient equipment can reduce those costs by 30 percent.4 The Center
for Energy and Climate Solutions,5 a nonprofit
organization, has documented numerous companies6 of all sizes and types that are earning
40 to 50 percent returns on energy-saving investments. For example, the office tower at Four
w w w . s a f e c l i m a t e . net 99999
that a majority of Americans across the political spectrum believe that climate change is a serious problem and that it requires action.7 Employees
like working for a company that demonstrates itself as a leader and a good citizen. Improved employee morale can lead to higher employee retention rates, an important factor in competitive labor markets. And, a CO2 emissions reduction effort can build and reinforce office teamwork.
MAKE KEY MANAGEMENT DECISIONS
Once your organization has decided to take action, the following key management decisions will need to be made at the outset:Designating the Climate Champion(s)
It is important to identify a “climate champion” to lead the effort and to include the related activities in his or her job description. Formalizing the job of climate champion makes it more likely that it will be taken seriously and that the effort will be sustained. Although this may seem like a big step, ideally this will someday be a standard part of office/ organizational administration, and offices will routinely track their climate emissions the way they track vacation days available to staff, their financial portfolios, and the depreciation of their capital.
What kind of person makes an ideal “climate champion”?
Enthusiasm is the most important criterion for selecting the person who will champion the project, since generating interest is key to widespread participation and successful implementation. You also want to find someone who is both responsible and a skillful communicator (both orally and in writing), since he or she will need to work closely with staff and share findings and progress with the organization as a whole. A champion doesn’t need to be the company accountant, or someone with advanced math skills, but should be capable of basic calculations. It can be helpful if the champion is someone whose daily schedule is not rigid. The front desk receptionist, for example, may not have enough uninterrupted time to focus on tracking an
inventory and making calculations, and an employee who travels extensively or is already overworked might not be in the office enough or adequately available to engage organizational support and keep the project on track.
“““““
Pick an advocate within your organization. To succeed, your organization must make someone responsible, empowered, andaccountable.
”””””
—Gary Kusin, President and CEO, Kinkos
10 10 10 10
10 Wo rl d R e s o u rc e s I n s t i t u te
Preparing a Budget
Prepare a budget that includes the staff time of your climate champion(s). The number of hours to budget will vary depending on the phase of the project, the size of your organization, and the complexity of your operations. Staff time requirements will significantly decrease once the champion is educated and informed, the project is better established, and new or modified office procedures are in place. An efficient and centralized data gathering process also will help reduce the time needed. Keep in mind that if your organization is large—say several hundred people occupying multiple spaces in multiple buildings—the climate champion’s job will be more time-consuming than if you have a small staff
STEP ONE CHECKLIST
✔
✔
✔
✔
✔
Have you…
●
Identified a “climate champion”
for your organization?
●
Developed and received
approval for the budget?
●
Confirmed that your senior
management has agreed this is
an important and worthwhile
undertaking for the
organization?
housed in one or two offices. You may need to budget some basic resources for the project, such as a computer, a spreadsheet program, and office supplies. As you begin to implement emissions reduction activities, you may also decide to include the cost of these activities in the budget (for example, the purchase of energy-efficient lighting).
Making an Organizational Commitment
Calculating your organization’s emissions is not a small undertaking. It will require time for research and data compilation. Before you begin, ensure that your organization is prepared to commit to a long-term plan to reduce CO2 emissions.
w w w . s a f e c l i m a t e . n e t 1 11 11 11 11 1
Step 2:
PLAN YOUR
CO
2
INVENTORY
ORGANIZATIONAL BOUNDARIES
An organizational boundary defines the facilities/ entities that will be included in your CO2 inventory. For example, if your organization has more than one location, decide if you will report on the CO2emissions generated at each, or the headquarters office only. Will you report on space that you do not own, but lease and occupy? Does your organization lease or sublease space to another organization? If it does, will your organization report the emissions from the subleased space also? The more inclusive your boundary, the more opportunities you are likely to find to reduce emissions.
Keep in mind that you can revisit your choice of an organizational boundary each time you update your inventory. So, for example, if you have limited resources at the project’s outset, you may decide to limit your organizational boundary to one location and expand it to include other locations in
subsequent years.
Example:
S&P Enterprises operates out of two locations. It owns one location and leases space at the other. In the building it owns, S&P subleases an office to another organization. S&P decides to include both locations in its organiza-tional boundary to ensure its inventory is as complete as possible. It also opts to include the subleased space because it realized it can influence emissions there also by installing energy-efficient equipment and lighting, for example. However, if the tenants of the space ever decide to conduct their own inventory, S&P would need to notify them of which emissions sources are already tallied in S&P ’s inventory to acknowledge double-counting.
Once you’ve secured organizational support for your effort, your next task is to plan a CO2 “inventory” for your office—that is, a list of your office’s CO2 emissions sources and their quantities. A CO2 inventory enables you to identify reduction opportunities, set a reduction target, and manage and reduce your office’s CO2 emissions to meet your goal.
First you need to set the “organizational boundary” for the inventory. Put simply, this means deciding which of your office spaces, facilities, or entities (if you have more than one) will be part of your inventory. Second, you need to consider all the ways your operations generate emissions—i.e., through business travel, heating, cooling, or employee commuting—and decide which of these you will track and try to reduce. This is called setting the “operational boundary” for the inventory.
NOTE: Some terms used in this Guide—boundaries, scopes, direct and indirect emissions—may seem highly technical, but we use them here because the terminology is part of the language of GHG Protocol. (See Box 1.) Promoting uniform standards, including consistent methods and terminology, improves the usefulness and credibility of inventory information.
12 12 12 12
12 Wo rl d R e s o u rc e s I n s t i t u te
OPERATIONAL BOUNDARIES
Emissions result from a variety of activities undertaken by your office—from using thephotocopier to traveling to meetings (See Box 4 for a visual depiction). Of all these activities, which will you include in your inventory? Making these selections is called defining your operational boundary.
To determine your operational boundary, you need to understand that there are two categories of greenhouse gas emissions—“direct” emissions and “indirect” emissions—as well as the concept of “scope” developed by the GHG Protocol.
Direct Emissions
These are emissions from sources that you own or control, like a furnace in the basement of your office building, or business travel in a company car. If your organization leases vehicles or equipment and pays for the fuel used, these emissions are also counted as direct emissions for your organization, even though it does not own the vehicle or equipment. Other typical examples are listed in Table 1. Accounting for and reporting on direct emissions is required under the framework of the GHG Protocol. For reporting purposes, direct emissions are called “Scope 1” emissions.
Indirect Emissions
These emissions are consequences of your organization’s activities but occur from sources owned or controlled by another organization. For example, although your organization may own its
w w w . s a f e c l i m a t e . n e t 1 31 31 31 31 3
photocopier, the emissions produced by the photocopier are indirect for your organization. That is because the emissions source—electricity—is at the power plant, not the photocopier. (See Table 1 for other examples.)
For reporting purposes, indirect emissions are divided into “Scope 2” emissions—those from the generation of purchased electricity, steam, or heat—and “Scope 3” emissions—a label which covers everything else. Accounting for and reporting on Scope 2 emissions is required under the GHG Protocol because these are likely to make up a significant percentage of any organization’s inventory and are relatively easy to quantify. Accounting for and reporting on relevant Scope 3 emissions is not mandatory in the GHG Protocol but is encouraged because it increases emissions reduction opportunities.
Why is the distinction between direct and indirect emissions important? If emissions by businesses are regulated by the government in the future, those regulations will likely distinguish between direct and indirect emissions to ensure that different organizations don’t double-count the same emissions as direct emissions. For this reason, emissions are specifically defined to help clarify which emissions an organization owns (direct), and which it does not (indirect). The GHG Protocol developed the concept of “scope” to add further clarity to direct and indirect emissions and how an organization should report them.
plan your co
2
inventory
S E C R U O S S N O I S S I M E E C I F F O F O S E L P M A X E 1 E L B A T 1 E P O C S … m o r f s n o i s s i m e t c e r i D • • • • e h t y b d e n w o e r a t a h t s e c a n r u f r o s r e l i o b n i l e u f f o n o i t s u b m o C n o i t a z i n a g r o g n i t r o p e r y b d e n w o s i t a h t t n e m p i u q e n i t a e h r o , m a e t s , y t i c i r t c e l e f o n o i t a r e n e G n o i t a z i n a g r o g n i t r o p e r e h t , y n a p m o c g n i t r o p e r e h t y b d e n w o e r a t a h t s e l c i h e v n i l e v a r t s s e n i s u B s t e j e t a r o p r o c r o s r a c y n a p m o c s a h c u s l o o p n a v a s a h c u s , s e l c i h e v d e n w o -y n a p m o c n i g n i t u m m o c e e y o l p m E r a c y n a p m o c r o 2 E P O C S … m o r f s n o i s s i m e t c e r i d n I
• Generationofpurchasedelectricity,steam,orheat
E P O C S 3 … m o r f s n o i s s i m e t c e r i d n I • • • • • • , s r a c l a t n e r s a h c u s s e l c i h e v d e n w o -y n a p m o c -n o n n i l e v a r t s s e n i s u B s e n a l p l a i c r e m m o c d n a , s n i a r t , s r a c e e y o l p m e g n i t r o p e r e h t y b d e n w o t o n s e c a n r u f r o s r e l i o b n i l e u f f o n o i t s u b m o C n o i t a z i n a g r o g n i t r o p e r e h t y b d e n w o t o n s e l c i h e v n i g n i t u m m o c e e y o l p m E s r a c e e y o l p m e d n a , s e s u b , n i a r t ,l i a r t h g i l s a h c u s , n o i t a z i n a g r o e c i f f o n a y b d e s u s e c r u o s e r d n a s l a i r e t a m f o e r u t c a f u n a m r o n o i t c u d o r P . c t e , s e g d i r t r a c r e n o t , t n e m p i u q e , r e p a p , e r u t i n r u f s a h c u s , n o i t a z i n a g r o e h t n e h w l l i f d n a l a n i n o i t i s o p m o c e d r o e t s a w e c i f f o f o n o i t a r e n i c n I * n o i t a z i n a g r o g n i t r o p e r e h t y b d e n w o t o n e r a s e i t i l i c a f g n i t n i r p d n a , s e c i v r e s r e i r u o c , g n i p p i h s s a h c u s s e i t i v i t c a d e c r u o s t u O s e c i v r e s O C e d u l c n i r e p a p f o l a s o p s i d d n a e r u t c a f u n a m e h t m o r f t l u s e r t a h t s n o i s s i m e G H G
* 2andmethane(CH4).Amethodologyfor . V I x i d n e p p A n i d e d i v o r p s i s n o i s s i m e e s e h t g n i t a l u c l a c
Emissions from most office-based organizations are indirect. Although you do not own the emissions source, you can still achieve reductions through, for example, energy-efficient lighting, reduced air travel, and reduced use of materials.
14 14 14 14
14 Wo rl d R e s o u rc e s I n s t i t u te
Deciding what to report
Deciding which emissions sources to include in your operational boundary requires careful thought. For example, if you include business travel in your boundary, you must decide if you will include only the business travel undertaken by your staff, or also business travel by consultants, partners, or other non-employee colleagues with whom you work. Reporting on emissions from non-employee travel requires more record keeping by your organization’s staff—the people whose projects generate the trips by those outside parties—and, occasionally, the cooperation of your partners and consultants to help you track the emissions they generated working for or with your organization. Of course, tracking all the travel-related emissions you’re generating as a result of your organization’s business—directly and indirectly—makes your inventory more complete. Sometimes the best choice is a manageable middle ground.
In its inventory, WRI reports on air travel by staff, consultants, and partners if WRI makes the travel arrangements. We do not account for and report on business travel by car and train because it is such a small percentage of our total miles traveled. Nor do we account for and report on business travel if WRI did not make the travel arrangements because we don’t yet have an efficient method of capturing this information. However, we anticipate expanding our inventory to include these categories so our reporting will be more complete.
BOX 5 GUIDING PRINCIPLES
As you develop your inventory, refer to the principles established by the GHG Protocol:
RELEVANCE Define boundaries that
appropriately reflect the GHG emissions of your business and the decision-making needs of inventory users.
COMPLETENESS Account for all emissions
sources and activities within your chosen organizational and operational
boundaries. Justify specific exclusions. CONSISTENCY Allow for meaningful
comparison of emissions performance over time. Clearly state any changes to the basis of reporting to enable continued valid comparison. TR ANSPARENCY Address all relevant
issues in a factual and coherent manner, based on a clear audit trail. Disclose any important assumptions and cite the calculation methodologies used. ACCURACY Strive for precise GHG
calculations and seek to provide reasonable assurance of the integrity of reported GHG information.
Whether to include emissions generated by employees commuting to work is another example of a difficult operational boundary decision. Some employees consider their commuting arrangements to be a matter of personal privacy and fear they’ll be pressured to give up their SUV, ride the bus, or join a carpool. However, organizations that choose to include employee commuting in their inventory will create an additional opportunity for achieving emissions reductions and the employees can reap some benefits too, even beyond awareness of their impact. Businesses that have a large proportion of their CO2 emissions generated by employee commutes may choose to move their offices closer to mass transportation options, or opt to implement a telework or rideshare program (less dramatic but very useful alternatives from an employee
perspective). Some businesses offer incentive programs to encourage employees to use mass transit or carpooling, which benefits employees financially and can be implemented in a nonjudgmental way.
In general, you may find it simpler to draw narrow boundaries. However, a more comprehensive inventory provides greater opportunities for emissions reductions. Let the GHG Protocol
accounting principles guide your decisions on what to include in your inventory. (See Box 5.) In other words, obtain the most accurate, complete, and relevant data possible and be transparent and consistent in your choices.
w w w . s a f e c l i m a t e . n e t 1 51 51 51 51 5
Example:
S&P Enterprises’ operational boundary includes emissions from the following sources:
a natural gas-powered water heater in
the building it owns
electricity use in both of its business locations
business travel via car, train, and air
employee commuting
These emissions are reported as follows:
Scope 1 (direct emissions): emissions
from the natural gas-powered water heater in the building it owns. Emissions from air travel in the company jet.
Scope 2 (indirect emissions from purchased electricity, steam, or heat):
emissions from electricity use in both locations.
Scope 3 (other indirect emissions):
emissions from business travel by employees via train, commercial plane, and non-company-owned cars, and employee commuting.
plan your co
2
inventory
WRI’S CO2 EMISSIONS
Fifty percent of WRI’s emissions in 2001 were from electricity (Scope 2). Air travel (Scope 3) was the next most significant source, followed by employee commuting and paper
production and manufacture (Scope 3). WRI does not produce any Scope 1 emissions.
WRI’s CO2 Equivalent Emissions, 2001
STEP TWO CHECKLIST
✔
✔
✔
✔
✔
Have you…
●
Defined your organizational
boundary—that is, decided
which facilities/entities of your
company or organization you
will include in your inventory?
●
Defined your operational
boundary—that is, chosen
which direct and indirect
emissions sources you will
include in your inventory, from
fuel use, to power purchased
from outside sources to
employee commuting?
●
Checked your choices against
the guiding principles of GHG
accounting and reporting
(Box 5)?
●
Decided how often to compile
and report on your inventory?
Deciding How Often to Report
Depending on your objectives and available resources, we recommend compiling your CO2 inventory at least once a year. WRI gathers its data quarterly to make regular comparisons. A full report is made annually. These reports will soon be available for review on the SafeClimate website (http://www.safeclimate.net).0 200 400 600 800 1000 1200
Scope 1 Scope 2 Scope 3
Me
tric
to
n
s
o
f C
O
2
electricity
paper
air travel commutingg
16 16 16 16
16 Wo rl d R e s o u rc e s I n s t i t u te
WHAT CAN
WE DO?
WHAT CAN
WE
w w w . s a f e c l i m a t e . n e t 17 17 17 17 17
Step 3:
GATHER DATA
Activity Data
This quantifies an activity—say, employee business trips—in units that will help us calculate the emissions generated. Each activity is presented in a specific unit, for example:
therms or cubic meters of natural gas
gallons or liters of heating oil
kilowatt hours of electricity
business air miles or kilometers traveled
business train miles or kilometers traveled Develop a simple, efficient method of capturing the data on a regular basis. One approach is to centralize a system through your Accounting Department. Guidance on where to look for the data you need is provided later in this Guide, along with tips for how to develop a good estimate if the exact data are unavailable.
Now that you have planned your CO2 inventory, this step will help you identify exactly what data you need to develop your inventory, and will help you find it.
IDENTIFY THE DATA YOU NEED
You need two kinds of data to calculate your organization’s CO2 emissions. For each emissions source you identified in Step Two, you need to find the appropriate “activity data” and “emissions factor” to help you apply the following equation:
activity data × emissions factor
=
CO
2emissions
Let’s break down this equation into its basic parts. Despite the technical names, the data you need is actually quite simple to identify.
18 18 18 18
18 Wo r l d Re s o u r c e s I n s t i t u te
TIP!
Designing a good data collection system can reduce errors caused by inaccurate data and/or data input mistakes. Some good data collection practices include: requesting data in familiar units
requesting data from metered or measured sources when possible; they may be more accurate than purchase records
establishing internal control systems to catch errors
undertaking regular checks for technical errors. Technical errors include incomplete identification of emissions sources, use of incorrect methods or assumptions, use of incorrect data, and mistakes in data entry. For more tips on managing the quality of your inventory, see the GHG Protocol.
Emissions Factors
Emissions factors convert activity data to emissions values. Emissions factors are published by various entities such as local, state, or national government agencies and intergovernmental agencies. More information is provided later in this Guide and a list of emissions factor sources is contained in Appendix II. A current list of emissions factors can also be
found in the GHG Protocol’s calculation tools at http://www.ghgprotocol.org.
Emissions factors are source-specific. For example, the emissions factors for electricity produced by coal will be higher than for electricity produced by natural gas. Similarly, emissions factors for car travel vary depending on if the car is powered by gasoline, diesel fuel, or electricity, and on how efficiently the car uses fuel. Select the most relevant emissions factor available for each of the activities you’ve defined.
Emissions factors are frequently updated to reflect new information or technologies. Use the most up-to-date emissions factor available.
GATHER ACTIVITY DATA
This section will help you find activity data for a variety of direct and indirect emissions sources common to offices. Sample information is provided for S&P Enterprises.
TIP!
If your company owns other vehicles, the data are collected using the same data collection methods described in “Scope 3: Business Travel”, however emissions from company-owned vehicles should be reported as Scope 1.Activity Data for Direct Emissions
(Scope 1)
As discussed in Step Two, direct emissions occur from company-owned vehicles or from combustion of fossil fuels such as natural gas, heating oil, coal, fuel oil, diesel, etc. in company-owned equipment. Emissions are a result of the combustion of these fuels. Here’s how you would gather activity data—in this case fuel usage—for combustion of natural gas or heating oil and travel by corporate jet:
Figure out what units you should be using in your calculations. For natural gas, the common units are therms, cubic meters, or cubic feet. For heating oil, the units are gallons or liters. For travel in a company-owned jet, the relevant units are gallons or liters of jet fuel.
Obtain the activity data in the appropriate units from your organization’s monthly fuel-use records, or convert the data in your organization’s records to the appropriate unit. (See Appendix I for a listing of conversion factors.)
Example:
S&P Enterprises does not use heating oil but does have a gas-powered water heater in the building it owns. This year, 4,139.59 therms of natural gas were used by S&P Enterprises and the company to which it leases space at this location. The corporate jet used 450 gallons of jet fuel.
w w w . s a f e c l i m a t e . n e t 19 19 19 19 19
Activity Data for Indirect Emissions from
Purchased Electricity (Scope 2)
When coal, gas, and other fossil fuels are combusted to generate electricity, CO2 and other GHGs are emitted. The emissions take place at the point of combustion (the power plant), not at the location the electricity is used, like your office. However, you share responsibility because you generated the demand and used the power. On the other hand, if you use non-fossil fuel-based energy, such as wind and solar power, you are not responsible for any CO2 emissions, because none are generated.
The activity data you need to calculate the CO2 emissions generated by your office’s electricity use is kilowatt hours (kWh). If your organization owns and occupies the entire building, or if your utilities are separately metered, all the information you need can be obtained from your monthly electric bill. If your organization does not occupy the whole building or if it occupies leased office space, you will need to estimate your electricity use based on information from your property manager:
total area of the building
total area occupied by your organization
total building energy use in kWh
gather data
Using this information and the following formula, you can estimate the approximate kWh of electricity attributable to your organization:
TIP!
Try to obtain activity data on your electricity use from fuel-use records (such as an electric utility bill) because the information will be more accurate. If that is not possible, try to determine the total area of the building that is occupied to improve the accuracy of your estimate. If that information is not available, find out the total area of the building and use that number instead. Your propertymanagement company may be very helpful in providing the data you need. (See Box 6.)
BOX 6 ESTIMATING AND REDUCING ELECTRICITY USE AT WRI
For budgeting purposes, WRI’s property management company keeps a detailed accounting of the building’s monthly electricity use and associated expenses. Fortunately, WRI found that the company is willing to share their spreadsheet of electricity data with us. WRI uses this information to estimate its approximate share of electricity use in the building, using the method described in this section of the Guide. Compared to other building tenants, WRI has a highly energy-efficient office—for example, in addition to using energy-efficient lighting, it also utilizes motion sensors in all office spaces so that lights are used only when a space is occupied— so the standard formula probably over estimates our electricity use. To obtain more accurate information on electricity use, WRI explored
separately metering its office space, but couldn’t due to cost and infrastructure constraints. Since we cannot accurately track our electricity use—and therefore, any emissions reductions we might achieve—WRI is trying to reduce the building’s overall electricity use. We will host a meeting for other building tenants to educate them about actions they could take in their offices to reduce electricity use, and we are encouraging our property management company and the building’s owners to purchase clean, renewable power for the building. This would not only eliminate WRI’s emissions from energy— currently about half of its total emissions—but also greatly reduce the building’s environmental impact.
(area of
organization’s
space ÷ total
building area)
×
total
building
usage of
electricity
=
approximate
kWh used by
your
organization
20 20 20 20
20 Wo r l d Re s o u r c e s I n s t i t u te
Example:
In the building S&P Enterprises owns, activity data is obtained from the organization’s electric bill. The annual electricity usage for this building is 980,326 kWh.
S&P Enterprises occupies 38,018 square feet of leased office space in its second location. The total building area is 252,781 square feet. According to the property manager, the building used 5,753,100 kWh of electricity this year. S&P’s climate champion uses the calculation described to estimate the organization’s approximate share of kWh in this location:
To calculate its total electricity usage this year, combine the annual usage from both locations.
980,326 kWh
+
865,260 kWh
=
1,845,586 kWh
38,018 square feet
÷
252,781 square feet
x
5,753,100 kWh
=
865,260 kWh
(area of organization’s space
÷
total building area)
×
total building usage of electricity
=
approximate kWh used by your organization
w w w . s a f e c l i m a t e . n e t 21 21 21 21 21
gather data
Activity Data for Other Indirect Emissions
(Scope 3)
A variety of emissions fall under this category. We describe methods of collecting activity data for business travel in non-company-owned vehicles (car, plane, and train) and employee commuting.
Business Travel in Non-Company-Owned Vehicles
Car travel
The activity data required for calculating emissions from car travel include:
●Total fuel use in gallons or liters ●Type of fuel (e.g., gasoline or diesel)
●Number of occupants if non-company staff are
in the vehicle. Your goal is to calculate the amount of fuel attributed to your organization’s
employees, so if all occupants are employees of your organization, you won’t need this data. If some are non-company staff, you’ll need to calculate the share of emissions attributable to your office’s staff.
There are two ways to obtain fuel-use data. The most accurate and simple method is to obtain the data from fuel purchase receipts. If you do not have access to fuel purchase receipts, estimate fuel use using the following:
●Total distance traveled
●Average fuel efficiency of the vehicle
●Number of occupants if non-company staff are
in the vehicle
The calculation to estimate fuel used is:
For example, if an employee travels 300 miles and the fuel efficiency of the car is 28 miles per gallon (mpg), the calculation is:
If the same employee has decided to carpool with a colleague from another organization headed to the same destination the calculation is:
If the fuel efficiency of the vehicle is unknown, emissions can be calculated using distance traveled activity data and an emissions factor that assumes a default fuel efficiency value for the size of car. This is a less accurate method.
If an employee uses his/her own car for business travel, distance traveled will usually be indicated on the form submitted for reimbursement of travel expenses. If a rental car is used, information on distance traveled and type of car can often be obtained from the receipt.
TIP!
Business travel falls under the “Scope 1: Direct Emissions” category if the organization owns the transportation device, such as a fleet of company cars, delivery vans, corporate jets, etc.distance
traveled
÷
fuel
efficiency
÷
number of
occupants
=
approximate
fuel use per
occupant
CAUTION!
If two or more employees are in the car, along with at least one non-employee, you will need to multiply the total number of employees in the car by the gallons of fuel used per occupant to calculate the total fuel use attributed to your organization.
300
miles
÷
28
mpg
÷
1
occupant
=
10.7 gallons
of fuel per
occupant
300
miles
÷
28
mpg
÷
2
occupants
=
5.36 gallons
of fuel per
occupant
22 22 22 22
22 Wo r l d Re s o u r c e s I n s t i t u te
Example:
If fuel purchase receipts are unavailable, S&P Enterprises uses distance traveled, fuel efficiency, and vehicle occupancy to estimate fuel use for each car trip. S&P requires employees to enter this information on their travel reimbursement forms.
Six trips have been taken by employees this year. Fuel purchase receipts were not available for any. Five were in gasoline-powered cars and one was in a diesel-powered car. The diesel car was used in a country for which fuel efficiency data are unavailable; therefore, only distance traveled and vehicle occupancy activity data were collected for this trip.
CAUTION
Fuel use for gasoline- and diesel-powered cars must be recorded separately because each fuel has a different emissions factor.
TIP!
Add a line to your organization’s reimbursement forms that requires employees to state the vehicle’s average fuel efficiency and number of occupants in the car, along with distance traveled. This will save your climate champion some accounting work and will help educate your employees about fuel efficiency.S R A C D E R E W O P -E N I L O S A G N I S P I R T p i r T e c n a t s i D s e l i m n i d e l e v a r t ÷ l e u F y c n e i c i f f e ÷ s t n a p u c c o f o # s e e y o l p m e t o n e r a y n a f i ( ) = f o s n o l l a g n i l a t o T t n a p u c c o r e p e n i l o s a g 1 p i r
T 49miles ÷ 17mpg ÷ 1occupant = 2.88 2
p i r
T 110miles ÷ 32mpg ÷ 1occupant = 3.44 3
p i r
T 230miles ÷ 28mpg ÷ 2occupants = 4.10 4
p i r
T 90miles ÷ 15mpg ÷ 1occupant = 6.00 5
p i r
T 176miles ÷ 28mpg ÷ 2occupants = 3.14
: d e s u e n il o s a g f o s n o ll a g l a t o
T 19.56
: n w o n k n u s i y c n e i c i f f e l e u f f i d e l e v a r t e c n a t s i d l a t o
T n/a
S R A C D E R E W O P -L E S E I D N I S P I R T 1 p i r
T 270miles ÷ unknown ÷ 1occupant = unknown
: d e s u l e s e i d f o s n o ll a g l a t o
T unknown
: n w o n k n u s i y c n e i c i f f e l e u f f i d e l e v a r t e c n a t s i d l a t o
T 270
s e l i m 0 7 2 d n a e n i l o s a g f o s n o l l a g 6 5 . 9 1 s i l e v a r t r a c s s e n i s u b r o f a t a d y t i v i t c a ' s e s i r p r e t n E P & S . r a c l e s e i d a n i
TIP!
Make sure your measures of distance and fuel efficiency are based on the same measurement units. For example, if you measure distance in miles, fuel efficiency should also be measured in miles (miles per gallon or liter). If the fuel efficiency of the vehicle is unknown, you may use the EPA’s fuel efficiency ratings for U.S. cars, available at http://www.epa.gov/ autoemissions. If a similar guide is not available for your country, base your emissionscalculations on distance traveled, as described above.
w w w . s a f e c l i m a t e . n e t 23 23 23 23 23
Air Travel
The activity data you need to determine for commercial air travel is distance traveled. The units are either miles or kilometers. This information can sometimes be found on flight itineraries. If you are unable to determine actual distance traveled, refer to a guide or website. (See Appendix III for some sources.)
A large portion of CO2 emissions from air travel occur during takeoff and landing. Therefore, emissions per mile or kilometer traveled for short flights are higher than emissions for long flights. Ideally, you should implement a tracking system to distinguish short, medium, and long flights, since different emissions factors apply for each. Short, medium, and long flights are defined in the spreadsheet template for business travel available for download from SafeClimate (http://www.safeclimate.net). This spreadsheet also automatically identifies short,
medium, and long flights.
WRI’S METHOD OF TRACKING AIR MILES
gather data
In 2001, WRI staff flew approximately 3 million business air miles. Most trips were booked through one travel agency. Through the travel agency’s website, WRI is able to download a spreadsheet that tracks miles flown per month per staff person. This provides WRI with easily accessible information for its CO2 inventory. If your travel agency doesn’t track miles, you can, and quite easily. For example, WRI requires all staff to complete a “Travel Authorization” form before trips for authorization and insurance purposes. WRI adapted its standard form so staff must indicate the number of miles they fly per trip if their travel is not booked through WRI’s travel agency (See Box 7). This information is added to the spreadsheet and helps give WRI a more complete accounting of its air travel.
TIP!
Contact your in-house travel staff or travel agency. They may already be tracking miles traveled per flight. Alternatively, add a question to your organization’s travel authorization or expense forms requesting round trip air miles or kilometers for each trip.TIP!
If a company-owned plane is used for air travel, the activity data collected is fuel use. These emissions are reported as Scope 1, not Scope 3.24 24 24 24
24 Wo r l d Re s o u r c e s I n s t i t u te
Train Travel
Activity data for train travel is distance traveled, measured in either miles or kilometers. This information is collected in the same way as air travel—that is, check with your in-house travel staff or your organization’s travel agent, refer to an on-line distance guide (an example is provided in Appendix III), and/or add a question to your organization’s travel authorization or travel reimbursement forms that requests the information from the employee. As with air travel, make sure the distance includes round trip miles or kilometers traveled.
Example:
From information obtained from travel reimbursement forms, S&P Enterprises calculates that its employees have traveled 1,200 business miles by train this year.
Example:
From information obtained from its travel agent and collected from travel
reimbursement forms, S&P Enterprises calculates that its employees have flown 2,896,345 business air miles on
commercial planes this year. 980,562 miles are short trips, 797,412 miles are medium trips, and 1,118,371 are long trips.
BOX 7 SECTION OF WRI’S TRAVEL AUTHORIZATION FORM
As part of WRI’s commitment to reduce its CO2 emissions, we track all staff air miles. To help us keep a more accurate account, please
complete the following:
Air travel is booked through WRI’s travel agency: YES NO (circle one)
If NO:
What are your round trip air miles?
(for calculation, visit http://www.indo.com/cgi-bin/dist)
CAUTION!
Air travel is measured either in land miles or kilometers, or nautical miles or
kilometers. A land mile is the distance between two points over land. A nautical mile is the average distance on the Earth’s surface represented by one minute of latitude. Since the Earth is not a perfect sphere, a nautical mile does not equal a land mile. Air travel emissions factors are usually in CO2 per passenger land mile or kilometer. If you have calculated distance traveled in nautical miles or kilometers, convert the data to land miles or kilometers. Conversion factors are supplied in Appendix I. Also, when
estimating distance traveled, remember to make sure your numbers include total round trip miles or kilometers.