ISSN: 2349-6495
www.ijaers.com Page | 79
Design of Face Recognition System Using
Viola-Jones and GLD Method
Shrutika Shukla, Prof. Anuj Bhargav, Prof. Prashant Badal
Department of Electronics and Communication, S.R.C.E.M, Banmore, RGPV, University, Bhopal, Madhya Pradesh, India
Abstract— Face recognition systems are the need of time.
We have applied de-noising technique and GLD method in conjunction with Viola-Jones, PCA-ANN and achieved recognition rate beyond expectation.
Keywords— PCA, Viola-Jones, GLD Method, Median Filter.
I. INTRODUCTION
Face recognition consists of feature extraction and classification of the same. The system is trained using a set of human faces and then recognition of the test images submitted as a query. PCA principal component analysis is popularly used to extract the features from human face and neural network. In the previous work back-propagation technique is applied. The performances of the system rely upon the face detection and edge detection method. Viola-Jones is seen to affect the whole of the system. The authors have fused the feature of the facial images by enforcing various feature extraction techniques. The shape of the face is used which results in higher performance rate [1] [2] [3] [4] [5].
Our present work focal point is fusion of the facial features from the trained database and facial image on the anvil under test.
II. PROPOSED WORK
The proposed methodology for the face recognition system. The higher performance and reliability is achieved in two phases.
Phase I: - Training Phase II: - Testing
Training phase consists of teaching about a set of images which works like a template which functions as a bench marks for recognition of the unknown faces. The image on the anvil is recognized by extracting the salient facial features and comparing the same with features already available in the training database. The method is to fuse the two characteristics of facial images into a feature vector. PCA is applied on this vector to reduce the dimension. Proof to this is median filter is used to de-noise the image. The reduced feature is finally used by BPNN algorithm which is later used in recognition process. The same method is applied to unknown image [6].
The train network arrives at result by selecting closet images with unknown one. The bench mark is set to reject the facial images on the basis of the threshold value.
III. PROPOSED ALGORITHM
(i) The project starts with uploading 50 images of 10 persons with five different facial expressions.
(ii) In the pre processing step use median filter for removing the noise from an image.
(iii) Feature extraction is achieved using gray level difference method.
(1)
Where greydiff=[0:1], P is probability function and hom
denotes to homogeneity
(2)
Where con is contrast of an image
(3)
Where eng denotes energy of an image
(4)
Where ent denotes the entropy of an image
(5)
(iv) Detect edge of an image using the canny edge detection method on filtered image.
(v) Detect face from an image using Viola Jones method. (vi) Repeat step 3 to 4 until all train and test images
processing is completed.
(vii) In the feature selection process, apply principal component analysis -A picture of size NXN can be represented as a point in a N2 dimensional space. Given a face picture I(x, y), be two dimensional N by cluster of (8 bit) intensity value. M training pictures are represented by I1, I2,…., IN and every picture Ii is represented to as a vector Fi. Presently the normal face vector is figured utilizing the accompanying comparison.
ISSN: 2349-6495 (6)
Here, is the average face vector. Now the deviation is
estimated from the mean (average) face vector for every image. The equation will be as follows:
(7)
A=[ ]
Here, is the deviation vector for ith image. A is the set of deviation vector of M images. We can compute the covariance using A vector as
(8) Here D is an N2xN2 matrix and A is an N2xM matrix. In
place of matrix AAT, we study the matrix ATA. Remember
A is a N2xM matrix, thus ATA is an MxM matrix. If we
calculate the Eigenvectors of this matrix, it would return M Eigenvectors, each of dimensions Mx1; let’s call these Eigenvectors νi. The best M Eigenvectors can be detected with the help of below equation:
(9) (viii) Each face in the preparation set (short the mean),
∅i can be spoken to as a straight gathering of Eigenvectors μi.
(10) (ix) These weights can be considered as:
ωk=μi T
(11)
(x) Every normalized training image is characterized on this basis as a vector
ωi=ω1,ω2…..ωj
(xi) In classification process, apply artificial neural network to classify the data.
Gray Level Difference Method (GLDM) The method is:
(i) The fundamental method is to achieve a uniform histogram for discrete histograms.
(ii) The gray scale is more efficient in utilization. (iii) Treat the histogram components and group them
on selective basis. This is called Gray Level Grouping.
(iv) On the basis of gray levels group the histograms. (v) Next step is to redistribute these groups uniformly
on gray scale. These image contrast increases and contrast problem is resolved [7].
Mean Squared Error
In statistics, the mean squared error or mean squared deviation of an estimator measures the average of the errors or deviation that is the difference between the estimates.
MSE = (12)
BPNN (Backpropogation Neural Network)
Back propagation is a multi-layer feed forward; supervised learning network based on gradient BPN is the commonly used learning algorithm in training multilayer perceptions (MLP). Network consisting of a set of source nodes that form the input layer, one or more hidden layers of computation nodes, and an output layer of computation nodes. The input signal moves through the network in a forward direction, from left to right and on a layer-by-layer basis [8]-[9]. The advantages of the neural network are possible interactions between predictor variables, and the availability of multiple training algorithms [10].
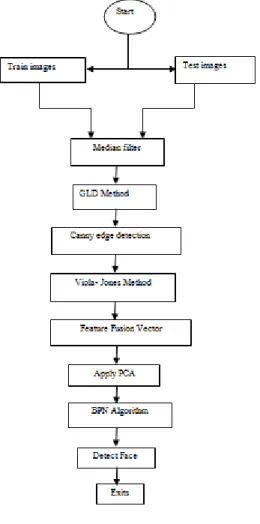
IV. FLOW CHART
Fig. 1: Flow Chart of the Proposed Algorithm
V. SIMULATION AND RESULT
The gray image dataset is uploaded by the user to train the system. User inputs the gray images.
The median filter is applied at step 1 to de-noise the image. The human face consists of various features. These features are extracted using gray level difference method for gray images.
(13) is probability function and hom stands for homogeneity . Contrast = ∑ (P x gray diff 2 + 1) (14)
ISSN: 2349-6495 Energy = ∑ (P) 2 (15)
(a) Original image (b) Feature facial image Fig.2: Feature is shown in figure (b)
Many a times viola – Jones detects as follows:
(a) Original image (b) Featured facial image Fig. 3: Dimension reduction of the facial image
1. Gray Image Dataset for Train image
Fig. 4: Image Dataset (1 to 50)
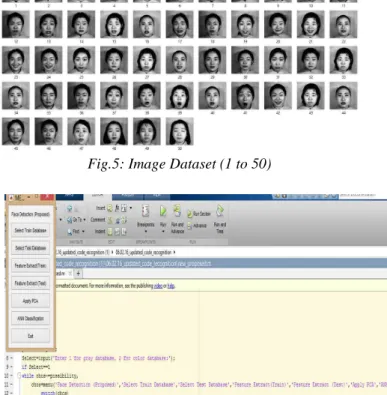
2. Gray Image Dataset for Test image
Fig.5: Image Dataset (1 to 50)
Fig. 6: select the images of Train and Test
In figure 6 graphical user interface with the choice select the train database and test image one by one
.
Fig. 7: Uploading the Trained images
In figure 7 the trained images are uploaded one by one.
Fig. 8: Uploading the Test images
In figure 8 test images are uploaded one by one.
Fig. 9: Feature Fusions for Train and Test images
In figure 9 feature fusion for train and test images is done by the system by user’s interference.
ISSN: 2349-6495
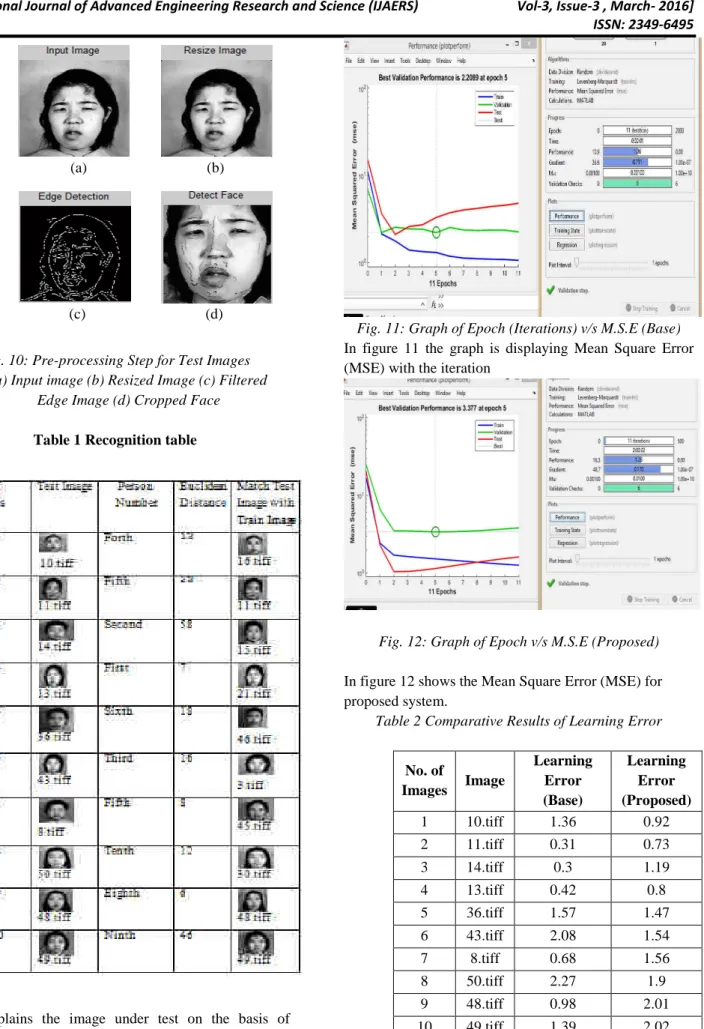
Fig. 10: Pre-processing Step for Test Images (a) Input image (b) Resized Image (c) Filtered
Edge Image (d) Cropped Face
Table 1 Recognition table
Table explains the image under test on the basis of Euclidean distance against the matched image. This chart is genrated automatically by the system.
Fig. 11: Graph of Epoch (Iterations) v/s M.S.E (Base)
In figure 11 the graph is displaying Mean Square Error (MSE) with the iteration
Fig. 12: Graph of Epoch v/s M.S.E (Proposed)
In figure 12 shows the Mean Square Error (MSE) for proposed system.
Table 2 Comparative Results of Learning Error
No. of Images Image Learning Error (Base) Learning Error (Proposed) 1 10.tiff 1.36 0.92 2 11.tiff 0.31 0.73 3 14.tiff 0.3 1.19 4 13.tiff 0.42 0.8 5 36.tiff 1.57 1.47 6 43.tiff 2.08 1.54 7 8.tiff 0.68 1.56 8 50.tiff 2.27 1.9 9 48.tiff 0.98 2.01 10 49.tiff 1.39 2.02 (a) (b) (c) (d)
ISSN: 2349-6495 In table the learning error is shown for both the base work
and proposed work for every test image.
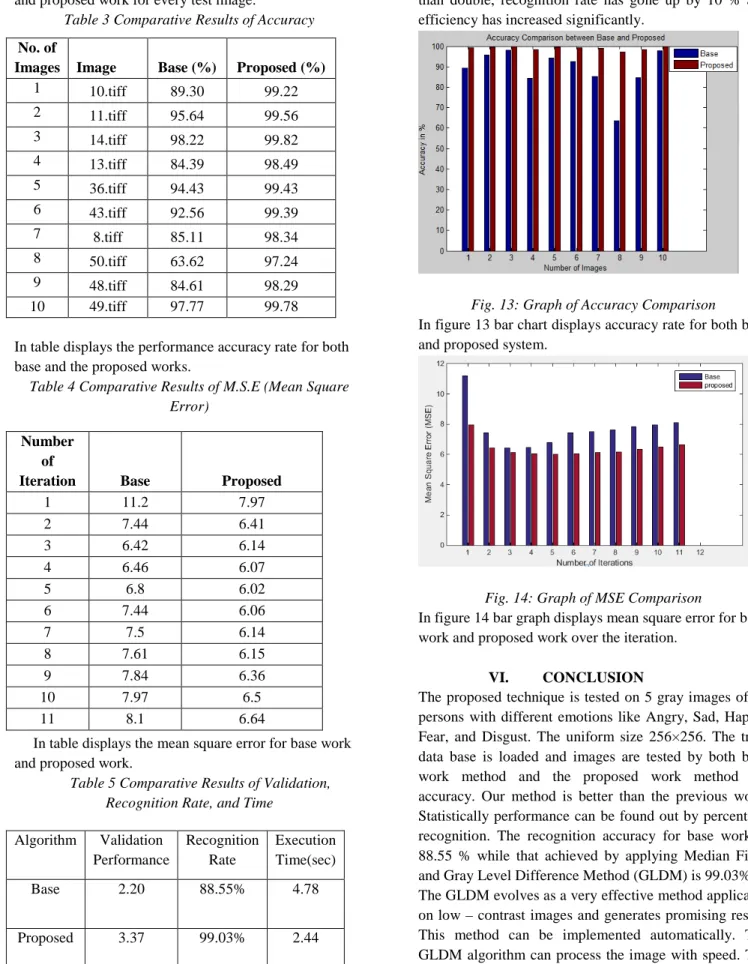
Table 3 Comparative Results of Accuracy
In table displays the performance accuracy rate for both base and the proposed works.
Table 4 Comparative Results of M.S.E (Mean Square Error)
In table displays the mean square error for base work and proposed work.
Table 5 Comparative Results of Validation,
Recognition Rate, and Time
The validation performance of the proposed work is more than double, recognition rate has gone up by 10 % and efficiency has increased significantly.
Fig. 13: Graph of Accuracy Comparison
In figure 13 bar chart displays accuracy rate for both base and proposed system.
Fig. 14: Graph of MSE Comparison
In figure 14 bar graph displays mean square error for base work and proposed work over the iteration.
VI. CONCLUSION
The proposed technique is tested on 5 gray images of 10 persons with different emotions like Angry, Sad, Happy, Fear, and Disgust. The uniform size 256×256. The train data base is loaded and images are tested by both base work method and the proposed work method for accuracy. Our method is better than the previous work. Statistically performance can be found out by percentage recognition. The recognition accuracy for base work is 88.55 % while that achieved by applying Median Filter and Gray Level Difference Method (GLDM) is 99.03%. The GLDM evolves as a very effective method applicable on low – contrast images and generates promising result. This method can be implemented automatically. The GLDM algorithm can process the image with speed. The current work methodology yields an efficient algorithm with higher accuracy recognition results proving that the previous nominal methods are not satisfactory.
No. of
Images Image Base (%) Proposed (%) 1 10.tiff 89.30 99.22 2 11.tiff 95.64 99.56 3 14.tiff 98.22 99.82 4 13.tiff 84.39 98.49 5 36.tiff 94.43 99.43 6 43.tiff 92.56 99.39 7 8.tiff 85.11 98.34 8 50.tiff 63.62 97.24 9 48.tiff 84.61 98.29 10 49.tiff 97.77 99.78 Number of
Iteration Base Proposed
1 11.2 7.97 2 7.44 6.41 3 6.42 6.14 4 6.46 6.07 5 6.8 6.02 6 7.44 6.06 7 7.5 6.14 8 7.61 6.15 9 7.84 6.36 10 7.97 6.5 11 8.1 6.64 Algorithm Validation Performance Recognition Rate Execution Time(sec) Base 2.20 88.55% 4.78 Proposed 3.37 99.03% 2.44
ISSN: 2349-6495 VII. SCOPE FOR FUTURE WORK
Our proposed fusion method works successfully under controlled environment. The frontal upright face image and uniform ambient light is must for the better performance. The present work can be modified in such a way not the constraints are reduced to an extent like detection of the face from dynamic video. The presence of noise should not be able to affect the performance of the system. The other areas of improvement can be combination of neural network and fuzzy logic for soft computing. This may improve the performance. Other feature extraction techniques should be applied to achieve better result. The number of classifiers can be increased.
REFERENCES
[1] Paul Viola and Michael Jones, “Robust Real- time Face Detection,” Second International Workshop on Statistical and Computational Theories of Vision-Modeling, Learning, Computing, and Sampling, Vancouver, Canada, IEEE, July 13, 2001.
[2] Rizoan Toufiq and Md. Rabiul Islam, “Face Recognition system using PCA- ANN Technique with Feature Fusion Method,” International conference on Electrical Engineering and Information & communication Technology (ICEEICT), IEEE, 2014.
[3] Paul Bao, Lei Zhang and Xiaolin Wn, “Canny Edge Detection Enhancement by Scale Multiplication,” IEEE Transactions on Pattern Analysis and Machine Intelligence, vol.27, No.9, pp.1485-1490, September, 2005.
[4] John Canny, “A Computational Approach to Edge Detection,” IEEE Transaction Pattern Analysis and Machine Intelligence, vol. PAMI-8, No.6, November, 1986.
[5] Paul Viola and Michal Jones, “Robust real-time object detection,” International workshop on statistical and computational theories of vision 57, No. 2, pp. 137– 154, 2004.
[6] Joan S.Weszka, Charles R.Dyer and Azriel Rosenfeld, “A Comparative Study of Texture Measures for Terrain Classification,” IEEE Transactions on Systems, MAN, and CYBERNETICS, vol.SMC-6, No. 4, pp. 269-285, April, 1976.
[7] Zhi Yu Chen, Besma R. Abidi, David L.Page and Mongi A. Abidi, “Gray Level Grouping (GLG): An Automatic Method for Optimized Image Contrast Enhancement—Part I: The Basic Method,” IEEE Transaction on Image Processing, vol.15, No. 8, August, 2006.
[8] An Introduction to Back Propagation Neural Networks by Peter Mc Collum (http:www.seattleraobotics.org/encoder/nov98/neural. html).
[9] Kiminori Sato, Shishir Shah, J.K. Aggarwal, “Partial Face Recognition Using Radial Basis Function Networks”, IEEE Journal.
[10] Simon Haykin, “Neural Networks A Comprehensive Foundation”, Second Edition, 2005.