A SECURE ACCESS CONTROL
FRAMEWORK FOR BIG DATA
______________________________
Mohammed Al-Zobbi
A thesis submitted in fulfilment of
the degree of
Doctor of
Philosophy
School of Computing, Engineering and Mathematics
Western Sydney University
Big data is predominantly associated with data retrieval, storage, and analytics. The world is creating a massive data size, which increases exponentially. Since the dawn of time until 2015, human had created 7.9 Zettabyte. This number will be exponentially raised up to 40.9 Zettabyte by 2020. Analytics in big data is maturing and moving towards mass adoption. The emergence of analytics increases the need for innovative tools and methodologies to protect data against privacy violation. Data analytics is prone to privacy violations and data disclosures, which can be partly attributed to the multi-user characteristics of big data environments. Adversaries may link data to external resources, try to access confidential data, or deduce private information from the large number of data pieces that they can obtain. Many data anonymisation methods were proposed to provide some degree of privacy protection by applying data suppression and other distortion techniques. However, currently available methods suffer from poor scalability and performance, low granularity, and lack of framework standardization. Current anonymisation methods are unable to cope with the processing of massive size of data. Some of these methods were especially proposed for the MapReduce framework to operate in big data. However, they still operate in conventional data management approaches. Therefore, there were no remarkable gains in the performance.
To fill this gap, this thesis introduces a sensitivity-based anonymity framework that can operate in a MapReduce environment to benefit from its advantages, as well as from those in Hadoop ecosystems. The framework provides a granular user’s access that can be tuned to different authorization levels. The proposed solution provides a fine-grained alteration based on the user’s authorization level to access a domain for analytics. The framework’s core concept was derived from k-anonymisation techniques, which was proposed by Sweeney in 1998 for data protection. Using well-developed role-based access control approaches, this framework is capable of assigning roles to users and mapping them to relevant data attributes. Moreover, the thesis introduces a simple classification technique that can properly measure the anonymisation extent in any anonymised data. Various experiments showed promising results in applying the
scalability and low distortion.
To examine the effectiveness of the proposed framework in protecting privacy and reducing data loss, a diverse range of experimental studies are carried out. The experimental studies aimed to demonstrate the capability of the framework’s fine granularity by applying granular levels of anonymisation for data analysers. The experiments also meant to compare between the proposed anonymisation framework and the currently available frameworks. Also, all experiments are conducted by using big data operational tools, such as Hadoop and Spark. The comparison has been made in both systems. The results of the experiments showed higher performance output, in general, when anonymisation was conducted in Spark. However, in some limited cases, MapReduce is preferable when the cluster resources are limited, and the network is non-congested.
The experiments unveil several facts regarding big data behaviour. For instance, big data tends to be more equivalent as the data size increases. Moreover, the major concern on big data is security, hence, focusing on security side should be the primary target. The few obfuscated records do not have a major impact on the overall statistical results. Therefore, the trade-off between security and information gain tends to give security a higher priority. It is expected that big data access is requested by a great number of users. This massive demand has recently increased with the social media blossom over the Internet. Personal and contextual information are available online publicly. Thus, personal re-identification has never been easier than now. For this reason, we believe that security should be the major focus of anonymisation algorithms.
The experiments have also shown a high performance of processing and an average information loss for the proposed anonymisation framework. The anonymised data has gained a low classification error by the Bayesian classifier. In comparison to the current anonymisation methods, the proposed framework has a little lower classification error by 0.12%. From the performance perspective, the proposed framework has reached up to 40% faster than the current anonymisation frameworks. For the security side, it was strengthened by increasing the k-anonymity value and assigning granularity for user’s access.
I certify that this thesis does not incorporate without acknowledgement any material previously submitted for a degree or diploma in any university and that to the best of my knowledge and belief it does not contain any material previously published or written by another person, except where due reference is made in the text.
I would like to thank my supervisor Dr. Seyed Shahrestani for his academic guidance, motivation, suggestions, and support throughout my entire thesis and for his administrative and logistic support during my study, including my travelling, and providing me with supportive tools and devices. Without his continuous help and support, it would not have possible for me to complete this thesis. I am deeply indebted to him for all his help and support.
I also thank my co-supervisor Dr. Chun Ruan for her continuous help in completing this thesis. She was deeply involved in the theoretical and practical experiments and theories, which motivated my skills in brainstorming and literal thinking. She has always checked my work and provided me fruitful feedback to improve my work. I appreciate all her help and support.
I would like to express my cordial gratitude to all my colleagues in the Networking, Security, and Technical Support Department for their support throughout my study. I also appreciate the help and support of other colleagues from the School of Computing, Engineering and Mathematics.
Special thanks go to my wife Ling for standing beside me throughout my study and research time. She has been my inspiration and motivation for continuing to improve my knowledge and move my study forward. I also thank my two wonderful children: Salahudeen, and Malek, for always making me smile.
ABSTRACT ... I DECLARATION OF ORIGINAL WORK ... III ACKNOWLEDGEMENTS ... IV CONTENTS ... V LIST OF FIGURES ... VIII LIST OF TABLES ... X LIST OF ABBREVIATIONS ... XII PUBLICATIONS FROM THIS THESIS ... XV
1 INTRODUCTION ... 1
1.1 RESEARCH QUESTIONS ... 5
1.2 THESIS OBJECTIVES ... 6
1.3 THESIS CONTRIBUTIONS ... 6
1.4 THESIS STRUCTURE ... 8
2 BACKGROUND AND CHALLENGES ... 12
2.1 BIG DATA STRUCTURE AND CHALLENGES ... 13
2.1.1 Data Analytics ... 17
2.2 BIG DATA ANALYTICS CHALLENGES ... 20
2.3 SECURITY CHALLENGES IN BIG DATA ANALYTICS ... 22
2.3.1 Protecting Privacy with Differential Privacy ... 24
2.3.1.1 Differential Privacy Frameworks ... 26
2.3.1.2 Possible Attacks in Differential Privacy ... 26
2.3.2 Protecting Privacy with k-anonymity ... 27
2.3.2.1 Impairments in k-anonymity ... 28
2.3.2.1.1 Multiple Queries and Anonymity Variations ... 28
2.3.2.1.2 Finding k Value in k-anonymity ... 29
2.3.2.1.3 Curse of Dimensionality ... 29
2.3.2.1.4 Background Knowledge Attack ... 30
2.3.2.1.5 Homogeneity Attack ... 31
2.4 K-ANONYMITY FRAMEWORKS ... 31
2.4.1 k-anonymity Methods for Traditional Data ... 31
2.4.1.1 Generalisation ... 31 2.4.1.1.1 Incognito ... 34 2.4.1.1.2 ℓ-diversity ... 35 2.4.1.2 Specialisation ... 38 2.4.1.2.1 LKC-privacy ... 40 2.4.1.2.2 (α, k)-anonymisation ... 42
2.4.2 Critique of Traditional Data Anonymisation Methods ... 43
2.4.3 k-anonymity Methods for Big Data ... 44
2.4.3.1 Generalisation ... 44
2.4.3.1.1 Advanced BUG ... 45
2.4.3.2 Specialisation ... 45
3 MULTIDIMENSIONAL SENSITIVITY-BASED ANONYMISATION METHOD... 51
3.1 REQUIREMENTS FOR BIG DATA ANONYMISATION METHOD ... 52
3.1.1 Equivalency Increase ... 52
3.1.2 Information Gain and Security... 57
3.1.3 Parallel Algorithm ... 58
3.1.4 Granular Access ... 59
3.2 ANONYMISATION CONCEPT IN MDSBA ... 60
3.2.1 Quasi-identifiers and Classes ... 61
3.2.2 Probability Concept and Anonymisation Masking ... 61
3.2.2.1 Interval and Taxonomy Tree Masking ... 63
3.2.2.2 Suppression Masking ... 65
3.2.3 Grouping Data Vertically and Horizontally ... 66
3.2.3.1 Grouping Data Vertically ... 67
3.2.3.2 Grouping Data Horizontally ... 69
3.2.4 Mathematical Equations to Calculate the Sensitivity ... 71
3.2.4.1 Sensitivity Level and Time Factor ... 73
3.2.4.2 Anonymisation Operations ... 76
3.2.4.3 Taxonomy Tree Masking Example ... 81
3.2.4.4 Discretisation Masking Example ... 82
3.3 SUMMARY ... 83
4 IMPLEMENTING SENSITIVITY-BASED ANONYMISATION WITH HADOOP ECOSYSTEMS ... 85
4.1 HADOOP IN DATA ANALYTICS ... 86
4.1.1 Hadoop Core ... 88
4.1.2 Hadoop Ecosystems ... 88
4.2 HADOOP SECURITY... 88
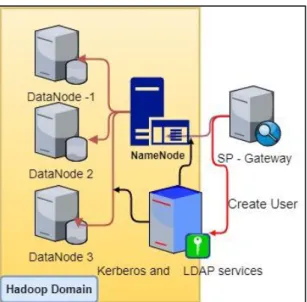
4.2.1 Establishing LDAP Domain in Hadoop ... 89
4.2.2 Applying Kerberos for Hadoop Secure Mode ... 90
4.3 DEPLOYING SENSITIVITY-BASED ANONYMISATION BY USING HADOOP ECOSYSTEMS ... 92
4.3.1 Pig Core Structure ... 92
4.3.2 Anonymisation by Pig Latin Scripts... 96
4.3.2.1 Pig Latin Script Example ... 100
4.3.2.2 User-defined Function ... 103
4.3.2.3 Taxonomy Tree Anonymisation Algorithm ... 104
4.3.2.4 Interval Anonymisation Algorithm ... 112
4.4 COMPARISON OF SENSITIVITY-BASED ANONYMISATION AND OTHER METHODS ... 114
4.4.1 UDF Algorithm for MDTDS... 115
4.4.2 UDF Algorithm for BUG ... 117
4.4.3 Small Data Size Experiments ... 118
4.4.4 Large Data Size Experiments ... 121
4.5 ANONYMISATION CLASSIFICATION ... 126
4.5.1 Using Disruption to Compare MDSBA and Other Anonymisation Methods ... 128
4.6 PERFORMANCE COMPARISON ... 131
4.7 SUMMARY ... 132
5 FRAMEWORK FOR SENSITIVITY-BASED ANONYMISATION ... 134
5.2.2 MDSBA k̄ Percentage and Business Roles ... 142
5.2.3 MDSBA Three Services ... 145
5.2.3.1.1 Keep or Remove Decision ... 150
5.2.3.1.2 Initial Access ... 151
5.2.3.1.3 Subordinate Access ... 152
5.2.3.2.1 Generating Pig Scripts in Initialiser Service ... 156
5.2.3.3.1 SP Log File and Purge Process ... 162
5.3 IMPROVEMENT TO MDSBASECURITY ... 165
5.3.1 Obvious Guess ... 165
5.3.2 Across Groups Unique Identifiers (AGUI) ... 166
5.3.3 Resolving Obvious Guess ... 167
5.3.4 Resolving AGUI ... 168
5.4 EXPERIMENTING WITH DATA DISRUPTION IN MDSBAFRAMEWORK ... 169
5.5 SUMMARY ... 173
6 TOWARDS OPTIMAL K-ANONYMITY ... 175
6.1 PREVIOUS SOLUTIONS TO FIND THE OPTIMAL KVALUE ... 176
6.2 MDSBAGROUPING AND GRANULAR ACCESS ... 177
6.3 POSSIBLE ATTACKS AGAINST MDSBA ... 180
6.4 FINDING THE OPTIMAL KVALUE ... 180
6.4.1 Cumulative Frequency ... 181
6.4.2 Linear Regression ... 184
6.4.2.1 Three Security Levels ... 187
6.5 DETERMINING THE OPTIMAL KPERCENTAGE ... 188
6.6 DYNAMIC G(QID)GROUPS ... 192
6.7 SUMMARY ... 196
7 COMPARISON OF MAPREDUCE AND SPARK ... 198
7.1 SPARK STRUCTURE ... 198
7.2 MAPREDUCE AND SPARK ... 200
7.3 DATA STREAMING VERSUS BATCH ... 204
7.4 IMPLEMENTING MDSBA IN SPARK ... 205
7.4.1 User-defined Functions in MDSBA ... 208
7.4.2 MDSBA Algorithms Differences between Pig and Spark ... 210
7.5 COMPARISON OF HADOOP ECOSYSTEMS AND SPARK IN PROCESSING MDSBA ... 215
7.5.1 Spark Tuning in MDSBA ... 219
7.6 SUMMARY ... 222 8 CONCLUSIONS ... 224 REFERENCES ... 230 APPENDICES ... 238 - APPENDIX 1 ... 238 - APPENDIX 2 ... 238
Figure 2.1—The three layers of big data structure... 15
Figure 2.2—Data map showing patients’ information distribution (Source [43]) ... 20
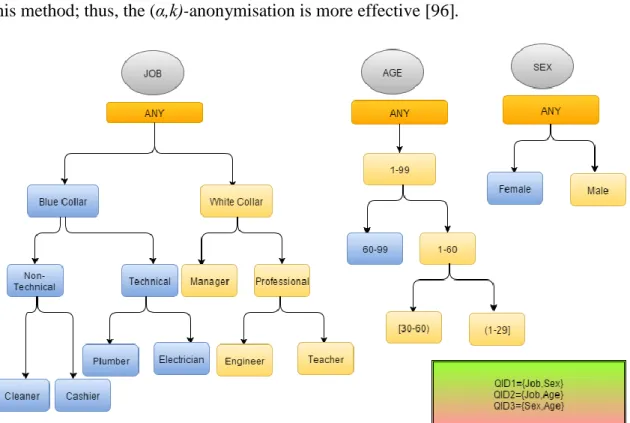
Figure 2.3—Taxonomy trees for job, age and gender ... 42
Figure 3.1—Proportionality of equivalent records with increased record numbers ... 56
Figure 3.2—Effect of increasing number of actual combinations with increased number of records ... 56
Figure 3.3—Taxonomy tree for ‘education’ in Adult data ... 63
Figure 3.4—Access control structure in MDSBA... 69
Figure 3.5—Plotted graph to derive Equation 3.6 for ageing factor ... 75
Figure 3.6—MDSBA algorithm... 80
Figure 4.1—Comparison of Hadoop Versions 1 and 2 ... 87
Figure 4.2—Kerberos and LDAP server in MDSBA ... 90
Figure 4.3—Kerberos general steps to secure services by administrators ... 92
Figure 4.4—Illustration of Pig structure ... 95
Figure 4.5—Pig structure at the top of the processing engine ... 96
Figure 4.6—Four processing stages to anonymise four Q-ID group ... 98
Figure 4.7—Anonymisation process of three and two Q-ID groups ... 99
Figure 4.8—Pig Latin script example for the first two stages ... 101
Figure 4.9—Taxonomy tree structure for XML files ... 105
Figure 4.10—Example of car taxonomy tree ... 106
Figure 4.11—XML file example for the taxonomy tree in Figure 4.10... 107
Figure 4.12—Taxonomy masking algorithm ... 110
Figure 4.13—Algorithm illustrating the numerical value anonymisation ... 114
Figure 4.14—BUG driver algorithm implemented in UDF ... 118
Figure 4.15—Classification error for three sizes of Adult datasets ... 119
Figure 4.16—Classification error for three sizes of Seer datasets ... 120
Figure 4.17—Processing time comparison for the three anonymisation methods ... 121
Figure 4.18—Taxonomy tree for purchase date attribute in Kasandr dataset ... 123
Figure 4.19—AE results in Adult dataset for three different methods ... 125
Figure 4.20—AE results in Seer dataset for three different methods ... 125
Figure 4.21—AE results in heart disease dataset for three different methods ... 126
Figure 4.22—AE results in Kasandr dataset for three different methods ... 126
Figure 4.23—Disruption comparison for 𝑘̄=4 and the four datasets ... 129
Figure 4.24—Disruption comparison for 𝑘̄ = 50 and the four datasets ... 130
Figure 4.25—Relationship between Ɗ and 𝑘̄ variation in MDSBA... 130
Figure 4.26—Processing time comparison for the three anonymisation methods ... 131
Figure 4.27—Processing time comparison of various datasets and sizes ... 132
Figure 5.1—SAML communication steps between SP and FS ... 137
Figure 5.2—XML response in SAML assertion sections, and attributes section modification ... 138
Figure 5.3—Live data options for data owner interface ... 141
Figure 5.4—Archived data options for data owner interface ... 141
Figure 5.5—Steps to configure initial values for each dataset ... 142
Figure 5.6—Organisation–roles–groups mapping ... 145
Figure 5.7—MDSBA three main services: core, initialiser and anonymiser ... 146
Figure 5.8—Sequence diagram for MDSBA framework ... 147
Figure 5.12—Definder.xml file demonstration ... 153
Figure 5.13—Sample of data_id.xml file ... 154
Figure 5.14—Pig script file created by the initialiser service ... 157
Figure 5.15—PHP sample for anonymiser service ... 158
Figure 5.16—Algorithm for anonymiser service ... 160
Figure 5.17—Initialiser and anonymiser algorithms... 161
Figure 5.18—Sample of purge.xml configuration file ... 164
Figure 5.19—Stage 0 of anonymisation to protect from obvious guess ... 168
Figure 5.20—Organisation A and delegated roles ... 170
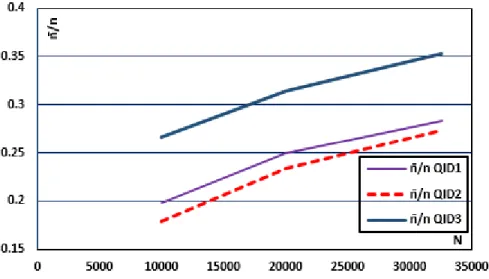
Figure 5.21—Trade-off between D and AGUI no. in [× 103] ... 172
Figure 5.22—Single Q-ID group access and obvious guess... 173
Figure 6.1—CF for Seer G(QID)1 disruption ... 184
Figure 6.2—Regression calculation for Seer G(QID)1 disruption... 187
Figure 6.3—Groups mapping to business roles ... 190
Figure 6.4—AGUI number for both roles in Seer data ... 191
Figure 6.5—AGUI number for both roles in Adult data ... 191
Figure 6.6—Part of ERD showing the relationship between patterns and G groups ... 195
Figure 6.7—Algorithm for determining the best patterns ... 196
Figure 7.1—Spark structure and job distribution ... 199
Figure 7.2—Comparison of Hadoop and Spark in dealing with memory and disks ... 202
Figure 7.3—Comparison of the anonymisation algorithms of MDSBA and TDS... 208
Figure 7.4—Anonymisation algorithms in Pig and Spark... 212
Figure 7.5—Comparison of process time between Pig and Scala scripts with three workers ... 217
Figure 7.6—Comparison of process time between Pig and Scala scripts with four workers... 218
Figure 7.7—A number of 319 Pig script tasks, including repeated tasks ... 219
Figure 7.8—Process time between filter/group and group only ... 220
Table 2.1—Security attack using side information ... 24
Table 2.2—Multiple anonymisation example ... 28
Table 2.3A—Non-anonymised data sample ... 30
Table 2.3B—Anonymised data sample ... 30
Table 2.4—Obvious guess and homogeneity attack example ... 31
Table 2.5—Generalised tables GT ... 32
Table 2.6—Comparison between BUG and Incognito in number of searched nodes ... 35
Table 2.7A—Original inpatient data ... 36
Table 2.7B—Anonymised inpatient data ... 36
Table 2.8—Diverse impatient data ... 37
Table 2.9—Compressed patient table ... 39
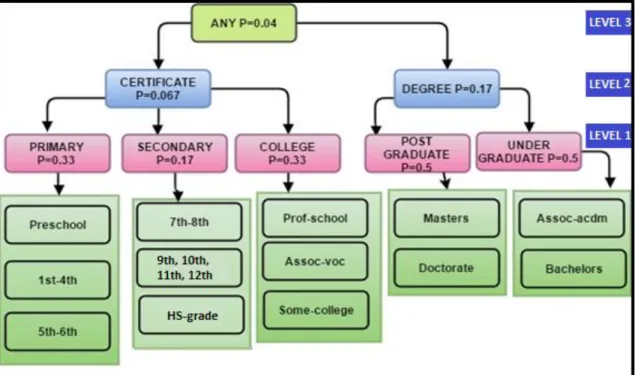
Table 2.10—The specialisation with education ... 40
Table 2.11—LKC-privacy model (original data) ... 41
Table 2.12—Generalising the previous data by job and age ... 41
Table 3.1—Four Q-ID groups chosen randomly from Adult dataset ... 55
Table 3.2—‘Education’ masking in Adult data ... 64
Table 3.3—Three Q-ID attributes example ... 75
Table 3.4—Three Q-ID attribute examples ... 77
Table 3.5—Anonymisation for SSG1 ... 78
Table 3.6—Anonymisation for SSG1 ... 78
Table 3.7—Masking pattern for some data types ... 81
Table 4.1—Seer cancer data Q-IDs and probability ... 101
Table 4.2—Seer cancer data class (four sensitive values) ... 101
Table 4.3—The required programs for each Q-ID group ... 104
Table 4.4—Sample of Seer data ... 111
Table 4.5—Original Adult data sample ... 116
Table 4.6A—Adult data after generalising EDU ... 116
Table 4.6B—Adult data after specialising EDU ... 117
Table 4.7—Heart disease Q-ID attributes, probabilities and class values ... 122
Table 4.8—Kasandr Q-ID attributes, probabilities and class values ... 122
Table 4.9—Dataset of 4.6 GB split for both methods ... 123
Table 5.2—List of files used by the initialiser service ... 155
Table 5.3—Log file for the purge process ... 162
Table 5.4—Obvious guess example ... 166
Table 5.5—Part of Seer data with two Q-ID groups ... 167
Table 6.1—Seer dataset with three G(QID) groups ... 183
Table 6.2—Seer data/G(QID)1 results after line regression calculation ... 186
Table 6.3—Seer data/G(QID)2 results after line regression calculation ... 188
Table 6.4—Security level options setup by data owners to decide the optimal k value ... 188
Table 6.5—Adult dataset with three G(QID) groups ... 189
Table 6.6—Pattern 1 of census data presented by G(QID) groups ... 193
Table 6.7—Pattern 2 of census data ... 193
Table 6.8—Matrix for choosing the best pattern ... 194
Table 7.1—Data example for rounding down to the nearest five ... 209
Table 7.2—Interval range rounding down to the nearest five ... 210
Table 7.3—Grouped and anonymised table ... 213
Table 7.4—The new state after ungrouping records ... 213
𝑘̄𝑝𝑒𝑟𝑐 k percentage value
𝑘̄ Ownership Level
AE Anonymity Error
AGUI Across Group Unique Identifiers
AS Authentication Service
BE Baseline Error
BUG Bottom-up Generalisation
CF Cumulative Frequency
CPU Central Processing Unit
Ɗ Disruption
DAG Directed Acyclic Graph
DGH Domain Generalisation Hierarchy ERD Entity Relationship Diagram
FS Federation Service
G(QID) aggregated Q-IDs, which contains one class and two to four Q-IDs HDFS Hadoop Distributed File System
HR Human Resources
I/O Input/output
ID Identification
IGPL Information Gain per Privacy Loss
IT Information Technology
JAR Java Archive
JBOD Just Bunch of Drives JVM Java Virtual Machine
KDC Key Distribution Centre sever
LDAP Lightweight Directory Access Protocol
MDSBA Multidimensional Sensitivity-based Anonymisation MDTDS Multidimensional Top-down Specialisation
NG Non-equivalent group
NIS Network Inform Service
NoSQL Note only SQL
Ø Obsolescence Value
OLAP Online Analytical Processing
OLTP Online Transaction Processing scaling P(QIDi) probability of each Q-ID
Q-ID Quasi Identifier
RAID Redundant Array of Independent Disks
RAM Random-access Memory
RDD Resilient Distributed Datasets REST Representation State Transfer
SAML Security Assertion Markup Language
SAS Serial Attached SCSI
SATA Serial Advanced Technology Attachment
SCSI Small Computer System Interface
SG Fully-equivalent Group
SOAP Simple Object Access Protocol
SP Service Provider
SQL Structured Query Language
SSG Semi-Equivalent Group
SSH Secure Shell
SSH2 Secure Shell Version 2
SSO Single Sign-On
TDS Top-down Specialisation TGS Ticket Granting Service UDF User-Defined Function
XML Extensible Markup Language y Regression Line for y = 𝑎 + 𝛽𝑥
YARN Yet Another Resource Negotiator ρ Aging Participation Percentage
τ Aging factor
ϒ number of created groups
ψ Sensitivity Level
[1] M. Al-Zobbi, S. Shahrestani, and C. Ruan, "Sensitivity-based anonymisation of big data," in Local Computer Networks Workshops (LCN Workshops), 2016 IEEE 41st Conference on, 2016, pp. 58-64: IEEE.
[2] M. Al-Zobbi, S. Shahrestani, and C. Ruan, "Implementing A Framework for Big Data Anonymity and Analytics Access Control," in Trustcom/BigDataSE/ICESS, 2017 IEEE, 2017, pp. 873-880: IEEE.
[3] M. Al-Zobbi, S. Shahrestani, and C. Ruan, "Improving MapReduce privacy by
implementing multi-dimensional sensitivity-based anonymisation," Journal of Big Data,
journal article vol. 4, no. 1, p. 45, December 08 2017.
[4] M. Al-Zobbi, S. Shahrestani, and C. Ruan, "Multi-dimensional sensitivity-based anonymisation method for big data," in Networks of the future: architectures, technologies, and implementations, M. Elkhodr, S. Shahrestani, and Q. Hassan, Eds. Boca Raton: Francis, 2017.
[5] M. Al-Zobbi, S. Shahrestani, and C. Ruan, "Towards optimal sensitivity-based anonymisation for big data," in Telecommunication Networks and Applications Conference (ITNAC), 2017 27th International, 2017, pp. 1-6: IEEE.
[6] M Al-Zobbi S. Shahrestani, C Ruan, "Processing Sensitivity-Based Anonymizationframeowkr in Spark," in Journal of Big Data,2018
[7] M. Al-Zobbi S. Shahrestani, C. Ruan, "ACHIEVING OPTIMAL K-ANONYMITY PARAMETERS FOR BIG DATA," in Internationl Journal of Information,
Big Data is a new technology trend as a result of the massive data growth in the recent past. Digital data can be obtained from many quantitative and qualitative data sources, including smartphones, radio frequency identification sensors, Internet of Things, driver trackers, smart watches, smart glasses, embeddable, video recordings, audio recordings, radar, navigation sequences, cheap storages, cloud services, social websites, tablets, and others. The International Data Corporation estimates that, on a worldwide basis, the total amount of digital data created and replicated each year has grown exponentially from 1 Zettabyte (1,000,000 Petabyte) in 2010 to 15 Zettabyte in 2017 [143].
There is no clear definition of big data. However, the term big data refers to the massive amount of digital information [67]. Two major specifications distinguish big data from the conventional data: Online Transaction Processing scaling (OLTP), and Online Analytical Processing (OLAP). OLTP presents the storing and retrieving, while OLAP presents data analytics [8]. These two features can be gained by using a distributed environment, where many computers process the data in a parallel time [31]. Big data needs to be stored, retrieved and analysed. Thus, data analytics is one part of big data processes. Data is beneficial when it is analysed, so users gain more information, and can understand the bigger picture of the business activities. Hence, the term data analytics is involved with the big data [92].
Data analysis has a multiple spanning disciplines [35]. Data analytics technique is becoming an essential part of the Information Technology business and research. Several scientific domains oblige analytics in operations. Some of these domains are; medical, financial, industrial, transportation, government intelligence, and more. Consider data analytics as a prominent tool to monetize business data. Medical organisations request medical data of patients, hospitals, tools, and equipment to find the best method of improving their business and developing medicine and tools. Banks rely on data analytics to develop their customer relationship, mortgage management, risk assessments, and fraud inspection [17]. The commercial side is not the only part of data analytics. In 2009, the American centres for Disease Control and Prevention (CDC) has
failed to track the H1N1 disease around the United States in a real-time. The disease was spreading everywhere and threatening the public health. Collected information from patients is lagging by two to three weeks. Google analysed over 50 million common search terms for Americans, and accurately tracked the areas infected by the flu virus by what people searched for on the Internet [91]. Data analysis manifests a new exploitation for the recent technology, which supports a real-time collaboration between customers and business. Numerous companies have established their businesses based on the collected data from the collaboration between customers and companies. Facebook and Uber are examples of the cases that customers interactively deal with the applications. The popularity of the smartphones and other handsets has induced such interactivity [145]. New technologies such as the Internet of Things, smart cities, machine learning, and others, rely on data analytics as a major data provider.
Data analytics aims to provide statistical information without providing any privacy protection. Privacy attacks in data analytics is a major concern, which urged a need for protection policies and algorithms. Hence, scientists proposed several privacy models to reduce the probable attacks against data, by presenting two categories of privacy models: interactive and non-interactive categories. Interactive models tend to hide the actual data and provide statistical results instead. Data owners provide interactive interfaces, where queries are submitted to obtain statistical summary results. Protecting against queries is accomplished by sanitization approaches. This approach is conducted by adding noise to the input parameters or the output results. A small numerical value that can be calculated by Laplace or Gaussian equations is added to the output results, known as a perturbation. The perturbation is applied by using differential privacy models [29; 35; 98; 121]. In the non-interactive models, the data owner publishes an anonymised copy of the collected data, termed as anonymisation or de-identification. Also, data owner hides or removes some personal identifier attributes such as names, birthdates, and social security numbers [41; 87; 140]. However, other auxiliary details cannot be removed for statistical and scientific purposes. Information such as age, gender, postcode, marital status, and education are essential information in data analytics.
Homomorphic encryption is another type of the interactive models. Data is encrypted and stored, and users cannot view data without a dycrption key. Researchers are still developing three types of Homographic encryption: partially Homomorphic (PHE), somewhat Homomorphic (SWHE), and fully Homomorphic encryption (FHE) schemes. In PHE, either multiplication or addition calculation can be operated at once, but not both. SWHE can support a limited number of addition and multiplication operations. FHE sustains both addition and multiplication, so it can accomplish some statistical functions [107].
Interactive models are highly secure for certain tasks and firms. However, users may find it difficult to create relevant queries, while they read from a black box. Users are unable to access the actual data; they can only view attributes description. This does not provide a wide range of flexibility on working with data groups, domains, and sub-domains. On the other hand, non-interactive models provide a complete anonymised version of data, where users have the opportunity to view data and rectify the appropriate query for obtaining the statistical results. Moreover, non-interactive models consider the background knowledge by attackers, when performing attribute linkage protection. This intuition is essential since the recent few years. Cloud services and social media play a powerful role in providing adversaries with precise background knowledge.
In non-interactive models, the auxiliary information may provide personal identification to a certain extent. These identifiers may not gain 100% of re-identification, but a risk of predicting some data remains high. For example, knowing the patient age, gender, and postcode, may lead to uniquely identifying that patient with 87% [141]. These identifiers are known as Quasi Identifiers (Q-ID). A popular anonymity model, k-anonymity, was formally studied by Sweeney [141]. The model suggests an anonymisation for Q-ID, which tends to find a group of attributes that can identify some tuples in the database. The model hides the sensitive values by ensuring the equivalency between records with at least k times[140]. Two different techniques were developed to gain the k-anonymity: top-down specialisation (TDS) and bottom-up generalisation (BUG). The first technique is based on walking through the taxonomy tree from
the top towards the bottom, known as the Top-Down Specialisation. The second technique constitutes of techniques that generalise data from the bottom of the taxonomy tree towards its top. These two techniques aim to find equivalency in each data domain. Examples of BUG are proposed in ℓ-diversity [85], and Incognito [76]. Example of TDS are proposed in LKC-Model [96], (α, k)-Anonymity [150], and the multi-dimensional TDS (MDTDS) [124] [40].
The previously mentioned anonymisation models were proposed for average size data. Big data manifests different scalable approaches, which makes anonymisation imposes alternative techniques. There was a need for more relevant models in order to cope with large sizes of data. Proposed models should consider big data processing tools of parallel distributed computing, such as MapReduce. However, recently proposed models, such as parallel BUG [64], hybrid BUG / TDS [158], and Two-Phase TDS [153], are quite similar to the extent mentioned models for average size data. In fact, the modifications, over the previous versions, have degraded the information usefulness. Moreover, there is no rigorous access control framework for big data analytics. The increased demand for big data analytics has promoted the publicity-driven business. As a result, a larger number of users from different firms are engaged to benefit from data analytics. This recalls a need for a large-scale framework that can control users in fine-grained access. The framework should be able to manage the user’s authorization and authentication. As mentioned earlier, anonymisation provides a complete version of anonymised data, which makes re-identification more probable. Currently, we are unable to assign the access permission for certain attributes. The needed framework should control permit/deny privileges on the data attribute level. This permits the access of the needed data only. Also, the framework should provide granular levels of anonymisation as per user’s access privileges.
To fill the previously mentioned gaps, this research proposes a novel fine-grained access control framework. The framework follows the BUG anonymisation model, with a multi-dimensional sensitivity-based anonymisation (MDSBA). The framework provides a scalable anonymisation approach, with a parallel distributed computation computability technique.
1.1
Research Questions
As discussed in the introduction, big data suffers from a lack of a robust framework that can manage access control for analytics. Moving big data to the cloud network emerged multi-tenant’s data storage and multi-access of user’s levels. Security concept has been shifted toward a larger protection scale, where an unknown number of users, organisations, and applications may access big data, and from anywhere and at any time. Concurrently, currently provided anonymity solutions cannot be durable for such massive growing computational costs, and security threats. For these reasons, we may granularly lose control over the empowerment of data analytics with the data and users’ growth. Resolving these concerns may actualise a comprehensive framework that can control access privileges in a fine-grained paradigm. The framework should provide an access control model for data analysers, which depicts the role-based access control model. The framework’s operations should be efficient to provide high performance and a large scalability.
The following question is raised and derived from the Big Data concerns:
How can a framework of Access Control Model enforce the organisational business roles over Big Data analytics in a high scalability and performance concerns?
We think such a framework should consider the following aspects: a. Should resolve the privacy violation of data analytics in Big Data. b. Should enhance the efficiency of OLTP.
c. Can resolve the big data granular access for analytics.
d. Can enforce the external organisational policies by delegating them access and roles permissions.
e. Suitable for multi-tenant and multi-domain environments.
f. Establishes a fine-grained access control, by implementing data anonymity approach.
1.2
Thesis Objectives
The core objective of this thesis is to propose a framework of Access Control Model, which provides secure analytics for big data. The framework should provide fine-grained access control by applying a granular data anonymisation. The anonymisation is provided by implementing a k-anonymity base approach, which protects the personal data re-identification from analysers. This is essential in a multi-domain environment, where users of multi-access levels need to access big data for analytics. The framework provides security by ensuring high levels of anonymity for users with lower levels of privileges and vice versa.
The framework leverages granular anonymity and provides effective access permissions for big data. The framework is a role-based anonymisation control, which delegates business roles to organisations and users. Business roles determine the permitted data attributes by controlling the amount of gained information using anonymisation technique.
1.3
Thesis Contributions
In this thesis, a novel multi-dimensional sensitivity-based anonymisation (MDSBA) framework is developed. The framework provides anonymisation services for big data. The anonymisation is manifested by its granular obfuscation and high performance. MDSBA operates over the cloud network. The cloud is structured as a composition of: datasets, a federation service (FS), and a service provider (SP). SP accommodates multi-tenant data repository belonging to multiple owners. Data owners are given the full delegation to control and manage access permissions to their own data. Moreover, organisations who wish to participate in data analytics, are partially delegated to assign security privileges to their own users. Data owners provide secure access on the FS side for any user who wishes to participate in data analytics. Following this structure, MDSBA framework was distributed between FS and SP. The framework is divided into three main services; core, initialiser, and anonymiser. The core service operates on the FS side, which stores the details of organisations, users, big data information, business roles, organisations security levels, anonymisation parameters, and Q-ID groups. The initialiser is located on the SP gateway side. Data owners upload big data parameters in
an XML format. The initialiser communicates with the core service through Security Assertion Markup Language (SAML) [78]. The aim of the initialiser is to map between FS and SP access privileges and parameters. Finally, the anonymiser operates in the MapReduce domain, where NameNodes and DataNodes servers apply the granular anonymisation, by choosing one of the three masking methods: taxonomy-tree, interval, or suppression. The granular anonymisation is conducted by applying a sensitivity equation that calculates the specified anonymisation level assigned to the user.
The anonymisation granularity approach relies on two main factors: the dynamic value of k (in k-anonymity), and the vertical split of data. MDSBA calculates the user’s appropriate k value based on the data owner’s relationship and trust. For instance, business co-owners have closer relationships than business partners or even public users. A closer relationship is given a lower k anonymity value. The lower k value reduces the applied anonymisation level, which causes higher information gained from data analytics. The anonymisation implements masking operations, by applying data probability based on taxonomy-tree, interval or suppression. Data attributes consist of different data types and each of which is anonymised by one or more of the masking operations. Hence, data with a taxonomy tree anonymisation nature can be generalised by moving from the root of the taxonomy tree toward the bottom. Numerical data anonymisation can be easily masked by applying an interval. The probability value is derived from the number of times that the attribute value may appear. Eventually, the value of k participates in computing the probability value that each masking process should apply. The granular anonymisation is controlled by: the taxonomy tree generalisation level, the interval range, and the number of suppressed characters. More anonymised data imposes a lower taxonomy level and a larger interval range.
The framework adopts Hadoop ecosystems, Pig, Hive, and Spark, to operate anonymisation in highly scalable operations. MDSBA is constructed to fit Hadoop ecosystems’ operations. This is essential to permit the execution of a massive data, which reduces the number of data splits. Larger data size, as in big data, causes a computational data overflow in the small memory size. However, MapReduce aggregates several hosts’ memories, so memory size is extended to accommodate a
larger data block size. Splitting data into small blocks of data size may degrade information gained. Thereby, MapReduce memory extension reduces such a data degradation. Ultimately, MapReduce consists of its own Hadoop distributed file system (HDFS). The file system is designed to read a large size of data blocks, around 128 MB / block. This structure revokes the need for splitting data into the small size of data blocks.
Moreover, this research contributes to the following aspects:
• The development of ownership level and sensitivity level equations. The ownership level is affected by two factors: ownership factor and time factor. The time factor is an optional value, which can be ignored by the data owner.
• The integration of an equation that can calculate the amount of anonymised data on any anonymised dataset, by using the disruption value (D). The D value calculates the masking value that was applied to each Q-ID attribute. Each anonymised data block is calculated, while the total value of anonymised blocks equals D.
• The development of a technique that can find the optimal solution of k-anonymity value. The solution provides data owners with a few simple steps to calculate the most optimal k value.
• The comparison between MDSBA framework and other BUG and TDS models. The comparison includes performance, and level of information loss. Also, a comparison between Hadoop ecosystem tools is conducted.
1.4
Thesis Structure
The remainder of this thesis is organised as follows. Chapter 2 introduces the background and challenges of this thesis. The chapter manifests the big data general definition and the difference between traditional data and big data. This shows the predominant difference is in data analytics. The chapter exhibits the big data analytics challenges, by comparing data streaming and data batching processes. Moreover, big data analytics is prone to security threats and re-identification of a person. For this reason, the chapter explains amply several methods for preventing re-identification. All
proposed security protection methods can be categorized under one of the three privacy concepts: differential privacy, Homomorphic encryption, and k-anonymity. Several methods will be introduced as examples of differential privacy, and k-anonymity. After introducing security protection method for traditional data, similar sections will be introduced for security protection methods for big data. The sections show why some of the anonymisation methods in use for traditional data, may not be appropriate for big data.
Chapter 3 explores the multi-dimensional sensitivity-based anonymisation method
(MDSBA) and then delves into the MDSBA details. The chapter starts by proposing the requirements for big data anonymisation methods, including equivalency increase, focusing on security more than information gain, anonymisation algorithms should operate in a parallel environment and granular access. The rest of the chapter explores the MDSBA and the probability concept, which is the core part of the MDSBA method. Next sections describe data aggregation concept vertically and horizontally. Both probability and aggregation are the two main components of MDSBA structure. The last section before the summary describes the mathematical equations that are necessary to calculate the sensitivity level as per user’s access. This also includes the time factor and its impact on sensitivity value, and the masking operations in taxonomy tree and intervals. Moreover, the anonymisation algorithms will be described in detail.
Chapter 4 illustrates the state of the art of MDSBA framework. The first sections
illustrate the MapReduce and Hadoop ecosystems. The next section presents Hadoop security and the best protection methods for Hadoop network domain. After introducing Hadoop ecosystems and security, next sections apply MDSBA algorithms by using Pig Latin scripts. The scripts execute the anonymisation by applying several masking methods on taxonomy trees and discretization. The fourth section compares between MDBSA and Multi-Dimensional Top-Down Specialisation (MDTDS). The comparison includes some experiments that measure the prediction level through the classification error. The experiments prove that MDSBA is efficient in performance and has a very low prediction error in the large data size. The experiments will be conducted on several datasets in both small and large data sizes. The last few sections focus on creating a new
classification benchmark for measuring the performance of anonymisation methods. The sections introduce mathematical equations by implementing disruption concept to measure how much is the anonymisation impact on data.
Chapter 5 explores the complete framework of MDSBA. The chapter starts by
describing the communication method between the Federation Service (FS) and Service Provider (SP). The communication method is known by Security Assertion Markup Language (SAML). The second section proposes two types of datasets, archive and live data. Next sections present the details of access control and business roles. The sections describe the three services of MDSBA core. These services are distributed in FS and SP sides. The three services include: core, initialiser, and anonymiser. The sections conclude the method of generating the Pig Latin script. The second part of the chapter discusses two problematic concerns in MDSBA; Obvious Guess and Across Group Unique Identifiers (AGUI). The chapter part provides solutions for these two concerns. The solutions for Obvious Guess will be established by creating a zero-filtration stage before anonymisation, while resolving AGUI is established by increasing the value of k. The last section before the summary explains some experiments that measure the impact of the disruption values on AGUI.
Chapter 6 discusses special topics regarding k-anonymity parameters. The chapter
suggests a greedy-based heuristic approach toward an optimal k anonymisation value. This is a guide for data owners on assigning k-anonymity parameters. The suggested proposal relates to the role-based anonymisation control framework. The framework provides fine-grained access control by dividing Quasi-Identifier (Q-ID) attributes into vertical groups, with two to four attributes for each cluster. The chapter adopts two mathematical concepts to assign k value, which are cumulative frequency and linear regression. The linear regression requires more sophisticated calculations, so it can produce more rigorous results. The cumulative frequency is a special case of linear regression when the high accuracy is not essential. The section introduces k percentage parameter to manage and control the role-based anonymisation control. The last sections shed light on the dynamic groups of attributes.
Chapter 7 engages another recent parallel distributed framework, known by Spark. The chapter compares MapReduce and Spark in processing a sensitivity-based anonymisation framework. The sections are divided in a sequence of Spark structure, a general comparison between Spark and MapReduce, implementing MDSBA in Spark, a comparison between TDS and MDSBA, and finally a comparison between Spark in MapReduce in operating MDSBA. The section on implementing MDSBA in Spark describes the User-Defined Function (UDF) in Pig ecosystem of MapReduce, and in Spark. The section “Implementing MDSBA in Spark” merely compares between UDF in top-down specialisation algorithm and UDF in MDSBA algorithm. The comparison shows a TDS intensive dependency on UDF through (IF statements) and iteration, while MDSBA implements UDF in much less dependency.
Chapter 8 provides the conclusions and future work of this thesis. The chapter mainly
discusses the way the research is developed and highlights its contributions. It also reports on the limitations of this work. Finally, the potential future directions for this research are illustrated.
This chapter presents the background to the thesis. The chapter is divided into four sections. The first section introduces the general challenges regarding big data, while the second section focuses on challenges related to data analytics and research. The third and fourth sections delve into the contextual scope of the thesis and present various methods for protecting privacy in big data. The fourth section more closely investigates k-anonymity methods and techniques. This chapter gradually approaches the core study of the thesis, starting from a general concept and ending with the specific concept of data privacy protection.
Section 2 describes some of the challenges associated with big data analytics, with a focus on the general challenges, such as the complexity of analytics algorithms and the shortcomings of the Pig and Spark frameworks. Both frameworks have limitations for iterated and conditional programming; therefore, programmers are forced to use customised user-defined functions that are executed in black boxes. However, customised functions cause several non-clear errors that may occur when executing big data. Spark and data streaming are cumbersome for large data volumes. Deep analytics may cause memory overflow, which can unexpectedly terminate the program or task. Section 3 investigates security in big data analytics. The most significant security challenges are privacy violation and personal re-identification. Various security breaches are described, along with some popular solutions for preventing or reducing personal re-identification attacks, including differential privacy and k-anonymity. With respect to differential privacy, two software applications are described: Airavat and GUPT. In addition, several challenges and impairments are presented in relation to differential privacy. Another popular security prevention method, k-anonymity, was chosen by many researchers over differential privacy, encryption and homomorphic encryption. In addition, the impairments and challenges related to k-anonymity are presented in the same section. In Section 4, k-anonymity is discussed in detail, including discussion of several methods of specialisation and generalisation techniques for traditional and big data.
2.1
Big Data Structure and Challenges
Establishing an appropriate big data structure is a complicated task. This complexity begins with establishing the appropriate infrastructure for the available data type. This decision has consequences because the type of infrastructure selected can affect future choices regarding other computing and application layers. The following explains the complexity involved in selecting the correct infrastructure, computing and application layers.
Recent advancements in technology have led to the ability to transmit data to the Cloud network. Portable hardware devices, such as tablets, smartphones and laptops, have encouraged investors to adopt Cloud infrastructure as an adequate solution for various I.T. hinders. Software applications designed for these new devices are technically correlated with the Cloud. The term ‘big data’ was coined to cope with these advancement trends. Big data exhibit unique characteristics in comparison with traditional data. These unique characters are summarised as the ‘3Vs’—volume, velocity and variety. To deal with massive volumes of data, we require efficient mechanisms to store, retrieve and analyse these large volumes. Hence, volume refers to the massive size of stored data, with the capability to scale up the storage size. Velocity is related to performance and efficiency in handling data transmission and process. Transmission time is the time spent collecting or storing data among storage nodes within a cluster or across clusters. Variety is related to the variety of data types, both structured and unstructured. These big data characteristics call for new system architectures for large-scale data acquisition, transmission, storage and processing mechanisms [50].
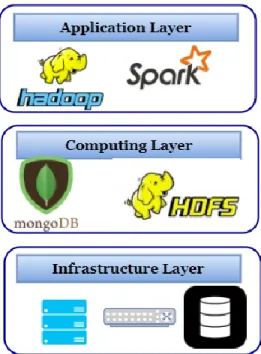
Big data structure can be decomposed into three main layers: infrastructure, computation and application. The infrastructure consists of a pool of hardware devices and device management systems. The virtualisation system is part of this layer. This also includes all software programs related to network management and security. The second layer is the computation layer, which is the middleware between the infrastructure and the application layers. This layer is divided into three main components: integration, management and programming models. The integration is related to data distribution and aggregation to/from data nodes within the cluster. The integration is managed by the
file system. Many free-source file systems were developed during the last decade, such as Quantcast File System, Hadoop Distributed File System (HDFS), Ceph [147], Lustre, GlusterFS, Google File System and Parallel Virtual File System. These proposed file systems were essential to replace the traditional network file systems. For instance, the network file system is too inefficient to handle very large data across many nodes. Moreover, while the storage area network file system can be scaled up, it is extremely expensive because of its dependency on fibre channels. Recent file systems were specifically designed for big data, most of which provide parallel computation and a map–reduce concept or something similar. In addition, they provide a portable operating system interface. The network connections between the servers and storage disks, such as network-attached storage and network file systems, are not recommended in the MapReduce domain. Instead, a direct access connection is used, such as a Small Computer System Interface (SCSI), Serial Advanced Technology Attachment (SATA)
or Serial Attached SCSI (SAS). Over time, most big data file systems have developed many similarities in structure and operations. The second component of computation is management, which is related to big database management systems, such as Structured Query Language (SQL) and NoSQL. Finally, the third component is the programming model, which combines the management and file system. It facilitates the data analysis applications and then organises the parallel distributed process. MapReduce [13], Dryad [42], Pregel [43] and Dremel [44] exemplify programming models.
The third layer is the application layer. This layer connects the application interface with the programming model in the second layer. Both the programming model and application interface involve various data analysis functions, such as queries, statistics and classification. The application layer exploits the MapReduce and parallel distributed tools to inquire about statistical analyses, machine learning and precision, classification and other analytics needs. The three consecutive layers are related to each other. Selection of infrastructure should consider the application needs and functions. Selecting an appropriate file system is linked to the chosen programming model. Divisions and layers must be pre-planned before establishing the infrastructure. For instance, the HDFS does not efficiently operate with any storage virtualisation, such as Redundant Array of Independent Disks (RAID); instead, input/output (I/O) data are
handled by Just Bunch of Drives (JBOD). Therefore, data storage should be provided with HDFS compatibility to ensure optimal performance. In another example, if an organisation has decided to adopt a network-attached storage file system, then all storage devices must be provided with fibre channels [59].
With big data, it is essential to maintain the three layers under continuous monitoring. The extensive amount of data may overwhelm the management level because of selecting an inappropriate layer of infrastructure, management or application. Thus, this selection is very sensitive and must be very accurate, as a delay of microseconds may accumulate exponentially with continuous data increase. However, the complexity of the three layers, with varieties of choices, may mislead data owners when choosing the optimal solution for their applications. For the management model, there are many kinds of databases, yet there is no optimal database for all data types. The optimal database depends on the workload scenario, speed of read/write and many other options. Researchers have proposed general comparisons between database performance regarding reading, writing, latency, durability, synchronicity and asynchronicity [28] [71].
Figure 2.1—The three layers of the big data structure
Researchers have inferred that no single database management system can make distinctive performance. The database is stored and retrieved by primary-key, key-value,
column or document. This variety of database management systems may perform differently. In addition, database management models differ. Some databases operate on random-access memory (RAM) and keep a replication or snapshot on disks. Other databases operate on disks and keep a cached copy on RAM. Moreover, some database structures retain a high level of consistency and a low level of availability or vice versa. Many NoSQL databases are available in the market, including MongoDB [26] and simpleDB [101] for file data, Bigtable and HBase for column data, Dynamo and Redis for key-value data, and PNUTS for row data. Ultimately, choosing the appropriate database type is one of the main challenges related to big data.
In a similar concept to database management models, the programming model also contains different options. Data owners need to choose between batch processing, graph processing and stream processing models. The batch processing model deals with a snapshot of the targeted database. The stream processing model handles real-time data, so the amount of copied data from disks to memory is very small. The graph processing model suits certain applications, such as social media, where entities are related to one another [95]. This model is iterative in nature, and the same dataset is revised many times. The most popular graph processing models are Pregel [43] and GraphLab.
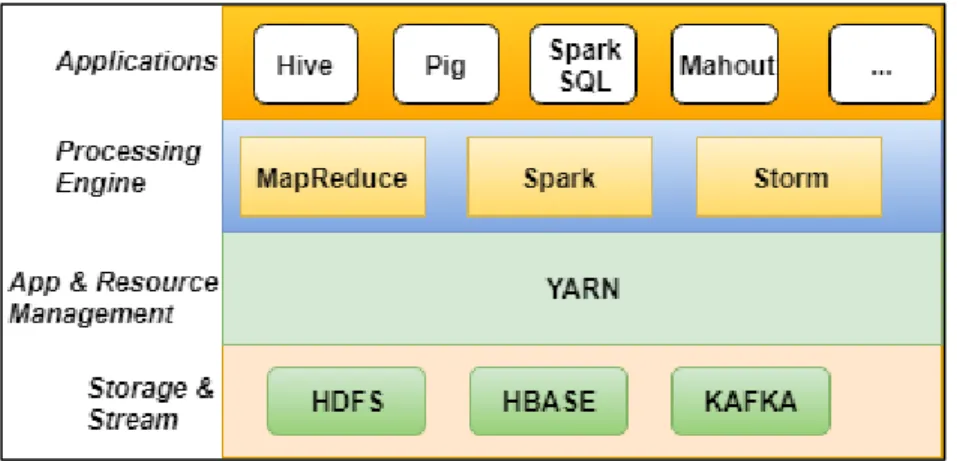
A batch processing model consists of two user-defined functions—map and reduce— which are known as MapReduce operations. Their concept is expressed by performing data-intensive computations in parallel distributed operations. A MapReduce reads input files from a distributed file system, which splits the data into multiple chunks. Each chunk is assigned to a mapper that reads the data, performs some computation and outputs a list of key/value pairs. In the next phase, reducers combine the values belonging to each distinct key according to some functions, and write the result into an output. The framework ensures fault-tolerant execution of mappers and reducers while scheduling them in parallel on any machine (node) in the system [144]. There are many batch processing models available in the information technology (IT) industry, such as Hadoop and its ecosystems, and Dryad. Hadoop is a free-source framework developed by Apache. Hadoop ecosystems reside at the top of Hadoop operations. Examples of these ecosystems are Pig, Hive and Spark.
MapReduce models provide a range of options for different business needs. Some MapReduce models operate in memory, while others operate in disks. Pig and Hive operate in disks, which reduces the efficiency of iterative and interactive jobs. This imposes a continuous reading from nodes’ disks on each MapReduce operation. Moreover, each set of iterative operations (query) is counted as a separate MapReduce job, which incurs significant latency [155]. In Spark, the concept is different, since it implements a resilient distributed dataset (RDD), which represents a read-only collection of objects partitioned across a set of machines. The RDD is explicitly cached in memory across nodes and reused in multiple MapReduce-like parallel operations. This process creates a temporary copy of the data in memory; thus, all iterative and interactive jobs are computed in RAM. This technique reduces latency, which is usually caused by travelling time spent on input and output with the disk.
The three big data layers include many technologies and models; thus, designing an adequate big data network is not an easy task. The most difficult element is finding the most compatible design that suits the data type and structure. This is even harder when the data contain varieties of files, multimedia and database sets. This diversity may recursively appear in a multi-tenant data structure, when some users execute a massive data size, while other users need to deal with data stream projects. This diversity has created complexity, and these challenges urge researchers to find a suitable platform that can deal with a dynamic stack of operations. The stack should be able to select the optimal performance matrix based on the data type and structure.
2.1.1
Data Analytics
Data analytics is the most important aspect of big data. The aim of data analytics is extracting useful information that facilitates decision making, prediction, verification of the legitimacy of data, and diagnosing and inferring the reasons for faults. The great diversity of data analytics methods and needs has led to several types of analytics categories. The categories can be summarised as descriptive, predictive and prescriptive. Descriptive analytics implement data mining for insight analysis to determine what has occurred in the past. Predictive analytics implement statistics and forecast methods to
predict future behaviour. Prescriptive analytics implement simulation to identify system behaviour and subsequently enable decision making [38].
Big data analytics has gained increased popularity because of new technology trends. These trends include new business applications that rely on data analytics, network applications and scientific application evolution. The earliest business data were intuitive and straightforward, and relational database management systems were able to accommodate and operate the available amount of data. General stored data were structural. Online transaction processing and online analytical processing were operated at a small scale. However, from the beginning of the new century, there was a significant shift in data collection techniques. The internet has supported companies to provide some of their data online, which offers customers more interaction with the business, and enables better automation of the business systems. [119]. Online participants offer a tremendous number of products and large quantities of customer information. Clickstream data logs provide companies with the opportunity to study customers’ behaviour, required products and popular services. Moreover, since 2010, another wave of evolution has arisen, presented by smartphones. The number of smartphones and tablets sold exceeds the number of laptops and personal computers. Portable devices and the Internet of Things have also created new features, such as location tracking, person-centred care and context awareness [19].
The evolution of smartphones has supported the development of new services because of the increased number of users. Most of these services were not possible a few years ago. Smartphones are technically known as non-personal computers and impose limitations in processing and storing data. The amount of data produced by individuals exceeds the capacity of these devices. This concern led to users’ data being moved to the Cloud network. Currently, most mobile applications run on the Cloud network, and the Cloud network dominates the majority of global data. The most extensive data size occupied by users is multimedia data, such as images and videos. Social media has significantly participated in the data growth. It is estimated that more than 500 terabytes of data are uploaded to Facebook servers every day [33]. Moreover, scientific research has produced vast volumes of data in fields such as astrophysics, oceanography,
genomics and environmental research. The American National Science Foundation has announced a BIGDATA project that aims to advance the core scientific and technological means of managing, analysing, visualising and extracting useful information from large and heterogeneous data to accelerate the progress of scientific discovery and innovation [151].
Medical data are one of the most prominent forms of data, and have intensive analysis demand. Patients’ data are precious for many parties and organisations. Medical data are rotated and distributed to many medical and non-medical organisations. It is difficult to trace medical data in many countries because the mesh network of transmitting information may contain more than 50 different departments. Figure 2.2 illustrates the complexity of tracing patients’ medical data and the critical need for such data. The figure presents one example of how insurance companies can access data regarding physicians, hospitals, patients, pharmacies, employment and many other details, with and without the patient’s name. This high demand for medical data recall has led to the need to establish a complete data access framework, with fine-grained access privileges.
Legend: With patient’s name Without patient’s name Figure 2.2—Data map showing patients’ information distribution (Source [58])
2.2
Big Data Analytics Challenges
One of the major challenges facing big data analytics is the analytics algorithm. Analytics techniques and algorithms in big data are unlike those of traditional data analytics. Although the calculation procedures of statistics, predictions and simulation are similar for both traditional and big data, the technique applied to calculate and conclude the results is different. Big data consist of structured and unstructured data, which imposes an extra step of structuring data before the analytics is conducted. Statistical or predication equations can not directly calculate unstructured data; thus, the unstructured data are first mined and converted to structured data [9]. However, the unstructured data are not the main concern—rather, the volume of big data remains the main challenge in analytics.