San Jose State University
SJSU ScholarWorks
Master's Theses Master's Theses and Graduate Research
Summer 2016
Experiments with and Implementation of a
Context Sensitive Text Summarizer
Charles Joseph Bocage
San Jose State UniversityFollow this and additional works at:https://scholarworks.sjsu.edu/etd_theses
This Thesis is brought to you for free and open access by the Master's Theses and Graduate Research at SJSU ScholarWorks. It has been accepted for inclusion in Master's Theses by an authorized administrator of SJSU ScholarWorks. For more information, please [email protected].
Recommended Citation
Bocage, Charles Joseph, "Experiments with and Implementation of a Context Sensitive Text Summarizer" (2016).Master's Theses. 4715.
DOI: https://doi.org/10.31979/etd.n6yw-h3k7 https://scholarworks.sjsu.edu/etd_theses/4715
EXPERIMENTS WITH AND IMPLEMENTATION OF A CONTEXT SENSITIVE TEXT SUMMARIZER
A Thesis Presented to
The Faculty of the Department of Computer Science San José State University
In Partial Fulfillment
of the Requirements for the Degree Master of Science
by
Charles J. Bocage August 2016
c
○ 2016
Charles J. Bocage ALL RIGHTS RESERVED
The Designated Thesis Committee Approves the Thesis Titled
EXPERIMENTS WITH AND IMPLEMENTATION OF A CONTEXT SENSITIVE TEXT SUMMARIZER
by
Charles J. Bocage
APPROVED FOR THE DEPARTMENTS OF COMPUTER SCIENCE
SAN JOSÉ STATE UNIVERSITY
August 2016
Dr. Christopher Pollett Department of Computer Science Dr. Thomas Austin Department of Computer Science Dr. Robert Chun Department of Computer Science
ABSTRACT
EXPERIMENTS WITH AND IMPLEMENTATION OF A CONTEXT SENSITIVE TEXT SUMMARIZER
by Charles J. Bocage
Automatic text summarization is the ability to obtain key ideas from a text passage using as few words as possible. With the increase in data on the web, manual summarization of web pages has become unfeasible, and the need for automatic text summarization has become ever greater. This project explored and implemented various parts of the automatic text summarization process for an open source search engine, Yioop. These parts included stemming, text segmentation, term frequency weighting, automatic sentence compression, and content management system detection.
In addition, experiments were conducted on different pre-existing Yioop summarizers. These results served as a baseline for comparison with results obtained from two new ways to generate summaries which we implemented: A graph based approach and an average sentence approach. Summaries were evaluated using Recall-Oriented Understudy for Gisting Evaluation (ROUGE). Analyzing the ROUGE results of each summarizer showed that the new summarizers did not produce better summaries than Yioop’s pre-existing summarizers. During the course of conducting these experiments, it was noted that the location of useful information on a web page could often be obtained if one could determine the content
management system that created the web page. An extensible detector for the content management system was written for the Yioop search engine. ROUGE results using this system were recomputed for the various summarizers. Using the content management system detector resulted in a ten to twenty percent increase in ROUGE scores across various page experiments.
ACKNOWLEDGMENTS
I would like to express my gratitude towards my advisor Dr. Chris Pollett for guiding me through the extensive research process that became this Master’s thesis. Furthemore, I would like to thank Dr. Christopher Pollett for exposing me to this topic in addition to all of his help during the journey to completion. I would also like to thank my committee members Dr. Thomas Austin and Dr. Robert Chun for their suggestions and support. Lastly, I would like to thank my family and friends for their encouragement and belief in me.
Contents
Chapter
1 Introduction . . . 1
2 Background . . . 3
2.1 Automatic Text Summarization . . . 3
2.1.1 Types . . . 3
2.1.2 Phases . . . 4
2.2 The Yioop Search Engine . . . 5
2.3 Term Frequency-Inverse Document Frequency . . . 6
2.4 Text Segmentation . . . 6
2.5 Cosine Similarity . . . 7
2.6 Latent Semantic Analysis . . . 7
2.7 Redundant Word Removal . . . 8
2.8 Recall-Oriented Understudy for Gisting Evaluation (ROUGE) 8 2.8.1 Longest Common Subsequence . . . 9
2.8.2 Skip-bigram Co-occurrence . . . 10
3 Understanding the Preprocessing Before Summarization . . . 11
3.1 Stemmers . . . 11
3.2 The Design of the Dutch Stemmer . . . 11
4 Testing the Pre-Existing Summarizers . . . 14
4.1 ROUGE Results . . . 14
5.1 Page Rank Algorithm for Ranking Sentences . . . 15
5.2 Distortion Measure Calculation . . . 15
5.3 Graph Based Ranking Summarizer . . . 17
5.4 ROUGE Results . . . 18
6 Implementing Term Frequency Weighting in the Centroid-Based Sum-marizer . . . 19
6.1 Term Frequency Weighting in the Centroid-Based Summarizer 19 6.2 Term Frequency Weighting Experiment Results . . . 20
7 Centroid-Based Weighted Summarization . . . 21
7.1 Centroid-Based Weighted Summarization Algorithm . . . 21
7.2 ROUGE Results . . . 22
8 Locating and Testing Against a Large Data Set . . . 23
8.1 Document Understanding Conference . . . 23
8.2 Results of the Experiments with a Large Data Set . . . 24
9 Improving the ROUGE Results Using Content Management System Detection . . . 25
9.1 Content Management System Detection for Search Engines . . 25
9.2 Content Management System Detection Design . . . 25
9.3 Content Management System Detection ROUGE Results . . . 27
10 Understanding the Post-processing After Summarization . . . 29
10.1 Automatic Sentence Compression . . . 29
10.2 Automatic Sentence Compression Framework Design . . . 30
11 Conclusion and Future Work . . . 32
APPENDIX A Appendix A: Yioop’s Summarizers Result Files . . . 35
A.1 BASIC ROUGE Result . . . 35
A.2 CBS ROUGE Result . . . 35
A.3 BASIC ROUGE Configuration File . . . 36
A.4 CBS ROUGE Configuration File . . . 40
A.5 Human Generated Input . . . 44
A.6 System Generated Input . . . 45
B Appendix B: Graph Based ROUGE Result . . . 47
C Appendix C: CBS Weighted ROUGE Result . . . 49
D Appendix D: Locating and Testing Against a Large Data Set Result Files 51 D.1 Overall Rankings . . . 51
D.2 ROUGE Test Rankings . . . 51
E Appendix E: Improving the Creator’s Algorithm Result Files . . . 54
E.1 CBWS ROUGE Result Before . . . 54
E.2 CBWS ROUGE Result After . . . 54
F Appendix F: Understanding the Post-processing After Summarization Result Files . . . 56
List of Tables
D.1 Overall Rankings . . . 51 D.2 ROUGE Test Rankings . . . 53
List of Figures
1 Summarization classification . . . 4
2 Automatic Text Summarization Process . . . 5
3 R1 and R2 Regions . . . 12
4 Example of a Dutch Stemmer . . . 13
5 Sample Text Passage Graph . . . 16
6 Example of a graph based summarizer in PHP . . . 18
7 Example of an additional weighting algorithm in PHP . . . 20
8 Example of a centroid based weighted summarizer in PHP . . . . 22
9 Sample WordPress HTML Header . . . 26
10 Example of a head tag checker for WordPress in PHP . . . 27
CHAPTER 1 INTRODUCTION
Automatic text summarization (ATS) is the use of computer algorithms to obtain key ideas from a text passage using as few words as possible. Modern search engines obtain documents from across the web in a variety of tag based languages. Choosing what to index from these documents is an important step in making documents searchable and involves ATS. This thesis reports on our attempts to improve the summarization component of the Yioop open source search engine.
The first work on ATS was done by Luhn [11] in the 1950s. He suggested using many of the common techniques like term frequencies and stop work removal to summarize content. Over the years, Luhn’s techniques still remain in use, and some improvements have been made. For example, the inverse document frequency calculation was introduced to improve the term frequency technique. The latest techniques and improvements are discussed further in Chapter 2.
This thesis project uses the Yioop search engine to produce its summaries. The Yioop search engine is an open source search engine created by Dr. Christopher Pollett at San Jose State University.Since its inception, it has grown to have 30 contributers. Yioop has a search front end, a crawler to obtain documents, and an indexer that makes use of a summarizer. It also has several other features that were of lesser importance to this project such as a news service, social groups, blogs, wikis, and website hosting.
In order to improve something, one needs a metric to evaluate its current performance. So to improve a summarization algorithm, one needs a tool for measuring the quality of the summaries it generates. Judgments made by a committee of trained evaluators were among the first approaches to measuring
summary quality. However, when one has a very large number of documents to evaluate, this process can be very slow. Before automation, it could take thousands of hours to evaluate all the summaries for a contest like the Document Understanding Conference. Recall-Oriented Understudy for Gisting Evaluation (ROUGE) was developed to provide a mechanism whereby summaries could be evaluated frequently at large scale. ROUGE is currently the gold standard for calculating summary metrics and was used to evaluate the summaries produced by the Yioop search engine.
The result sections of each experiment show that improving summarization algorithms is difficult. Using content management system (CMS) detection is one way of improving summarization for search engines. This is because traditional summarizers digest plain text content but search engines summarize HTML documents. The HTML documents usually contain non-important content like navigations and links to other pages. Implementing CMS detection can improve summarization results by ten to twenty percent. It does this by allowing the summarizer to focus on the important content only.
This paper is organized as follows: Chapter 2 provides background information on the building blocks of the experiments. Chapter 3 covers an experiment with summarization preprocessing. In Chapter 4 the pre-existing summarizers in the Yioop search engine are compared. Chapter 5 covers a new summarizer for the Yioop search engine. Chapter 6 covers an algorithm in which to augment term frequency weights. Chapter 7 covers a new summarization algorithm using a concept based on average sentence closeness. Chapter 8 covers a comparison of the current summarizers, including the two new ones, against a large data set. Chapter 9 covers applying content management system detection to the summarization process. Chapter 10 covers summarization post-processing. Finally, Chapter 11 concludes the paper and presents possible future work.
CHAPTER 2 BACKGROUND 2.1 Automatic Text Summarization
Summarization of a text passage is a complex task. To be able to summarize a text passage efficiently, a summarizer needs to be broken down into different parts. At a high level, ATS can be explained further by splitting the discussion into types and phases.
2.1.1 Types
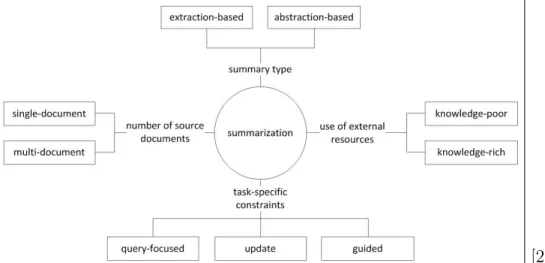
Summarizers can be extract based or abstract based. Extract based summarizers output the sentences as they are written and abstract based summarizers attempt to paraphrase the sentences they output. In addition, summarizers are categorized by how many documents they try to summarize simultaneously. The two categories are single document or multi document. Single document summarization is obviously easier than multi document because there is only one document processed at at time. For example, a multi document summarizer faces the problem of choosing duplicate content in its summaries because the same content could appear in more than one of the documents it is summarizing.
Furthermore, summarizers can be either knowledge rich or knowledge poor. Knowledge rich summarizers have an external corpus of training data to improve the results of the summaries they produce and knowledge poor summarizers do not. They rely solely on the content being summarized to generate their summaries.
Lastly, summarizers can be extended for a specific use case. Most commonly, summarizers will summarize the content but sometimes they are focused to provide special features: query focused, update, and guided. Query focused summarizers hone in on their content based on a provided query. Update summarizers target new pieces
of information from articles assuming a reader has already read related articles. Guided summarizers classify their summaries into categories like earthquakes, hurricanes, and cyclones. The summarizers in the Yioop search engine are extract based, single document, and knowledge poor with no specific purpose extensions. Figure 1 shows how each summarization category fits together.
[21] Figure 1: Summarization classification
2.1.2 Phases
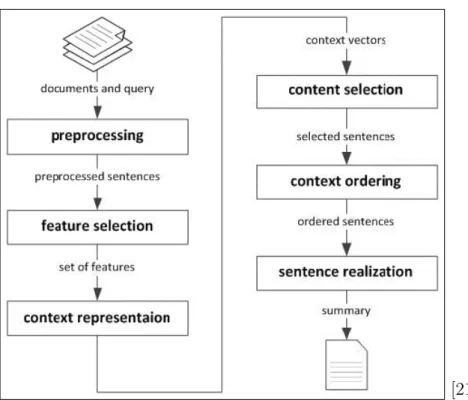
Figure 2 depicts the six phases in the creation of a summary: preprocessing, feature selection, context representation, content selection, context ordering and sentence realization. The preprocessing phase consists of eliminating terms that are not useful. The feature selection phase finds valuable characteristics of textual contexts. The context representation phase puts the context into a representable form.
[21] Figure 2: Automatic Text Summarization Process
In addition, the context selection phase marks the sentences such that the next task can easily choose the sentences to be in the summary. The last two phases are rarely used. Context ordering attempts to cluster or structure the text in an order that would generate a more coherent summary. Sentence realization attempts to summarize each of the sentences in the summary to produce a more concise version. 2.2 The Yioop Search Engine
As a search engine, after downloading a web page, Yioop uses a summarizer to select the content to be added to its index. The process of downloading a web page is performed by its fetcher. Once the web page is downloaded, the fetcher calls its HTML processor routines. Within those routines, the configured summarizer is loaded and summarization is performed. Once the summary is produced and stored, the fetcher performs the same actions on the next web page.
document, and knowledge poor with no extensions. There were two pre-existing summarizers in the Yioop search engine, the basic summarizer (BASIC) and the centroid-based summarizer (CBS). BASIC generates a summary by extracting sentences from an HTML document in a fixed order. CBS performs its summary generation using a centroid (a set of words that are statistically important to the document) to get the main idea for the document. After the centroid is created, CBS computes the text frequencies and cosine similarity to build the summary.
2.3 Term Frequency-Inverse Document Frequency
Term frequency-inverse document frequency (TF-IDF) is a task performed in the feature selection phase of summarization. TF-IDF determines the relevance of a sentence by computing its statistical weight. TF is a function of number of times (TC) the term w appears in the document d, otherwise known as its term frequency.
Inverse document frequency (IDF) is the number of documents |D| divided by the number of documents the term appears in plus 1:
𝑤𝑒𝑖𝑔ℎ𝑡(𝑤, 𝑑) =𝑇 𝐹(𝑤, 𝑑)·𝐼𝐷𝐹(𝑤) 𝑇 𝐹(𝑤, 𝑑) = 𝑇 𝐶|(𝑑𝑤,𝑑| )
𝐼𝐷𝐹(𝑤) = 𝑙𝑜𝑔|𝐷(𝑤|𝐷)||+ 1 2.4 Text Segmentation
In order for a summarizer to perform efficiently, text segmentation is critical. Text segmentation divides the text passage into separate contexts. In the case of a summarizer, the contexts are sentences. For example, the English language is difficult to segment because sentences do not always end with a period, question mark or exclamation point. Shortening someone’s middle name by using a period could confuse the text segmentation process. ‘‘Jane E. Doe likes computers’’ could be mistaken as two sentences when it is one.
To avoid text segmentation problems, rule-based or machine-learning
approaches are used. Rule-based approaches segment a text passage using regular expressions. On the other hand, machine-learning approaches are more sophisticated, using techniques like decision trees or neural networks that leverage comprehensive training sets.
2.5 Cosine Similarity
One way to tell if a sentence is similar to another during the feature selection phase is to calculate their similarity using the Euclidean dot product formula 𝐴 · 𝐵 =||𝐴|| ||𝐵|| cos𝜃 [20]. Isolating cos𝜃 leaves the cosine similarity formula to be cos𝜃= ||𝐴𝐴|| ||·𝐵𝐵||, where A and B are sentences represented by vectors. A and B are composed of the TFs of each term in the sentence relative to the entire document. For example, consider a document that contains the set of terms {a b c b a} and two sentences of {a c} and {a b}. The example document consists of three distinct terms {a, b, c}, so the TF vectors will contain three slots. To compare their similarity, the terms need to be counted. The TF vector for {a c} is {1, 0, 1}, the TF vector for {a b} is {1, 1, 0}, and the absolute TF is {2, 2, 1}. Calculating the cosine similarity for the two sentences gives 0.5. A perfect match is a value of 1.0. The closer the cosine similarity value is to 1.0, the more similar the sentences are.
2.6 Latent Semantic Analysis
Latent semantic analysis (LSA) is a matrix-based approach to capture the relationship between terms and the text in which they occur. LSA can be used to generate a summary of a text passage. To do it, LSA converts the text passage into an initial TF matrix 𝑋. Based on 𝑋, LSA creates new matrices using the singular vector decomposition (SVD) process. To perform the SVD computations, the initial matrix X, of r rows by𝑐columns, is decomposed into three matrices: U, S, V. U is an 𝑟 x 𝑟 sized matrix consisting of the eigenvectors of 𝑋𝑋𝑇. The rows of U represent the
co-occurrences of the terms. The 𝑆 matrix is an 𝑟 x 𝑐 diagonal matrix representing the importance of the eigenvectors. The matrix 𝑉 is the opposite of 𝑈. It is a 𝑐 x 𝑐 matrix of the eigenvectors of𝑋𝑇𝑋. The rows of V represent the relationship between
context in the text passage. Once the text passage has been decomposed using SVD, it can be used to approximate context similarity. Context similarity can be
approximated by using the rows of V or the rows from the dot product of V and S. 2.7 Redundant Word Removal
Redundant word removal is performed in the preprocessing phase of summarization. Redundant words are words that occur frequently but are not particularly important to sentences. The idea behind redundant word removal is that removing redundant words helps sentences appear more relevant. For example,
either, already, and often are stop words used for summarizing text written in English. Consider the sentence: I drink water often. Removing the word ‘‘often’’ does not change the meaning of the sentence but makes it appear more relevant.
2.8 Recall-Oriented Understudy for Gisting Evaluation (ROUGE)
To perform summarizer evaluations frequently and on a large scale, [9] began developing a system called Recall-Oriented Understudy for Gisting Evaluation (ROUGE). ROUGE is a well designed PERL script whose purpose is to determine the
quality of a summary by comparing it to human summaries. ROUGE uses various metrics to calculate statistics: Recall (R), Precision (P), and F measure. The P measure is the relevance of the retrieved documents, the R measure is the relevance of the relevant documents, and the F measure is a combination of both.
𝐹 = 2· precision + recallprecision·recall
𝑟𝑒𝑐𝑎𝑙𝑙 = |{relevant documents}|{relevant documents}∩retrieved documents| |
provided by [18]
Below is a brief explanation of each test ROUGE can perform:
∙ ROUGE-L measures sentence-to-sentence similarity based on the longest common subsequence (LCS) statistics between a candidate translation and a set of reference translations [9].
∙ ROUGE-S computes skip-bigram co-occurrence statistics [9].
∙ ROUGE-W is an extended version of ROUGE-L. The only difference is ROUGE-W weights the LCS statistics and favors contiguous occurrences.
∙ ROUGE-SU is an extended version of ROUGE-S. ROUGE-SU considers skip-bigrams and unigrams, hence the addition of U in the name.
∙ ROUGE-N is an N-gram recall between a candidate summary and the reference summaries. N is the length of the n-gram [9] usually between one and four. Further details of each of these measures is covered in the next sections.
2.8.1 Longest Common Subsequence
Determining the longest common subsequence (LCS) of two text passages is one way to detect how similar they are. This technique is used in the ROUGE-W measure. The use of LCS originates in biology. Biologists use the LCS to compare DNA strands of different organisms in order to find out how similar or related the organisms are. DNA molecules are chains that can be viewed as a string of subunits. The chains are built from simpler subunits that are denoted by the letters A, C, G, T.
The LCS technique can easily be transferred for other uses such as
summarization. The difference is that the sequences are words instead of letters. Cormen [4] defines a subsequence as ‘‘the given sequence with zero or more elements left out.’’ Using LCS as a base, summarization requires that order be preserved in a common subsequence. A common subsequence is a subsequence contained in both sentences and LCS’s goal is to find the longest one. Cormen gives a good example of two sentences and how LCS would evaluate them. Consider the two sentences X={A,
B, C, B, D, A , B} and Y={B, D, C, A, B, A}. They have many common
subsequences: {A, B}, {B, D}, {B, C, A}. The longest LCSes are {B, C, B, A} and {B, D, A, B}. In such cases where there is more than one LCS, the standard dynamic
programming algorithm will choose the first one it encounters. 2.8.2 Skip-bigram Co-occurrence
Skip-bigrams are pairs of terms from a sentence occurring in order while allowing for other terms to be skipped. ‘‘Skip-bigram counts all in order matching word pairs while LCS only counts the longest one’’ [9]. For example, a sentence {A, B, C, D} has six skip-bigrams: {A, B}, {A, C}, {A, D}, {B, C}, {B, D}, and {C, D}. Skip-bigram also has to consider the distance between terms because the chance of a bigram being duplicate words is great. For example, {the, the}. The formula below is used to compute the Skip-bigram Co-occurrence F measure, recall, and precision scores. X and Y represent sentences, while m is the length of X and n is the length of Y. If the distance of the terms is to be restricted further, the m and n can be replaced with smaller values. As defined in [9]:
𝑅𝑠𝑘𝑖𝑝2 = 𝑆𝐾𝐼𝑃𝐶(𝑚,2(𝑋,𝑌2) ) 𝑃𝑠𝑘𝑖𝑝2 = 𝑆𝐾𝐼𝑃𝐶(𝑛,2(2)𝑋,𝑌) 𝐹𝑠𝑘𝑖𝑝2 = (1 +𝛽2)𝑅 𝑠𝑘𝑖𝑝2𝑃𝑠𝑘𝑖𝑝2 𝑅𝑠𝑘𝑖𝑝2 +𝛽2𝑃𝑠𝑘𝑖𝑝2
CHAPTER 3
UNDERSTANDING THE PREPROCESSING BEFORE SUMMARIZATION Before delving directly into the Yioop summarization process, a simple experiment with stemming was performed. A truncating stemmer in the Dutch language is the stemmer used in the experiment which was tested on over 49000 words provided by Martin Porter.
3.1 Stemmers
A stemmer is an algorithm that reduces all words with the same stem to a common form [10]. The reducing of words to a common form is known as conflation (to bring together). For example, connect, connected, connecting,connection and
connections [15] would all conflate to connect. Stemmers are broken down into three categories: truncating, statistical and mixed. A truncating stemmer removes the appropriate affixes (prefix or suffix) in a word. Statistical stemmers remove affixes based on statistical analysis such as letter frequency. Lastly, a mixed stemmer uses inflectional and derivational methods to stem words.
Most stemmers are used as part of an information retrieval (IR) system or used for natural language processing. Julie Beth Lovins developed the first IR stemmers in 1968. Many stemmers today are general purpose because of the work of Martin Porter. In 1980, Porter presented a simple algorithm for stemming English language words [15]. Porter’s website, tartarus.org, has stemmers for many languages. Each supported language on Porter’s website contains pseudo-code for implementing your own version of his stemmers defined in his proprietary language called snowball [16]. 3.2 The Design of the Dutch Stemmer
To stem a word in the Dutch language, various steps need to be performed. To code this properly, the programming language of choice must be able to interact with
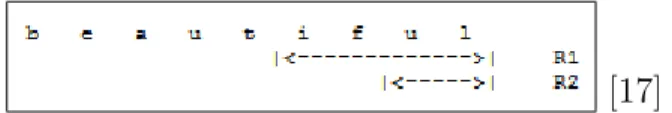
Unicode characters because the Dutch language contains letters with accents and umlauts. The first step is to remove all characters with umlauts or accents and replace them with their normal letter equivalent. The next step sets up the term such that a y is appended, a y is placed after every vowel, and i’s are capitalized. The next two steps define regions within the term as shown in Figure 3:
R1 is the region after the first non-vowel following a vowel, or is the null region at the end of the word if there is no such non-vowel. [17]
R2 is the region after the first non-vowel following a vowel in R1, or is the null region at the end of the word if there is no such non-vowel. [17]
[17] Figure 3: R1 and R2 Regions
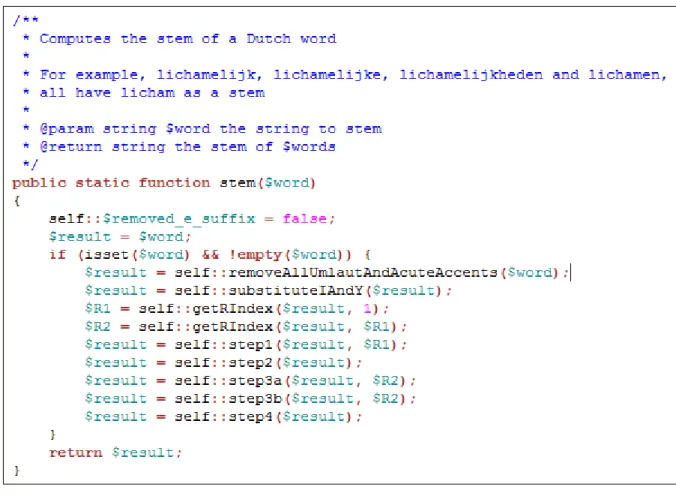
Then the algorithm proceeds through five steps to complete the stemming process. Step 1 performs certain actions on specific suffixes: heden, en ene, and s se. Step two deletes the suffix e if in region one and a vowel is in front of it. If this case is true it undoubles its ending. Step 3a deletes heid if it is in region two and there is not a letter c in front of it. Step 3b performs certain actions on more suffixes: end ing, ig, lijk, baar, and bar. Lastly step four removes duplicate vowels in between two consonants. Figure 4 is an example of a Dutch Stemmer.
CHAPTER 4
TESTING THE PRE-EXISTING SUMMARIZERS
The next experiment was to compare the Yioop search engine’s pre-existing basic summarizer (BASIC) and centroid-based summarizer (CBS) results to human created summaries on a sample of web pages and report the results. Each summarizer was run to produce its summaries. The summary results were then compared using the ROUGE software package, which is the gold standard for calculating
summarization metrics. 4.1 ROUGE Results
Overall, BASIC performed superior to the CBS. The test results were analyzed down to their respective R, P and F metrics. BASIC outperformed the CBS for the ROUGE-1, ROUGE-L, ROUGE-S, and ROUGE-SU in all metrics. BASIC and CBS tied in all metrics for the ROUGE-4 test. Furthermore, they split results in the ROUGE-2, and ROUGE-3 tests. All was not lost for the CBS because it did manage to surpass BASIC in all of the metrics for the ROUGE-W-1.2 test. The complete results are in Appendix A.
CHAPTER 5
UNDERSTANDING AND CREATING A NEW SUMMARIZER The overarching goal for this project is to improve Yioop’s automatic
summarization capacity. After an extensive literature review of current summarizers, a new summarizer was chosen to implement. Once the new summarizer was
implemented, its ROUGE results were compared to Yioop’s pre-existing summarizers. 5.1 Page Rank Algorithm for Ranking Sentences
There is a famous algorithm that is used to rank web pages created by Larry Page and Sergey Brin, the founders of Google [8]. It can be used to rank sentences as well. Here is a simple example of how it works: if there are five sentences, an initial probability vector [1/5, 1/5, 1/5, 1/5, 1/5] is created. An orthogonal matrix, in this case five by five, between sentences is created with entries defined using a distortion measure defined later. This orthogonal matrix is referred to as the adjacency matrix. The adjacency matrix is multiplied by the probability vector to generate a new probability vector. Then the squared difference (∑︀𝑖
(𝑣,𝑤)[𝑣𝑖−𝑤𝑖]2) of the old
probability vector v and the new probability vector w are compared. The process is repeated until the squared difference is below some threshold. For summarization, ten iterations are sufficient. ‘‘As few as 10 iterations produced a good approximate ordering, competitive with the exact ordering produced by the traditional
convergence measure’’ [8]. When the ten iterations are complete, the probability vector is returned and is used to generate the summary. Each sentence is added to the summary in order of highest probability to lowest probability.
5.2 Distortion Measure Calculation
A distortion measure (DM) is used to calculate the entries of the adjacency matrix. The distortion measure between sentences is the sum of the frequencies of all
the words in common divided by the sum of words that are not in common. 𝐷𝑖𝑠𝑡𝑜𝑟𝑡𝑖𝑜𝑛= non common wordsSum
Figure 5 is what the adjacency graph for our five sentence example looks like.
[19] Figure 5: Sample Text Passage Graph
Here is an algorithm for computing distortion:
1. Check each word in sentence1 to see if it exists in sentence2. If the word X of sentence1 does not exist in sentence2, square the score of word X and add to the sum and increase the number of not-common words by one.
2. In case the word X is common between sentence1 and sentence2, calculate its frequency in sentence2 and subtract it from the score of word X, then square and add to sum.
3. Then check the sentence2 to find its not-common words with sentence1, in case the word Y is not in sentence1, square the score of word Y and add to sum and increase the number of not-common words by one.
4. At the end, calculate the distortion between sentence1 and sentence2 by dividing sum by the number of not-common words.
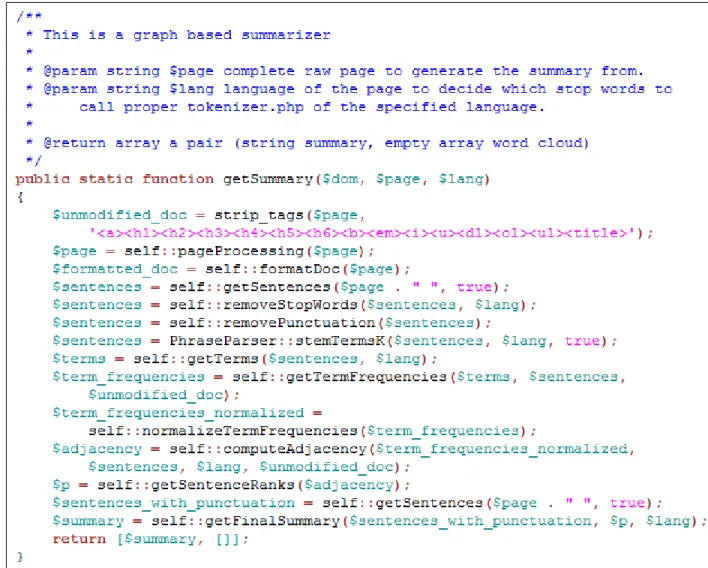
5.3 Graph Based Ranking Summarizer
The Graph Based Summarizer was created based on the Graph Based Ranking Summarizer [19]. It constructs a weighted graph out of the text where the sentences are the nodes. First, the file has to be read entirely into memory. Next, the
non-ASCII characters are removed. The next module replaces all new lines with spaces to help when it is time to split up the text into sentences.
Next the sentences are separated using the following regular expression: (?<!\w\.\w.)(?<![A-Z][a-z] \.)(?<=\.|\?). After the sentences are split, the stop words are removed. Furthermore, the punctuation is removed from the sentences. Now a porter stemmer is used to stem the remaining words. A vector is created that holds each word and the count of how many times the word occurs in the text. A weighted graph is created, known as the adjacency matrix, using the distortion measure. Finally, the sentences are ranked using the summarization form of the page rank algorithm. Figure 6 is an example of a graph based summarizer in PHP.
Figure 6: Example of a graph based summarizer in PHP 5.4 ROUGE Results
The raw results are in Appendix B. However an analysis of the results shows that they were dramatically lower than the BASIC and CBS already in the Yioop search engine. The highest result was not anywhere near the lowest for either of the other summarizers. For example, in the ROUGE-1 test, the CBS 95%-conf int value was 0.76663, the BASIC value was 0.80587, and the GBS value was 0.32603.
CHAPTER 6
IMPLEMENTING TERM FREQUENCY WEIGHTING IN THE CENTROID-BASED SUMMARIZER
The next attempt to improve Yioop’s summarizers was to extend CBS to include additional term weights. Once the algorithm was implemented, it was evaluated using ROUGE and compared to the other summarizers.
6.1 Term Frequency Weighting in the Centroid-Based Summarizer
This experiment considers the effect of adding weights to the centroid-based summarizer in order to improve its results. To do this, how the terms should be weighted and what to do with the additional weight values has to be defined. For example, if the term is in an H1 (heading) tag, a numerical weight is added to that term’s frequency. The HTML tags are classified into six categories. The first class contains only the A (anchor) tag. The second class contains the H1 and H2 heading tags. The third class contains the H3, H4, H5 and H6 heading tags. The fourth class contains the text emphasizing and list tags: STRONG, B, EM, I, U, DL, OL and UL tags. The fifth class contains the TITLE tag and the sixth class is everything else. Terms that fall through to the sixth class gets no additional weight.
The weight of each tag is multiplied by its term frequencies in that tag and summed. In other words, the weight of a term is the sum of all weights multiplied by its respective frequency in that tag. Figure 7 is an example of an additional weighting algorithm in PHP.
Figure 7: Example of an additional weighting algorithm in PHP 6.2 Term Frequency Weighting Experiment Results
No combination of weights was able to consistently improved the results over the original summarizers. It seemed that no matter what the weight was, the results were consistently lower. The CBS summarizer Average_R value without weighting was 0.76663 and with weights was 0.24689. Additional results are located in
CHAPTER 7
CENTROID-BASED WEIGHTED SUMMARIZATION
The goal of this experiment was to create a new algorithm that applies weights a different way in hopes of producing better ROUGE results. Again, the results of this experiment are evaluated using ROUGE.
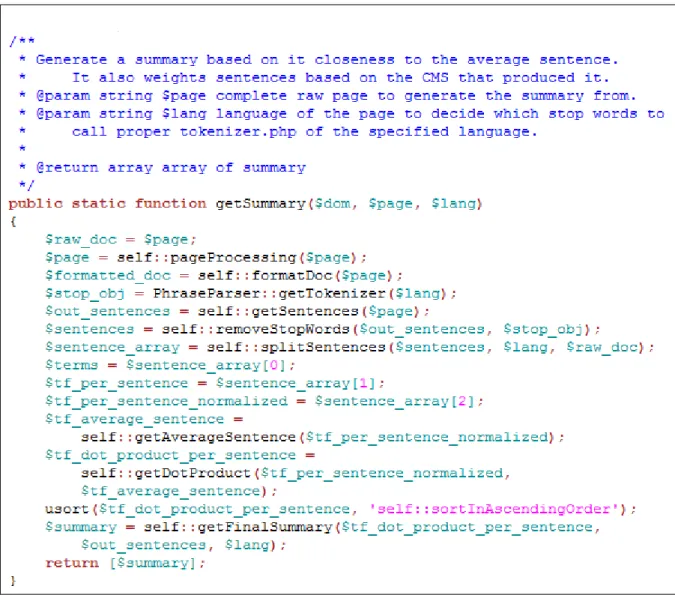
7.1 Centroid-Based Weighted Summarization Algorithm
The main idea of the centroid-based weighted summarizer (CBWS) is to find the sentences that are closest to the average sentence. This is done by first calculating the term frequencies for all sentences. Next the term frequencies for all of the sentences are normalized. Then the average sentence is calculated adding each term frequency column value and dividing it by the total number of rows. To compare the closeness of each sentence to the average sentence, the dot product of each sentence and the average sentence is calculated. Lastly, the dot product values are sorted with the largest at the top to represent the most important to least important sentences. Figure 8 is an example of a centroid based weighted summarizer in PHP.
Figure 8: Example of a centroid based weighted summarizer in PHP 7.2 ROUGE Results
The raw results are in Appendix E. The CBWS results were a little lower than the BASIC and CBS summarizers. One thing to note was that the results were better than the GBS.
CHAPTER 8
LOCATING AND TESTING AGAINST A LARGE DATA SET
The goal of this experiment was to test all of the summarizers against a large data set rather than the smaller human created data considered so far. The large document set used is from the Document Understanding Conference (DUC). 8.1 Document Understanding Conference
The Document Understanding Conference (DUC) is an event organized by the National Institute of Standards and Technology (NIST) that consists of a many summarization evaluations. ‘‘Its goal is to further progress in automatic text summarizations and enable researchers to participate in large-scale experiments in both the development and evaluations of summarization systems’’ [14]. DUC was held during the years 2001-2007. Its tasks have been merged into the Text Analytic Conference (TAC) which is also organized by the NIST.
DUC produces data that are useful for testing summarizers. The data are broken into two tasks, a main task and an update task. The tasks are independent of each other. The participants in the conference can choose to do one of them or both. The main task focuses more on the question answering problem. Contestants are given a topic and a set of 25 relevant documents they need to produce a 250-word summary that answers the questions in the topic. The update task contestants produce a 100-word summary based on the AQUAINT corpus. The AQUAINT corpus is ‘‘newswire articles from the Associated Press and New York Times (1998 -2000) and Xinhua News Agency (1996 - -2000)’’ [14]. The purpose of the summaries is to update the readers of new information based on the assumption that the readers have already read an earlier set of articles.
8.2 Results of the Experiments with a Large Data Set
Remember, Yioop has four summarizers: a centroid based summarizer (CBS), a basic summarizer (BASIC), a graph based summarizer (GBS) and a centroid based weighted summarizer (CBWS). There were 38 DUC summaries (4 of ours, 12 human and 22 candidates) used in the experiment. Reviewing the files in the Appendix D, the summarizer results all average closely together with the GBS being the best on average. The CBS had the best rank while the BASIC had the lowest rank. Although the generated summaries were better than some of the other summarizers, they still have 13 (17 total minus 4 human) computer generated summarizes ahead of them at best. Based on further analysis, BASIC performed best on each of the F-measure, Precision or Recall tests while the other summarizers did really well with the Recall tests.
CHAPTER 9
IMPROVING THE ROUGE RESULTS USING CONTENT MANAGEMENT SYSTEM DETECTION
The goal of this experiment was to try to get better ROUGE results using content management system detection before summarizing the content.
9.1 Content Management System Detection for Search Engines
When a search engine crawls a web page, it extracts the most important parts to store in its index. Not all parts of a web page need to be viewed as important to the page, for example, the page’s navigation or side-bar content. Detecting which content management system (CMS) a web page uses can improve the important content extraction. A CMS is a tool ‘‘for building and maintaining web applications for many disciplines’’ [12]. In other words, a CMS helps organizations stand up web content quickly with virtually no web programming experience. For example, WordPress offers its users plugins, themes, and site management functionality to publish content and apply consistent layouts. WordPress is so popular that it is used by 25.4% of all the websites [25].
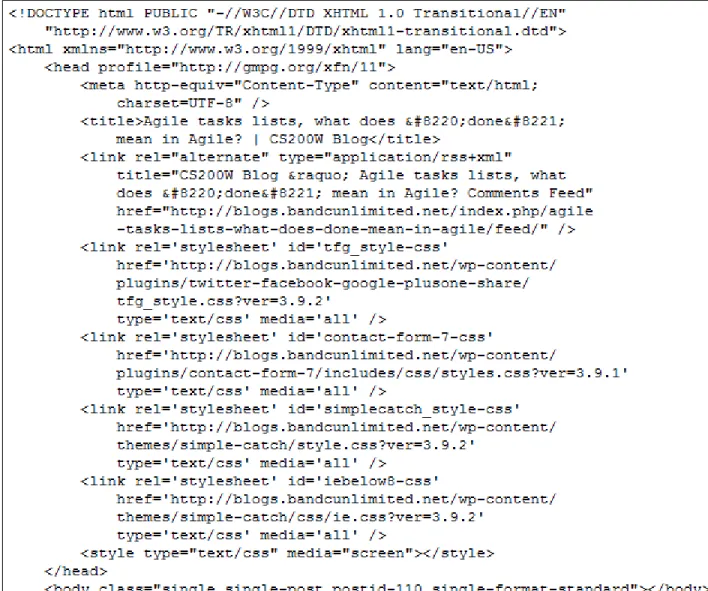
9.2 Content Management System Detection Design
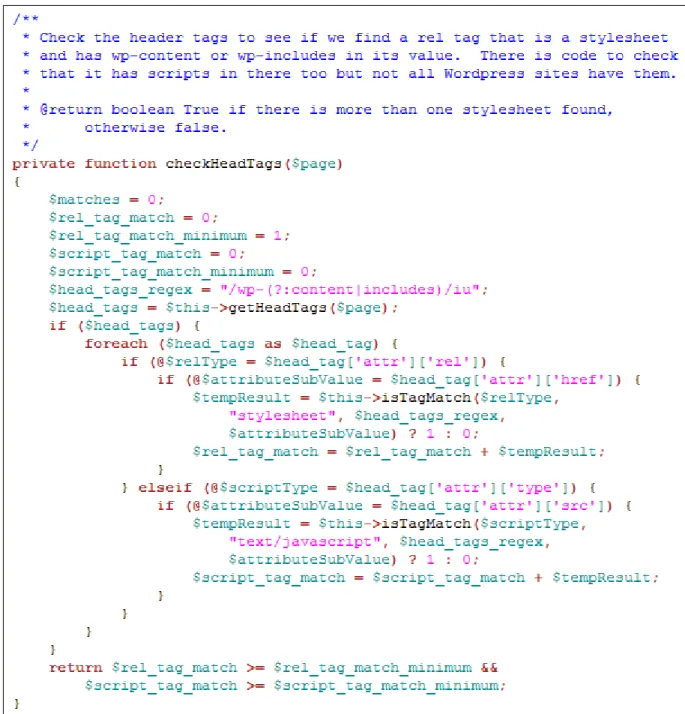
Most, if not all, CMS generated web pages leave a fingerprint behind in the HEAD tag. For example, a HEAD tag from my blog’s WordPress pages has paths to style sheets that almost always contain the words wp-content or wp-include as shown in Figure 9. Although any web page could have a similar entry in its HEAD tag and not be generated by WordPress, it is assumed not to be the case for our experiment. Figure 10 is an example of a head tag checker for WordPress in PHP.
Figure 10: Example of a head tag checker for WordPress in PHP 9.3 Content Management System Detection ROUGE Results
The ROUGE results improved by ten to twenty percent when CMS detection was used. They are given in Appendix E. For example, the ROUGE-1 Average_R score went up from 0.66665 to 0.80863 for the CBWS summarizer. Naturally, the
next thing to do was to see if the other summarizers would also produce better results. The only one that did not increase was the CBS.
CHAPTER 10
UNDERSTANDING THE POST-PROCESSING AFTER SUMMARIZATION
The goal of this experiment was to create a simple automatic sentence compression framework to improve text summarization. The ROUGE results were compared with and without automatic sentence compression.
10.1 Automatic Sentence Compression
‘‘Automatic sentence compression can be broadly described as the task of creating a grammatical summary of a single sentence with minimal information loss’’ [2]. The goal is to provide a more concise summary as a human would. Research on automatic sentence compression (ASC) has shown that ‘‘in many cases, sentences in summaries contain unnecessary information as well as useful facts’’ [13]. It is also noted that the longer the sentence, the greater the chance it contains unnecessary information. For example, consider the sentence:
As a tenured professor, Dr. Pollett has mentored many graduate students, who sometimes work on his search engine, which has improved the breadth of research on many topics.
Dr. Pollett mentors students, students working on his search engine and improving the breadth of research are three distinct topics. Depending on what is in the rest of the article being summarized, one of more of those topics may be irrelevant.
Research on automatic sentence compression has focused on rule based, term knowledge, and statistical approaches to solving the problem. The rule based
approach uses knowledge about how each term is related to the rest of the summary and/or syntactic structure of the sentence. For example, syntactical structure is used to trim sentences. ‘‘Commas, periods, and sentence start are used in identifying most of those items to remove’’ [3]. Term knowledge comes in the form of a corpus that
consists of ‘‘original sentences and their corresponding reduced forms written by humans for training and testing purpose’’ [6]. The corpus is further used to match phrases from the human summary to phrases in the document being summarized. The statistical approach uses rules, but the rules are not coded into the summarizer; they are learned. For example, rules are created using the first section of the Penn Treebank [23] (a syntactic and semantic parser), counting up all of the best context free grammar expansions [24]. Rules are also created using discourse informed models built on the framework of Integer Linear Programming [1].
10.2 Automatic Sentence Compression Framework Design
The sentence trimming algorithm presented is based on [3]. It relies on lists of words that fall into the various categories like propositions, determiners, and
conjunctions. In other words, it looks for specific words, phrases or clauses and removes them. The algorithm has seven categories but only four of them were implemented as show in Figure 11. They are [3]:
∙ We remove many adverbs and all conjunctions, including phrases such as ‘‘As a matter of fact,’’ and ‘‘At this point,’’ that occur at the start of a sentence.
∙ We remove a small selections of words that occur in the middle of a sentence, such as ‘‘, however,’’ and ‘‘, also,’’ (not always requiring the commas).
∙ For DUC 2006, we added the removal of ages such as ‘‘, 51,’’ or ‘‘, aged 24,’’.
∙ We remove relative clause attributives (clauses beginning with ‘‘who(m)’’, ‘‘which’’, ‘‘when’’, and ‘‘where’’) wherever possible.
Figure 11: Sentence Compression Algorithm in PHP 10.3 ROUGE Results
The sentence compression implementation was tested against the DUC data where it did not increase the ROUGE results. The DUC data have 120 documents to summarize and seven ROUGE tests to perform. That result in to a total of 875 tests for each summarizer. Out of the 875 tests, sentence compression lost 793 to 82 for the BASIC, 740 to 135 for the CBS, 821 to 54 for the CBWS and 784 to 91 for the GBS.
CHAPTER 11
CONCLUSION AND FUTURE WORK
The purpose of this project was to experiment with different parts of the automatic text summarization process, implement some new algorithms, and improve ROUGE results for the Yioop search engine. In the end, a Dutch stemmer was created, two new summarizers were created, summarizers were evaluated against a large data set, and a basic sentence compression framework was created.
During the research on automatic text summarization, questions arose that have not been answered yet. First, research on applying the appropriate weights to terms in order to increase the term’s importance was not successful. In chapter 6, the weighting schemes tested did not produce any noticeable results. In addition, the summarizers in the Yioop search engine perform text segmentation their own way. The new summarizers written required sentences to be segmented with and without punctuation. Future work in this area would consist of researching the best approach to segment the contexts and integrating it into the of Yioop’s summarizers, still preserving the versions with and without punctuation. Moreover, the experiment in Chapter 9 uncovered that detecting the CMS that produced the web page increased the ROUGE results but the work is not 100% complete. Some analysis could be done to see how similar the schemas are from version to version of the CMS to better facilitate CMS detection.
REFERENCES
[1] Clarke, James and Lapata, Mirella, Modelling Compression with Discourse
Constraints, EMNLP-CoNLL, 1--11, 2007
[2] Cohn, Trevor and Lapata, Mirella,Sentence compression beyond word deletion, Proceedings of the 22nd International Conference on Computational Linguistics, 137--144, 2008
[3] Conroy, John M and Schlesinger, Judith D and O‘leary, Dianne P and Goldstein, Jade, Back to basics: CLASSY 2006,Proceedings of DUC, 6:150, 2006
[4] Cormen, Thomas H, Introduction to algorithms, MIT Press, 2009
[5] Golub, Gene H and Van Loan, Charles F,Matrix computations, JHU Press, 2012 [6] Jing, Hongyan, Sentence reduction for automatic text summarization,
Proceedings of the sixth conference on Applied natural language processing, 310--315, 2000
[7] Kim, Youn S, Text Summarization, Master’s report, Department of Computer Science, San Jose State University, 2010,
http://scholarworks.sjsu.edu/etd_projects/212/
[8] Langville, Amy N and Meyer, Carl D, Google’s PageRank and beyond: The science of search engine rankings, Princeton University Press, 2011
[9] Lin, Chin-Yew, Rouge: A package for automatic evaluation of summaries,Text summarization branches out: Proceedings of the ACL-04 workshop, 8, 2004 [10] Lovins, Julie B, Development of a stemming algorithm, MIT Information
Processing Group, Electronic Systems Laboratory Cambridge, 1968
[11] Luhn, H. P., The automatic creation of literature abstracts, IBM Journal of Research and Development, 2(2):159--165, 1958.
[12] Mooney, Sean D. and Baenzigerp, Peter H., Extensible open source content management systems and frameworks: a solution for many needs of a bioinformatics group, Briefings in Bioinformatics, 9(1):69--74, 2008, http://dx.doi.org/10.1093/bib/bbm057
[13] Nenkova, Ani and Maskey, Sameer and Liu, Yang, Automatic summarization,
Proceedings of the 49th Annual Meeting of the Association for Computational Linguistics: Tutorial Abstracts of ACL 2011, 3, 2011
[14] NIST, DUC 2007: Task, Documents, and Measures, 2011, http://duc.nist.gov/duc2007/tasks.html
[15] Porter, Martin F, An algorithm for suffix stripping, 14(3):130--137, 1980, MCB UP Ltd
[16] Porter, Martin F, Snowball: A language for stemming algorithms, 2001, http://snowball.tartarus.org/texts/introduction.html
[17] Porter, Martin F, Defining R1 and R2, 2001, http://snowball.tartarus.org/texts/r1r2.html
[18] Powers, David M W, Evaluation: From Precision, Recall and F-Measure to ROC, Informedness, Markedness & Correlation, Journal of Machine Learning Technologies, 2 (1):37--63, 2011
[19] Samei, Borhan and Estiagh, Marzieh and Eshtiagh, Marzieh and Keshtkar, Fazel and Hashemi, Sattar, Multi-Document Summarization Using Graph-Based Iterative Ranking Algorithms and Information Theoretical Distortion Measures,
The Twenty-Seventh International Flairs Conference, 2014
[20] Spiegel M.R., Lipschutz S., Spellman D, Vector Analysis, McGraw Hill, 2009 [21] Sizov, Gleb, Extraction-Based Automatic Summarization: Theoretical and
Empirical Investigation of Summarization Techniques, Department of Computer and Information Science, 2010
[22] Smith, David,Estimation: Maximum Likelihood and Smoothing, University of Massachusetts Amherst, 2009
https://people.cs.umass.edu/~dasmith/inlp2009/lect5-cs585.pdf
[23] Taylor, Ann, Mitchell Marcus, Beatrice Santorini, The Penn treebank: an overview, In Treebanks, 5--22, 2003
[24] Turner, Jenine and Charniak, Eugene, Supervised and unsupervised learning for sentence compression, Proceedings of the 43rd Annual Meeting on Association for Computational Linguistics, 290--297, 2005
[25] W3Techs, Usage of content management systems for websites, 2015, http://w3techs.com/technologies/overview/content_management/all [26] Willett, Peter, The Porter stemming algorithm: then and now, Princeton
APPENDIX A
APPENDIX A: YIOOP’S SUMMARIZERS RESULT FILES A.1 BASIC ROUGE Result
---11 ROUGE-1 Average_R: 0.80587 (95%-conf.int. 0.68571 - 0.92333) 11 ROUGE-1 Average_P: 0.70494 (95%-conf.int. 0.55714 - 0.85833) 11 ROUGE-1 Average_F: 0.74742 (95%-conf.int. 0.61115 - 0.88264)
---11 ROUGE-2 Average_R: 0.70543 (95%-conf.int. 0.54000 - 0.86333) 11 ROUGE-2 Average_P: 0.61554 (95%-conf.int. 0.43571 - 0.80857) 11 ROUGE-2 Average_F: 0.65227 (95%-conf.int. 0.47596 - 0.83047)
---11 ROUGE-3 Average_R: 0.60484 (95%-conf.int. 0.39167 - 0.82833) 11 ROUGE-3 Average_P: 0.52748 (95%-conf.int. 0.31095 - 0.76429) 11 ROUGE-3 Average_F: 0.55747 (95%-conf.int. 0.34470 - 0.78985)
---11 ROUGE-4 Average_R: 0.46413 (95%-conf.int. 0.20000 - 0.76667) 11 ROUGE-4 Average_P: 0.42445 (95%-conf.int. 0.16000 - 0.71333) 11 ROUGE-4 Average_F: 0.43933 (95%-conf.int. 0.17500 - 0.73333)
---11 ROUGE-L Average_R: 0.56185 (95%-conf.int. 0.42162 - 0.71773) 11 ROUGE-L Average_P: 0.70494 (95%-conf.int. 0.55714 - 0.85833) 11 ROUGE-L Average_F: 0.60646 (95%-conf.int. 0.47795 - 0.75049)
---11 ROUGE-W-1.2 Average_R: 0.37926 (95%-conf.int. 0.27541 - 0.49500) 11 ROUGE-W-1.2 Average_P: 0.65106 (95%-conf.int. 0.49107 - 0.82321) 11 ROUGE-W-1.2 Average_F: 0.46368 (95%-conf.int. 0.34814 - 0.59179)
---11 ROUGE-S* Average_R: 0.66482 (95%-conf.int. 0.47238 - 0.85524) 11 ROUGE-S* Average_P: 0.53184 (95%-conf.int. 0.32500 - 0.75000) 11 ROUGE-S* Average_F: 0.57648 (95%-conf.int. 0.37678 - 0.78848)
---11 ROUGE-SU* Average_R: 0.71369 (95%-conf.int. 0.53984 - 0.88286) 11 ROUGE-SU* Average_P: 0.57277 (95%-conf.int. 0.38142 - 0.78056) 11 ROUGE-SU* Average_F: 0.62202 (95%-conf.int. 0.43843 - 0.81393) A.2 CBS ROUGE Result
---11 ROUGE-1 Average_R: 0.76663 (95%-conf.int. 0.63762 - 0.89333) 11 ROUGE-1 Average_P: 0.67857 (95%-conf.int. 0.53214 - 0.84286)
11 ROUGE-1 Average_F: 0.71577 (95%-conf.int. 0.57970 - 0.86190)
---11 ROUGE-2 Average_R: 0.70201 (95%-conf.int. 0.54667 - 0.86333) 11 ROUGE-2 Average_P: 0.61664 (95%-conf.int. 0.43809 - 0.80762) 11 ROUGE-2 Average_F: 0.65163 (95%-conf.int. 0.48667 - 0.83636)
---11 ROUGE-3 Average_R: 0.60484 (95%-conf.int. 0.39167 - 0.82833) 11 ROUGE-3 Average_P: 0.53236 (95%-conf.int. 0.31917 - 0.76250) 11 ROUGE-3 Average_F: 0.56079 (95%-conf.int. 0.35098 - 0.79039)
---11 ROUGE-4 Average_R: 0.46413 (95%-conf.int. 0.20000 - 0.76667) 11 ROUGE-4 Average_P: 0.42445 (95%-conf.int. 0.16000 - 0.71333) 11 ROUGE-4 Average_F: 0.43933 (95%-conf.int. 0.17500 - 0.73333)
---11 ROUGE-L Average_R: 0.54120 (95%-conf.int. 0.39743 - 0.70309) 11 ROUGE-L Average_P: 0.67857 (95%-conf.int. 0.53214 - 0.84286) 11 ROUGE-L Average_F: 0.58289 (95%-conf.int. 0.44879 - 0.72838)
---11 ROUGE-W-1.2 Average_R: 0.39129 (95%-conf.int. 0.28736 - 0.50728) 11 ROUGE-W-1.2 Average_P: 0.67325 (95%-conf.int. 0.52159 - 0.83758) 11 ROUGE-W-1.2 Average_F: 0.47857 (95%-conf.int. 0.36753 - 0.60219)
---11 ROUGE-S* Average_R: 0.60686 (95%-conf.int. 0.40381 - 0.81667) 11 ROUGE-S* Average_P: 0.49785 (95%-conf.int. 0.28373 - 0.74167) 11 ROUGE-S* Average_F: 0.53466 (95%-conf.int. 0.32789 - 0.76667)
---11 ROUGE-SU* Average_R: 0.66706 (95%-conf.int. 0.48421 - 0.84841) 11 ROUGE-SU* Average_P: 0.54722 (95%-conf.int. 0.34603 - 0.76429) 11 ROUGE-SU* Average_F: 0.58952 (95%-conf.int. 0.40240 - 0.79922) A.3 BASIC ROUGE Configuration File
<ROUGE-EVAL version=‘‘1.0’’> <EVAL ID=‘‘1’’> <PEER-ROOT> ./Yioop-testBasic/systemsAreGenerated </PEER-ROOT> <MODEL-ROOT> ./Yioop-testBasic/modelsAreHuman </MODEL-ROOT> <INPUT-FORMAT TYPE=‘‘SEE’’> </INPUT-FORMAT> <PEERS> <P ID=‘‘11’’> AgiletaskslistswhatdoesdonemeaninAgileCS200WBlog.html</P>
</PEERS> <MODELS> <M ID=‘‘A’’> AgiletaskslistswhatdoesdonemeaninAgilCS200WBlog.html</M> </MODELS> </EVAL> <EVAL ID=‘‘2’’> <PEER-ROOT> ./Yioop-testBasic/systemsAreGenerated </PEER-ROOT> <MODEL-ROOT> ./Yioop-testBasic/modelsAreHuman </MODEL-ROOT> <INPUT-FORMAT TYPE=‘‘SEE’’> </INPUT-FORMAT> <PEERS> <P ID=‘‘11’’> DeliveringaprojectandpresentingtoamultilevelaudienceCS200WBlog.html</P> </PEERS> <MODELS> <M ID=‘‘A’’> DeliveringaprojectandpresentingtoamultilevelaudienceCS200WBlog.html</M> </MODELS> </EVAL> <EVAL ID=‘‘3’’> <PEER-ROOT> ./Yioop-testBasic/systemsAreGenerated </PEER-ROOT> <MODEL-ROOT> ./Yioop-testBasic/modelsAreHuman </MODEL-ROOT> <INPUT-FORMAT TYPE=‘‘SEE’’> </INPUT-FORMAT> <PEERS> <P ID=‘‘11’’> HandingoffaprojecttoaclientwhataretherisksandchallengesCS20.html</P> </PEERS> <MODELS> <M ID=‘‘A’’> HandingoffaprojecttoaclientwhataretherisksandchallengesCS20.html</M> </MODELS> </EVAL> <EVAL ID=‘‘4’’> <PEER-ROOT> ./Yioop-testBasic/systemsAreGenerated </PEER-ROOT> <MODEL-ROOT>
./Yioop-testBasic/modelsAreHuman </MODEL-ROOT> <INPUT-FORMAT TYPE=‘‘SEE’’> </INPUT-FORMAT> <PEERS> <P ID=‘‘11’’> LinkedInprofileshowtousethemhowtomarketyourselfhowtonetwork.html</P> </PEERS> <MODELS> <M ID=‘‘A’’> LinkedInprofileshowtousethemhowtomarketyourselfhowtonetwork.html</M> </MODELS> </EVAL> <EVAL ID=‘‘5’’> <PEER-ROOT> ./Yioop-testBasic/systemsAreGenerated </PEER-ROOT> <MODEL-ROOT> ./Yioop-testBasic/modelsAreHuman </MODEL-ROOT> <INPUT-FORMAT TYPE=‘‘SEE’’> </INPUT-FORMAT> <PEERS> <P ID=‘‘11’’> SocialMediaandBrandingCS200WBlog.html</P> </PEERS> <MODELS> <M ID=‘‘A’’> SocialMediaandBrandingCS200WBlog.html</M> </MODELS> </EVAL> <EVAL ID=‘‘6’’> <PEER-ROOT> ./Yioop-testBasic/systemsAreGenerated </PEER-ROOT> <MODEL-ROOT> ./Yioop-testBasic/modelsAreHuman </MODEL-ROOT> <INPUT-FORMAT TYPE=‘‘SEE’’> </INPUT-FORMAT> <PEERS> <P ID=‘‘11’’> TheAgileTeamandwhatisaBacklogWhataretheyforandwhyaretheyimp.html</P> </PEERS> <MODELS> <M ID=‘‘A’’> TheAgileTeamandwhatisaBacklogWhataretheyforandwhyaretheyimp.html</M>
</MODELS> </EVAL> <EVAL ID=‘‘7’’> <PEER-ROOT> ./Yioop-testBasic/systemsAreGenerated </PEER-ROOT> <MODEL-ROOT> ./Yioop-testBasic/modelsAreHuman </MODEL-ROOT> <INPUT-FORMAT TYPE=‘‘SEE’’> </INPUT-FORMAT> <PEERS> <P ID=‘‘11’’> WhatfivetechnicalskillsareemployersseekingWhatfivesoftskillsput.html</P> </PEERS> <MODELS> <M ID=‘‘A’’> WhatfivetechnicalskillsareemployersseekingWhatfivesoftskillsput.html</M> </MODELS> </EVAL> <EVAL ID=‘‘8’’> <PEER-ROOT> ./Yioop-testBasic/systemsAreGenerated </PEER-ROOT> <MODEL-ROOT> ./Yioop-testBasic/modelsAreHuman </MODEL-ROOT> <INPUT-FORMAT TYPE=‘‘SEE’’> </INPUT-FORMAT> <PEERS> <P ID=‘‘11’’> WhatisAgileandwhatareuserstoriesCS200WBlog.html</P> </PEERS> <MODELS> <M ID=‘‘A’’> WhatisAgileandwhatareuserstoriesCS200WBlog.html</M> </MODELS> </EVAL> <EVAL ID=‘‘9’’> <PEER-ROOT> ./Yioop-testBasic/systemsAreGenerated </PEER-ROOT> <MODEL-ROOT> ./Yioop-testBasic/modelsAreHuman </MODEL-ROOT> <INPUT-FORMAT TYPE=‘‘SEE’’> </INPUT-FORMAT> <PEERS>
<P ID=‘‘11’’> WhatisanAgileSprintRetrospectiveAbusylifeofagirlgamer.html</P> </PEERS> <MODELS> <M ID=‘‘A’’> WhatisanAgileSprintRetrospectiveAbusylifeofagirlgamer.html</M> </MODELS> </EVAL> <EVAL ID=‘‘10’’> <PEER-ROOT> ./Yioop-testBasic/systemsAreGenerated </PEER-ROOT> <MODEL-ROOT> ./Yioop-testBasic/modelsAreHuman </MODEL-ROOT> <INPUT-FORMAT TYPE=‘‘SEE’’> </INPUT-FORMAT> <PEERS> <P ID=‘‘11’’> WhatisanAgileSprintRetrospectiveCS200WBlog.html</P> </PEERS> <MODELS> <M ID=‘‘A’’> WhatisanAgileSprintRetrospectiveCS200WBlog.html</M> </MODELS> </EVAL> </ROUGE-EVAL>
A.4 CBS ROUGE Configuration File <ROUGE-EVAL version=‘‘1.0’’> <EVAL ID=‘‘1’’> <PEER-ROOT> ./Yioop-testCentroid/systemsAreGenerated </PEER-ROOT> <MODEL-ROOT> ./Yioop-testCentroid/modelsAreHuman </MODEL-ROOT> <INPUT-FORMAT TYPE=‘‘SEE’’> </INPUT-FORMAT> <PEERS> <P ID=‘‘11’’> AgiletaskslistswhatdoesdonemeaninAgileCS200WBlog.html</P> </PEERS> <MODELS> <M ID=‘‘A’’> AgiletaskslistswhatdoesdonemeaninAgilCS200WBlog.html</M>
</MODELS> </EVAL> <EVAL ID=‘‘2’’> <PEER-ROOT> ./Yioop-testCentroid/systemsAreGenerated </PEER-ROOT> <MODEL-ROOT> ./Yioop-testCentroid/modelsAreHuman </MODEL-ROOT> <INPUT-FORMAT TYPE=‘‘SEE’’> </INPUT-FORMAT> <PEERS> <P ID=‘‘11’’> DeliveringaprojectandpresentingtoamultilevelaudienceCS200WBlog.html</P> </PEERS> <MODELS> <M ID=‘‘A’’> DeliveringaprojectandpresentingtoamultilevelaudienceCS200WBlog.html</M> </MODELS> </EVAL> <EVAL ID=‘‘3’’> <PEER-ROOT> ./Yioop-testCentroid/systemsAreGenerated </PEER-ROOT> <MODEL-ROOT> ./Yioop-testCentroid/modelsAreHuman </MODEL-ROOT> <INPUT-FORMAT TYPE=‘‘SEE’’> </INPUT-FORMAT> <PEERS> <P ID=‘‘11’’> HandingoffaprojecttoaclientwhataretherisksandchallengesCS20.html</P> </PEERS> <MODELS> <M ID=‘‘A’’> HandingoffaprojecttoaclientwhataretherisksandchallengesCS20.html</M> </MODELS> </EVAL> <EVAL ID=‘‘4’’> <PEER-ROOT> ./Yioop-testCentroid/systemsAreGenerated </PEER-ROOT> <MODEL-ROOT> ./Yioop-testCentroid/modelsAreHuman </MODEL-ROOT> <INPUT-FORMAT TYPE=‘‘SEE’’> </INPUT-FORMAT> <PEERS>
<P ID=‘‘11’’> LinkedInprofileshowtousethemhowtomarketyourselfhowtonetwork.html</P> </PEERS> <MODELS> <M ID=‘‘A’’> LinkedInprofileshowtousethemhowtomarketyourselfhowtonetwork.html</M> </MODELS> </EVAL> <EVAL ID=‘‘5’’> <PEER-ROOT> ./Yioop-testCentroid/systemsAreGenerated </PEER-ROOT> <MODEL-ROOT> ./Yioop-testCentroid/modelsAreHuman </MODEL-ROOT> <INPUT-FORMAT TYPE=‘‘SEE’’> </INPUT-FORMAT> <PEERS> <P ID=‘‘11’’> SocialMediaandBrandingCS200WBlog.html</P> </PEERS> <MODELS> <M ID=‘‘A’’> SocialMediaandBrandingCS200WBlog.html</M> </MODELS> </EVAL> <EVAL ID=‘‘6’’> <PEER-ROOT> ./Yioop-testCentroid/systemsAreGenerated </PEER-ROOT> <MODEL-ROOT> ./Yioop-testCentroid/modelsAreHuman </MODEL-ROOT> <INPUT-FORMAT TYPE=‘‘SEE’’> </INPUT-FORMAT> <PEERS> <P ID=‘‘11’’> TheAgileTeamandwhatisaBacklogWhataretheyforandwhyaretheyimp.html</P> </PEERS> <MODELS> <M ID=‘‘A’’> TheAgileTeamandwhatisaBacklogWhataretheyforandwhyaretheyimp.html</M> </MODELS> </EVAL> <EVAL ID=‘‘7’’> <PEER-ROOT>
./Yioop-testCentroid/systemsAreGenerated </PEER-ROOT> <MODEL-ROOT> ./Yioop-testCentroid/modelsAreHuman </MODEL-ROOT> <INPUT-FORMAT TYPE=‘‘SEE’’> </INPUT-FORMAT> <PEERS> <P ID=‘‘11’’> WhatfivetechnicalskillsareemployersseekingWhatfivesoftskillsput.html</P> </PEERS> <MODELS> <M ID=‘‘A’’> WhatfivetechnicalskillsareemployersseekingWhatfivesoftskillsput.html</M> </MODELS> </EVAL> <EVAL ID=‘‘8’’> <PEER-ROOT> ./Yioop-testCentroid/systemsAreGenerated </PEER-ROOT> <MODEL-ROOT> ./Yioop-testCentroid/modelsAreHuman </MODEL-ROOT> <INPUT-FORMAT TYPE=‘‘SEE’’> </INPUT-FORMAT> <PEERS> <P ID=‘‘11’’> WhatisAgileandwhatareuserstoriesCS200WBlog.html</P> </PEERS> <MODELS> <M ID=‘‘A’’> WhatisAgileandwhatareuserstoriesCS200WBlog.html</M> </MODELS> </EVAL> <EVAL ID=‘‘9’’> <PEER-ROOT> ./Yioop-testCentroid/systemsAreGenerated </PEER-ROOT> <MODEL-ROOT> ./Yioop-testCentroid/modelsAreHuman </MODEL-ROOT> <INPUT-FORMAT TYPE=‘‘SEE’’> </INPUT-FORMAT> <PEERS> <P ID=‘‘11’’> WhatisanAgileSprintRetrospectiveAbusylifeofagirlgamer.html</P> </PEERS> <MODELS>
<M ID=‘‘A’’> WhatisanAgileSprintRetrospectiveAbusylifeofagirlgamer.html</M> </MODELS> </EVAL> <EVAL ID=‘‘10’’> <PEER-ROOT> ./Yioop-testCentroid/systemsAreGenerated </PEER-ROOT> <MODEL-ROOT> ./Yioop-testCentroid/modelsAreHuman </MODEL-ROOT> <INPUT-FORMAT TYPE=‘‘SEE’’> </INPUT-FORMAT> <PEERS> <P ID=‘‘11’’> WhatisanAgileSprintRetrospectiveCS200WBlog.html</P> </PEERS> <MODELS> <M ID=‘‘A’’> WhatisanAgileSprintRetrospectiveCS200WBlog.html</M> </MODELS> </EVAL> </ROUGE-EVAL> A.5 Human Generated Input
<html> <head> <title> AgiletaskslistswhatdoesdonemeaninAgilCS200WBlog</title> </head> <body bgcolor=‘‘white’’>
<a name=‘‘1’’>[1]</a><a href=‘‘#1’’ id=1>Agile tasks lists, what does done </a>
<a name=‘‘2’’>[2]</a><a href=‘‘#2’’ id=2>In life just as at work, you may have had someone ask you the dreaded question Are you done yet?</a>
<a name=‘‘3’’>[3]</a><a href=‘‘#3’’ id=3>That is why to ensure transparency and improve quality in an agile environment, the definition of done (DoD) must be clearly defined and have a consensus among the team.</a>
<a name=‘‘4’’>[4]</a><a href=‘‘#4’’ id=4>We will walk through what the DoD is, an example of how to create a DoD and what value it brings to the sprint cycle.</a>
<a name=‘‘5’’>[5]</a><a href=‘‘#5’’ id=5>According to the Agile Alliance and Institute (2014) the DoD is a list of criteria which must be met before a product increment often a user story is considered done. </a>
<a name=‘‘6’’>[6]</a><a href=‘‘#6’’ id=6>The most important feature of the DoD is it keeps hidden work or scope creep from happening.</a>
<a name=‘‘7’’>[7]</a><a href=‘‘#7’’ id=7>The DoD gets iteratively worked just like the user stories within each sprint. According to Scrum.org (2013), the Definition of Done is not changed during a Sprint, but should change periodically between Sprints to reflect improvements the Development Team has made in its processes and capabilities to deliver software.</a>
<a name=‘‘8’’>[8]</a><a href=‘‘#8’’ id=8>Moreover, you will find the risk is reduced, teams are more focused, and communication between the client is
better.</a>
<a name=‘‘9’’>[9]</a><a href=‘‘#9’’ id=9>By making the DoD a way of life and committing to exceptional work, the client will be able to visualize what
complete really is. </a> </body>
</html>
A.6 System Generated Input <html><head>
<title>AgiletaskslistswhatdoesdonemeaninAgileCS200WBlog </title> </head>
<body bgcolor=‘‘white’’>
<a name=‘‘1’’>[1]</a><a href=‘‘#1’’ id=1>Agile tasks lists, what does done mean in Agile? | CS200W Blog</a>
<a name=‘‘2’’>[2]</a><a href=‘‘#2’’ id=2>In life just as at work, you may have had someone ask you the dreaded question Are you done yet?</a>
<a name=‘‘3’’>[3]</a><a href=‘‘#3’’ id=3>In life outside of work, we can consult our own minds to make the determination if something is done or not.</a>
<a name=‘‘4’’>[4]</a><a href=‘‘#4’’ id=4>In an agile work environment you are most likely not the only one involved in making that decision.</a>
<a name=‘‘5’’>[5]</a><a href=‘‘#5’’ id=5>Everyones opinion on what done means may vary.</a>
<a name=‘‘6’’>[6]</a><a href=‘‘#6’’ id=6>That is why to ensure transparency and improve quality in an agile environment, the definition of done (DoD) must be clearly defined and have a consensus among the team.</a>
<a name=‘‘7’’>[7]</a><a href=‘‘#7’’ id=7>We will walk through what the DoD is, an example of how to create a DoD and what value it brings to the sprint cycle.</a>
<a name=‘‘8’’>[8]</a><a href=‘‘#8’’ id=8>.. CS200W Blog</a>
<a name=‘‘9’’>[9]</a><a href=‘‘#9’’ id=9>powered by Charles Bocage</a> <a name=‘‘10’’>[10]</a><a href=‘‘#10’’ id=10>CS200W Blog </a>
<a name=‘‘11’’>[11]</a><a href=‘‘#11’’ id=11>Facebook</a> <a name=‘‘12’’>[12]</a><a href=‘‘#12’’ id=12>CS200W Blog </a>
<a name=‘‘13’’>[13]</a><a href=‘‘#13’’ id=13>Twitter</a> <a name=‘‘14’’>[14]</a><a href=‘‘#14’’ id=14>CS200W Blog</a> <a name=‘‘15’’>[15]</a><a href=‘‘#15’’ id=15>YouTube</a> <a name=‘‘16’’>[16]</a><a href=‘‘#16’’ id=16>Search</a> <a name=‘‘17’’>[17]</a><a href=‘‘#17’’ id=17>Home Agile</a>
<a name=‘‘18’’>[18]</a><a href=‘‘#18’’ id=18>Project Management</a> <a name=‘‘19’’>[19]</a><a href=‘‘#19’’ id=19>Social Media</a>
<a name=‘‘20’’>[20]</a><a href=‘‘#20’’ id=20>Skills</a> <a name=‘‘21’’>[21]</a><a href=‘‘#21’’ id=21>About Me</a> <a name=‘‘22’’>[22]</a><a href=‘‘#22’’ id=22>Contact</a>
<a name=‘‘23’’>[23]</a><a href=‘‘#23’’ id=23>First lets get the definition of done out of the way.</a>
<a name=‘‘24’’>[24]</a><a href=‘‘#24’’ id=24>According to the Agile Alliance and Institute (2014) the DoD is a list of criteria which must be met before a product increment often a user story is considered done.</a>
<a name=‘‘25’’>[25]</a><a href=‘‘#25’’ id=25>In other words, it is the acceptance criteria the work must pass to be evaluated as complete.</a>
<a name=‘‘26’’>[26]</a><a href=‘‘#26’’ id=26>It can be in the form of a Done List or a Done Checklist.</a>
<a name=‘‘27’’>[27]</a><a href=‘‘#27’’ id=27>There is no preference on what it is called because they both produce the same results.</a>
<a name=‘‘28’’>[28]</a><a href=‘‘#28’’ id=28>.. CS200W Blog</a> <a name=‘‘29’’>[29]</a><a href=‘‘#29’’ id=29>powered by Charles Bocage</a>
<a name=‘‘30’’>[30]</a><a href=‘‘#30’’ id=30>CS200W Blog</a> <a name=‘‘31’’>[31]</a><a href=‘‘#31’’ id=31>Facebook</a> <a name=‘‘32’’>[32]</a><a href=‘‘#32’’ id=32>CS200W Blog</a> <a name=‘‘33’’>[33]</a><a href=‘‘#33’’ id=33>Twitter</a> <a name=‘‘34’’>[34]</a><a href=‘‘#34’’ id=34>CS200W Blog</a> <a name=‘‘35’’>[35]</a><a href=‘‘#35’’ id=35>YouTube</a> <a name=‘‘36’’>[36]</a><a href=‘‘#36’’ id=36>Search</a> <a name=‘‘37’’>[37]</a><a href=‘‘#37’’ id=37>Home Agile</a>
<a name=‘‘38’’>[38]</a><a href=‘‘#38’’ id=38>Project Management</a> <a name=‘‘39’’>[39]</a><a href=‘‘#39’’ id=39>Social Media</a>
<a name=‘‘40’’>[40]</a><a href=‘‘#40’’ id=40>Skills</a> <a name=‘‘41’’>[41]</a><a href=‘‘#41’’ id=41>About Me</a> <a name=‘‘42’’>[42]</a><a href=‘‘#42’’ id=42>Contact</a> </body>