For more information,
please visit our website at http://ebusiness.mit.edu
A research and education initiative at the MIT Sloan School of Management
Intelligent Assistance for the Data Mining Process:
An Ontology-based Approach
Paper 151
Abraham Bernstein Foster Provost Shawndra HillApril 2002
Intelligent Assistance for the Data Mining Process:
An Ontology-based Approach
Abraham Bernstein, Foster Provost, and Shawndra Hill
{bernstein, fprovost, shill}@stern.nyu.edu
Department of Information, Operations, and Management Sciences Leonard Stern School of Business
New York University
Abstract
A data mining (DM) process involves multiple stages. A simple, but typical, process might include preprocessing data, applying a data-mining algorithm, and postprocessing the mining results. There are many possible choices for each stage, and only some combinations are valid. Because of the large space and non-trivial interactions, both novices and data-mining specialists need assistance in composing and selecting DM processes. We present the concept of Intelligent Discovery Assistants (IDAs), which provide users with (i) systematic enumerations of valid DM processes, in order that important, potentially fruitful options are not overlooked, and (ii) effective rankings of these valid processes by different criteria, to facilitate the choice of DM processes to execute. We use a proto-type to show that an IDA can indeed provide useful enumerations and effective rankings. We dis-cuss how an IDA is an important tool for knowledge sharing among a team of data miners. Finally, we illustrate all the claims with a comprehensive demonstration using a more involved process and data from the 1998 KDDCUP competition.
Index Terms
Data-mining, data-mining process, intelligent assistants, knowledge discovery
1
Introduction
1Knowledge discovery from data is the result of an exploratory process involving the application of vari-ous algorithmic procedures for manipulating data, building models from data, and manipulating the mod-els. The Knowledge Discovery (KD) process [Fayyad, Piatetsky-Shapiro & Smyth, 1996] is one of the central notions of the field of Knowledge Discovery and Data mining (KDD). The KD process deserves more attention from the research community. One reason is that processes comprise multiple algorithmic components, which interact in non-trivial ways. Even data-mining specialists are not familiar with the full range of components, let alone the vast design space of possible processes. Therefore, both novices and data-mining specialists are apt to overlook useful instances of the KD process. We consider tools that will help data miners to navigate the space of KD processes more systematically, and more effec-tively. In particular, this paper focuses on a subset of stages of the KD process—those stages for which there are multiple algorithm components that can apply; we will this a data mining (DM) process (to distinguish it from the larger knowledge discovery process). For most of this paper, we consider a proto-typical DM process template, similar to the one described by Fayyad et al. [1996] and [Chapman et al., 2000], which is shown in Figure 1. We concentrate our work here on three DM-process stages: auto-mated preprocessing of data, application of induction algorithms, and autoauto-mated post-processing of mod-els. We have chosen this set of steps because, individually, they are relatively well understood—and
they can be applied to a wide variety of benchmark data sets.2 In the final case study, we expand our
view to a more involved DM process.
Induction Algorithm ... ... ... ... ... ... Model/ Patterns Knowledge Post-processing/ Interpretation Preprocessed Data Pre-processing Data Selection Target Data
Figure 1: The KD process (adapted from Fayad et al. [1996])
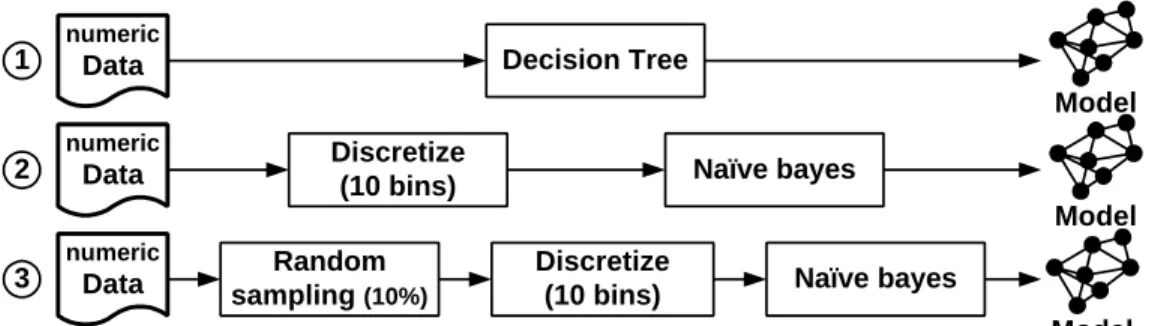
Figure 2 shows three simple, example DM processes.3 Process 1 comprises simply the application of a
decision-tree inducer. Process 2 preprocesses the data by applying discretization of numeric attributes,
2
More generally, because we will assemble these components automatically into complete processes that can be executed by a user, the scope of our investigation is necessarily limited to KD-process stages for which there exist automated components, and for which their requirements and functions can be specified. Important but ill-understood stages such as “business process analy-sis” or “management of discovered knowledge” are not included [Senator, 2000]. We also do not consider intelligent support for more open-ended, statistical/exploratory data analysis, as has been addressed by St. Amant and Cohen [St. Amant & Cohen, 1998].
3
and then builds a naïve Bayesian classifier. Process 3 preprocesses the data first by taking a random subsample, then applies discretization, and then builds a naïve Bayesian classifier.
Decision Tree Naïve bayes Naïve bayes Discretize (10 bins) Random sampling (10%) Discretize (10 bins) 1 2 3 Model Model Model numeric Data numeric Data numeric Data
Figure 2: Three valid DM processes
Intelligent Discovery Assistants (IDAs) help data miners with the exploration of the space of valid DM processes. A valid DM process violates no fundamental constraints of its constituent techniques. For example, if the input data set contains numeric attributes, simply applying naïve Bayes is not a valid DM process (because naïve Bayes applies only to categorical attributes). However, Process 2 is valid, be-cause it preprocesses the data with a discretization routine, transforming the numeric attributes to cate-gorical ones. IDAs rely on an explicit ontology of knowledge discovery techniques. For our purposes, the DM ontology defines the existing techniques and their properties. Given such an ontology, an IDA can perform a search of the space of valid processes, considering techniques to be operators that change the world state, with preconditions that constrain their applicability. Figure 3 shows some (simplified) ontology entries (cf., Figure 2).
Machine Learning Operators
Feature Selection Preconditions: Continuous Data Incompatibilites: <none> Effects: Categorical Data Heuristic Indicators: Speed = x * 2 ... Random Sampling Preconditions: Continuous Data Incompatibilites: <none> Effects: Categorical Data Heuristic Indicators: Speed = x * 2 ... Pre-Processing Discretize Preconditions: Continuous Data Incompatibilites: <none> Effects: Categorical Data Heuristic Indicators: Speed = x * 2 ... C4.5 Preconditions: <none> Incompatibilites: op(Naïve bayes) Effects:
Class Probability Estimator Heuristic Indicators: Speed = x * 2 ... Rule Learner Preconditions: <none> Incompatibilites: op(Naïve bayes) Effects:
Class Probability Estimator Heuristic Indicators: Speed = x * 2 ... Induction Algorithm Naïve bayes Preconditions: Not(Continuous Data) Not(Has missing values)
Incompatibilites:
op(classifier) Effects:
Class Probability Estimator Heuristic Indicators: Speed = 40 ... CPE-Threshholding Preconditions: Continuous Data Incompatibilites: <none> Effects: Categorical Data Heuristic Indicators: Speed = x * 2 ... Rule Pruning Preconditions: Continuous Data Incompatibilites: <none> Effects: Categorical Data Heuristic Indicators: Speed = x * 2 ... Post-Processing Tree Pruning Preconditions: Tree Incompatibilites: <none> Effects:
Model Size small Heuristic Indicators:
Speed = x / 2 ...
Figure 3: Simplified elements of a DM ontology
Above we said that an IDA helps a data miner. More specifically, an IDA determines characteristics of
the desired result from the given data. Then the IDA provides the user assistance in choosing processes to execute, by, for example, ranking the process (heuristically) according to what is important to the user. Results should be ranked differently for different users. The ranking in Figure 2 is based on the number of techniques that form the plan. If the user were interested in minimizing fuss, this ranking would be a useful suggestion. A different user may want to minimize run time, e.g., to get some results quickly. In that case, the reverse of the ranking shown in Figure 2 would be appropriate. There are many other rank-ing criteria: accuracy, cost sensitivity, comprehensibility, etc., and many combinations thereof.
In this paper, we claim that IDAs can provide users with three benefits:
1. a systematic enumeration of valid DM processes, so they do not miss important, potentially fruitful options;
2. effective rankings of these valid processes by different criteria, to help them choose between the options;
3. an infrastructure for sharing DM knowledge, which leads to what economists call network exter-nalities.
We support the first claim by presenting in detail the design of effective IDAs, including a working prototype, describing how valid plans are enumerated based on an ontology that specifies the characteris-tics of the various components. We then show plans that the prototype produces, and argue that they would be useful not only to novices, but even to expert data miners. We provide support for the second claim with an experimental study, using ranking heuristics. Although we do not claim to give an in-depth treatment of ranking methods, we demonstrate the ability of the IDA prototype to rank potential proc-esses by speed and by accuracy (both of which can be assessed objectively). We also demonstrate that an IDA can perform along the tradeoff spectrum between speed and accuracy. Finally, we provide addi-tional support for all the claims with an empirical demonstration, using the KDDCUP 1998 data-mining problem, showing how an IDA can take advantage of knowledge about a problem-specific DM process, and we discuss how the insertion of such knowledge could improve the performance of a data-mining team. In summary, for most of the paper we use simple processes, such as those presented in Figure 2, to provide support for our claims. Section 6 goes into more depth (but less breadth) with a particular, more complex process.
2
Motivation and General Procedure
It has been argued that when engaged in design activities, people rarely explore the entire design space [Ulrich and Eppinger, 1995, p. 79]. There is evidence that when confronted with a new problem, data miners, even data mining experts, do not explore the design space of DM processes thoroughly. For
ex-ample, the ACM SIGKDD International Conference on Knowledge Discovery and Data Mining holds an annual competition, in which a never-before-seen data set is released to the community, and teams of researchers and practitioners compete to discover the “best” knowledge (evaluated differently each year). KDDCUP-2000 received 30 entrants (teams) attempting to mine knowledge from electronic-commerce data. As reported by Brodley and Kohavi [Brodley & Kohavi, 2000], most types of data-mining algo-rithm were tried by only a small fraction of participants.
There are several reasons why even expert data miners would ignore the vast majority of approaches. They may not have access to the tools; however, readily (and freely) available data-mining toolkits make this reason suspect. More likely, even experts are facile with only a small set of tools. This is increas-ingly the case for tools that require additional pre- and post-processing. Indeed, the only algorithm that was tried by more than 20% of the KDDCUP-2000 participants was decision-tree induction, which per-forms reasonably well on a wide variety of data with little pre- and post-processing (cf., Figure 2).
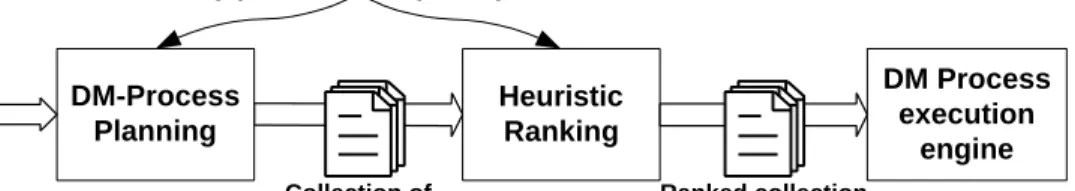
An Intelligent Discovery Assistant (IDA) helps a user to explore the space of valid knowledge discov-ery processes, expanding the portion of the space that they consider. The overall meta-process followed by an IDA is shown in Figure 4. An IDA interacts with the user to obtain data, metadata, goals and desid-erata. Then it composes the set of valid DM processes, according to the constraints implied by the user inputs, the data, and/or the ontology. This composition involves choosing induction algorithm(s), and appropriate pre- and post-processing modules (as well as other aspects of the process, not considered in this paper). Next, the IDA ranks the suitable processes into a suggested order based on the user's desid-erata. The user can select plans from the suggestion list, hopefully aided by the ranking. Finally, the IDA will produce code for and can execute (automatically) the suggested processes on the selected data.
Task Specification (includes raw-data) DM-Process Planning Ontology (operator descriptions) Heuristic Ranking DM Process execution engine Ranked collection of valid DM processes Collection of valid DM processes
Figure 4: The overall process followed by an IDA
3
Enumerating Valid Data Mining Processes
Our first claim is that ontology-based IDAs can enumerate DM processes useful to a data miner. We support our claim in two ways. First, we describe how the ontology can enable the composition of only
valid plans. Second, we describe process instances produced by our prototype (IDEA), in order to pro-vide epro-vidence that they can be non-trivial. Later we will describe how problem-specific elements can be incorporated into IDAs; for clarity and generality first we concentrate on domain-independent elements of the DM process. For example, when presented with a data set to mine, a knowledge-discovery worker (researcher or practitioner) generally is faced with a confusing array of choices [Witten & Frank, 2000]: should I use C4.5 or naive Bayes or a neural network? Should I use discretization? If so, what method? Should I subsample? Should I prune? How do I take into account costs of misclassification?
3.1 Ontology-based Intelligent Discovery Assistants
Consider a straightforward example: a user presents a large data set, including both numeric and
cate-gorical data, and specifies classification as the learning task (along with the appropriate dependent
vari-able). The IDA asks the user to specify his/her desired tradeoffs between accuracy and speed of learning (these are just two possible desiderata). Then the IDA determines, of all the possible DM processes, which are appropriate. With a small ontology, there might be few; with a large ontology there might be many. For our example task, decision-tree learning alone might be appropriate. Or, a decision-tree pro-gram plus subsampling as a pre-process, or plus pruning as a post-process, or plus both. Are naive Bayes or neural networks appropriate for this example? Not by themselves. Naive Bayes only takes categorical attributes. Neural networks only take numeric attributes. However, a DM process with appropriate pre-processing may include them (transforming the data type), and may fare better than the decision tree. What if the user is willing to trade some accuracy to get results faster?
The IDA uses the ontology to assist the user in composing valid and useful DM processes. In the pro-totype, for each operator the ontology contains:
• A specification of the conditions under which the operator can be applied, involving a
pre-condition on the state of the DM process as well as its compatibility with preceding operators.
• A specification of the operator’s effects on the DM process’s state and on the data.
• Estimations of the operator’s effects on attributes such as speed, accuracy, model
comprehensi-bility, etc.
• Logical groups, which can be used to narrow the set of operators to be considered at each stage
of the DM process.
• Predefined schemata for generic problems such as target marketing.
• A help function to obtain comprehensible information about each of the operators.
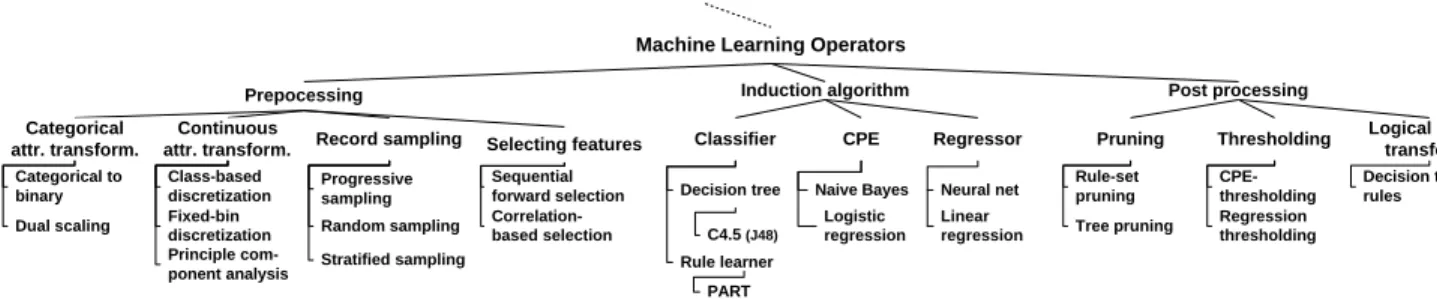
Figure 5 shows a structural view of the prototype ontology, which groups the DM operators into three major groups: pre-processing, induction, post-processing. Each of these groups is further sub-divided. At the leaves of this tree are the actual operators (not shown in the figure, except for two examples: C4.5,
PART). Specifically important for the empirical demonstrations below, the induction algorithm group is subdivided into classifiers, class probability estimators (CPEs), and regressors. Classifiers are further grouped into decision trees and rule learners; the former includes C4.5 [Quinlan, 1993] and the latter includes PART [Frank & Witten, 1998].
Figure 5: The Data-mining Ontology (partial view)
We have built an prototype IDA, the Intelligent Discovery Electronic Assistant (IDEA), that uses the
ontology-based approach. Following the general framework for IDAs (see Figure 4), IDEA first gathers a
task specification for the DM process, analyzes the data that the user wishes to mine and extracts the relevant meta-data, such as the types of attributes included (e.g., continuous, categorical). Using a GUI, the user then can complement the gathered information with additional knowledge about the data (such as structural attributes IDEA could not derive from the metadata), and can specify the type of informa-tion/model he/she wishes to mine and desired tradeoffs (speed, accuracy, cost sensitivity,
comprehensi-bility, etc.). IDEA’s first core component, the DM-process planner, then searches for DM processes that
are valid given the task specification from within the design space of overall possible DM processes, as defined by the ontology. This is described in Section 3.2.
A collection of valid DM processes typically will contain a series of processes that are undesirable for certain user goals? they make undesirable trade-offs, such as sacrificing too much accuracy to obtain a
model fast, etc. IDEA’s second core component, the heuristic ranker, ranks the valid DM processes using
a one of several possible heuristic functions. The user’s trade-off preferences are defined by weights entered through the GUI. Process ranking is treated in detail in Section 4. IDEA’s GUI allows the user to sort the list of plans using any of the rankings (including a combined ranking derived from applying weights on the different characteristics), to examine the details of any process plan, and to generate code for and to run the process.
3.2 Enumerating Valid DM Processes: IDEA’s procedure
Our first claim is that IDAs produce a systematic enumeration of DM processes that will be useful to data miners, and will keep them from overlooking important process instances. The general
ontology-Machine Learning Operators
Induction algorithm Decision tree C4.5 (J48) Rule learner Logistic regression
Naive Bayes Neural net
Post processing Regression thresholding Decision tree to rules Rule-set pruning Tree pruning CPE-thresholding Prepocessing Progressive sampling Random sampling Stratified sampling Sequential forward selection Correlation-based selection
Classifier CPE Regressor Logical model
transform.
Pruning Thresholding
Record sampling Selecting features
Categorical to binary Dual scaling Categorical attr. transform. Class-based discretization Fixed-bin discretization Principle com-ponent analysis Continuous attr. transform. Linear regression PART
based methodology was outlined above. Now, we will describe the specific procedure used by the proto-type IDEA, and will present some example DM processes enumerated for different DM tasks.
To enumerate (only) valid DM processes, IDEA performs a search of the space of processes defined by the ontology, constrained by the restrictions on operator application defined in the ontology. The struc-ture of the search problem is amenable to more complex, AI-style planning, but so far we have found the search-based approach to be satisfactory. IDEA solves the search problem by constructing a step-by-step specification of DM-operators (i.e., a DM process) that move from the start state (which includes some meta-data description of the data-set) to the goal state (typically a prediction model with some desired properties). Specifically, it starts with an empty process at the start state. At every state it then finds the applicable (or compatible) operators using the compatibilities (essentially the pre-conditions), adds that operator to the partial process that brought it to the current state, and transforms the state using the opera-tors’ effects. From our example above, in order to apply Naïve Bayes, the current state must not contain numeric attributes; this would be the case only after discretization (or some other preprocessing). On the other hand, the planning would not apply discretization twice, because after the first application, the state no longer would contain numeric attributes, and thus the preconditions of discretization no longer would apply. The planner stops pursuing a given process when it has either reached the goal state or some “dead-end” state that will not lead to the goal state.
The central difference from traditional, AI planning techniques is that the algorithm does not stop exe-cuting when it has found a first viable solution, but instead searches for as many valid processes as pos-sible. This approach is appropriate because knowledge discovery is an exploratory undertaking, and users often are not able to express their preferences precisely or completely before seeing possible available alternatives. There is a question of computational efficiency to keep in mind: will it be feasible to gener-ate all possible processes in a reasonable amount of time? Given that the number of DM operators that will be available to an IDA is unlikely to be huge, the time spent planning is unlikely to be problematic. For example, the prototype DM ontology (currently incorporating a few dozen operators) and the current DM-process planner can generate all valid processes (up to several hundred for problems with few con-straints) in less than a second.
The constraints in the ontology are essential. For example, if we use the ontology whose overall
struc-ture is shown in Figure 5, consider the goal of classification, and constrain the search only with the
or-dering of the logical groupings imposed by the prototype ontology (i.e., pre-processing precedes induction which precedes post-processing), the total number of DM process instances is 163,840.
Add-ing the constraints imposed by the pre- and post-conditions of the operators4, IDEA produces 597 valid
Add-ing metadata (e.g., the data set contains numeric attributes) and/or user desiderata (e.g., the user wants cost-sensitive classification) allows the enumeration to be constrained even further.
3.3 Enumerating Valid DM Processes: example enumerations from IDEA
The enumerations of processes produced by IDEA are not trivial. In many cases they would be valu-able not only to novice data miners, but even to experts. As evidence, consider the following processes constructed by IDEA.
Example 1) When IDEA is given the goal of producing a cost-sensitive classifier for a two-class
prob-lem, it produces an enumeration comprising 189 DM processes. The enumeration includes building a
class-probability estimator and setting a cost-specific threshold on the output probability. It includes building a regression model and determining (empirically) an effective threshold on the output score. The enumeration also includes using class-stratified sampling with any classification algorithm (which transforms an error-minimizing classifier into a cost-minimizing classifier). Novice data miners certainly do not consider all these options when approaching a cost-sensitive problem. In fact, we are aware of no single published research paper on cost-sensitive learning that considers one of each of these types of option [Turney, 1996].
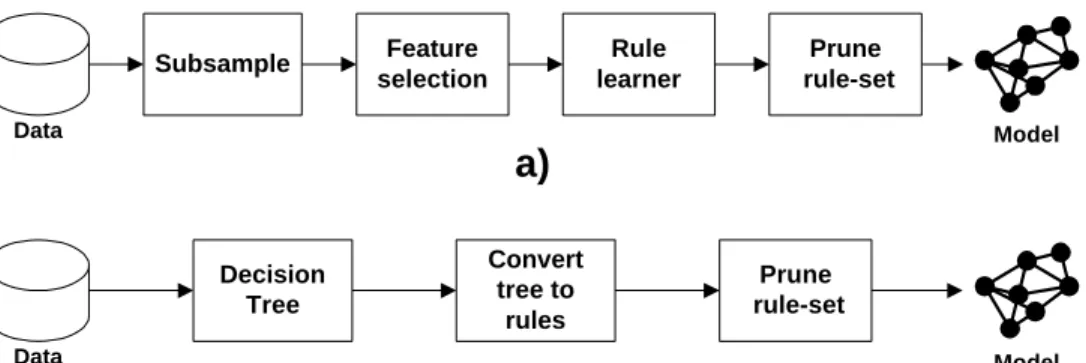
Example 2) When we give IDEA the goal of producing comprehensible classifiers, the top-ranked DM
process5 is: subsample the instances à feature selection à use a rule
learner à prune the resultant rule set (see Figure 6a). Although comprehensibility
is a goal of much machine-learning research, we are not aware of this process being used or suggested. This process is interesting because each component individually has been shown to yield more compre-hensible models; why shouldn’t the composition yield even more comprecompre-hensible models? As another DM process highly ranked by comprehensibility, which in addition has a high accuracy ranking, IDEA
suggests: build a decision tree à convert tree to rules à prune rule set
(see Figure 6b). This also is a non-trivial suggestion: it is the process introduced by Quinlan [1987] and
shown to produce a combination of comprehensibility and high accuracy. Although the addition to the
ontology of convert tree to rules certainly was influenced by Quinlan's work, we did not
"pro-gram" the system to produce this process instance. IDEA composed and ranked processes only based on knowledge of individual operators. This is particularly valuable, because the addition of a new operator to the ontology can have far-reaching effects (e.g., adding in the “convert trees to rules” operator results in this plan being suggested strongly for comprehensible classification).
4
These are not shown here, but are straightforward constraints such as: neural networks require numeric attributes, decision-tree pruning can only apply to decision trees, etc. (see the appendix).
5
We discuss ranking next. Here it is sufficient to understand that these rankings are created by combining scores, included in the ontology, for the different operators that compose a KD process.
b)
a)
Subsample Feature selection Rule learner Prune rule-set Data Decision Tree Convert tree to rules Prune rule-set Data Model ModelFigure 6: Two Plans for producing a comprehensible classifier
Example 3) Consider the case where the user is interested in classification, but wants to get results fast. As described in detail below, IDEA can rank processes quite well by speed, but does the enumera-tion contain particularly useful (fast) processes? Indeed it suggests processes that use fast inducenumera-tion al-gorithms, such as C4.5 (shown to be very fast for memory-resident data, as compared to a wide variety of other induction algorithms [Lim et al., 2000]). It also produces suggestions not commonly considered even by researchers studying scaling up inductive algorithms [Provost & Kolluri, 1999]. For example, the enumeration contains plans that use discretization as a preprocess. Research has shown that discreti-zation as a preprocess can produce classifiers with comparable accuracy to induction without the pre-process [Kohavi & Sahami, 1996]; but with discretization, many induction algorithms run much faster. For example, as described by Provost and Kolluri, most decision tree inducers repeatedly sort numeric attributes, increasing the computational complexity considerably; discretization eliminates the sorting. IDEA’s suggestions of fast plans also include plans that use subsampling as a preprocess. Most re-searchers studying scaling up have not considered subsampling explicitly, but of course it produces clas-sifiers much faster—and for large data sets it has been shown to often produce clasclas-sifiers with comparable accuracies [Oates & Jensen, 1997].
In sum, for a variety of types of tasks, IDEA’s enumerations of DM processes are non-trivial: certainly for novices, and arguably even for expert data miners. In Section 6 we will present an extended example giving further support.
4
IDAs can produce effective rankings
The foregoing section argued that enumerating DM processes systematically is valuable, because it can help data miners to avoid missing important process instances. However, such enumerations can be un-wieldy. It is important not only to produce an enumeration, but also to help the user choose from among the candidate processes. IDAs do this by first enumerating DM processes systematically, and then
rank-ing the resultrank-ing processes by characteristics important to the users (speed, accuracy, model comprehen-sibility, etc.).
Rankings of DM processes can be produced in a variety of ways. For example, static rankings of proc-esses for different criteria could be stored in the system. We believe that flexible rankings also are im-portant—so that as new ontological knowledge is added, the system can take advantage of it immediately. IDEA allows both static rankings and dynamic rankings. In particular, it produces rank-ings dynamically by composing the effects of individual operators. The ontology contains (in the form of scoring functions) estimations of the effects of each operator on each goal. For example, an induction algorithm may be estimated to have a particular speed (relative to the other algorithms). Taking a 10% random sample of the data as a preprocess might be specified to reduce the run time by a factor of 10 (which would be appropriate for algorithms with linear run times). Correspondingly, sampling might be specified to reduce the accuracy by a certain factor (on average), and to increase the comprehensibility by a different factor (cf., the study by Oates and Jensen [1997]). For a given DM process plan, an overall score is produced as the composition of the functions of the component operators.
The systematic enumeration of DM processes allows yet another method for ranking the resulting proc-esses: because the processes are represented explicitly and reasoned about, the system can undertake auto-experimentation to help it produce rankings. Specifically, the system can run its own experiments to determine appropriate rankings by constructing processes, running them, and gathering statistics on their efficacy. Of course, it does not make sense to run a large number of processes to find out which
would give results fast. On the other hand, if accuracy is crucial and speed is not a concern, it may make
sense to run some or all of a process enumeration (e.g., automatically conducting a cross-validation study such as would be performed by an expert data miner).
Our next goal is to provide support for our claim that IDAs can provide useful rankings. We make no claim about what are the best ranking procedures.
4.1 Experiment details
In order to provide a demonstration to support our claim, we implemented a code generator for IDEA that exports any collection of DM processes, which then can be run (automatically). Currently it gener-ates code for the Weka data-mining toolkit [Witten and Frank, 2000], and it genergener-ates Java code for exe-cuting the plans, as well as code for evaluating the resulting models based on accuracy and speed of learning. We chose to assess IDEA’s ability to rank processes by speed and by accuracy, because these are criteria of general interest to users and for which there are well-accepted evaluation metrics (which is not the case for comprehensibility, for example). Furthermore, one expects a rough tradeoff between
speed and accuracy [Lim, et al., 2000], and a user of an IDA may be interested in points between the
For the experiments in this section, we restricted the ontology to a subset for which it is feasible to study an entire enumeration of plans thoroughly. The ontology subset uses seven common pre-processing, post-pre-processing, and induction techniques (for which there were appropriate functions in
Weka, see below). The experimental task is to build a classifier, and has as its start state a data set
con-taining at least one numeric attribute (which renders some inducers inapplicable without preprocessing).
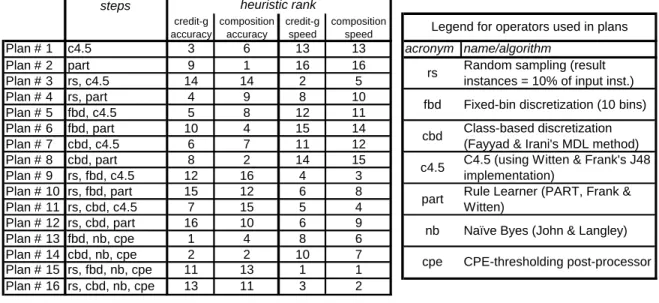
Table 1 shows on the left the list of 16 valid process plans IDEA created for this problem;on the right is
a legend describing the 7 operators used.6 Even this small ontology produces an interesting variety of
DM-process plans. For example, the ontology specifies that naïve Bayes only considers categorical
at-tributes, so the planner needs7 to include a preprocessor that transforms the data. Indeed, although the
ontology for the experiments is very small, the diversity of plans is greater than in many research papers.
credit-g accuracy composition accuracy credit-g speed composition speed
Plan # 1 c4.5 3 6 13 13 acronym name/algorithm
Plan # 2 part 9 1 16 16 Plan # 3 rs, c4.5 14 14 2 5 Plan # 4 rs, part 4 9 8 10 Plan # 5 fbd, c4.5 5 8 12 11 Plan # 6 fbd, part 10 4 15 14 Plan # 7 cbd, c4.5 6 7 11 12 Plan # 8 cbd, part 8 2 14 15 Plan # 9 rs, fbd, c4.5 12 16 4 3 Plan # 10 rs, fbd, part 15 12 6 8 Plan # 11 rs, cbd, c4.5 7 15 5 4 Plan # 12 rs, cbd, part 16 10 6 9 Plan # 13 fbd, nb, cpe 1 4 8 6 Plan # 14 cbd, nb, cpe 2 2 10 7 Plan # 15 rs, fbd, nb, cpe 11 13 1 1 Plan # 16 rs, cbd, nb, cpe 13 11 3 2
rs Random sampling (result instances = 10% of input inst.) fbd Fixed-bin discretization (10 bins) cbd Class-based discretization
(Fayyad & Irani's MDL method) c4.5
part
C4.5 (using Witten & Frank's J48 implementation)
Rule Learner (PART, Frank & Witten)
nb cpe
Naïve Byes (John & Langley) CPE-thresholding post-processor Legend for operators used in plans
steps heuristic rank
Table 1: 16 process plans and rankings
In Table 1, the first column ranks the plans by the number of operators in the plan. This may be inter-esting to users who will be executing plans manually, who may be interested in minimizing fuss. Not surprisingly decision-tree learning is at the top of the list, echoing the observation from the KDDCUP 2000 [Brodley & Kohavi, 2000]. We will not consider this ranking further except to reference plans by number.
The heuristic rank columns of Table 1 show two pairs of rankings computed by heuristics, one pair for accuracy and one for speed. The “credit-g” rankings are static rankings created by running all the plans
6
The last operator in Table 1, cpe, which places an appropriate threshold on a class-probability estimator, becomes a no-op for Naïve Bayes (nb) in the Weka implementation, because Weka’s implementation of nb thresholds automatically.
7
This is not strictly true for the Weka implementation, for which naïve Bayes is augmented with a density estimator for process-ing numeric attributes. For this study, we considered strict naïve Bayes. The Weka implementation, to IDEA, would be consid-ered naïve Bayes plus a different sort of numeric preprocessor.
on one, randomly selected data set (viz., credit-g8). A static ranking makes practical sense if the flexibil-ity to add new operators is not of primary importance. Adding new operators (or otherwise changing the ontology) changes the space of plans, in which case a static ranking would have to be updated or recom-puted. The “composition” rankings were generated by a functional composition based on the accuracy and speed functions contained in the ontology. More specifically, to generate the heuristic rankings, the ontology specifies a base accuracy and speed for each learner, and specifies that all the preprocessing operators will reduce accuracy and will increase speed, by different amounts. The heuristic functions are subjective, based on our experience with the different operators and our reading of the literature (e.g.,
[Lim et al., 2000]). The ranking functions were fixed before we began using Weka’s particular
imple-mentation, with one exception: because speed ratings differ markedly by impleimple-mentation, we ran Weka on one data set (again, credit-g) to instantiate the base speed for the three learning algorithms and the speed improvement factors for sampling and for discretization.
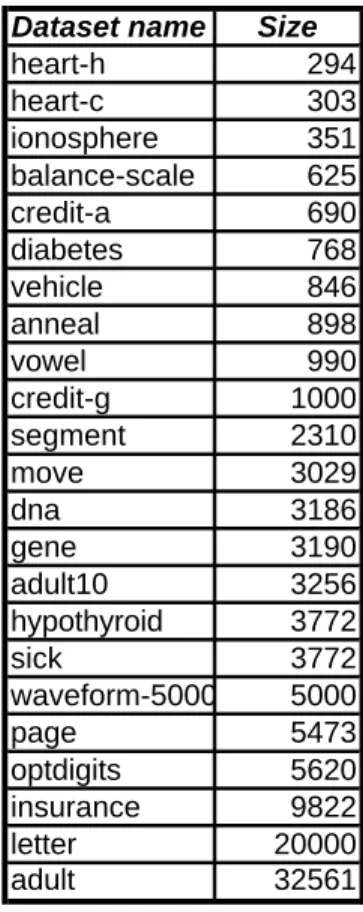
Our experiments are designed to assess the feasibility of using an IDA to provide rankings by speed and by accuracy. Specifically, the experiments compare the proposed rankings to rankings generated by actually running the plans on the data sets. For the experiments, we used 23 data sets from the UCI Re-pository [Blake & Merz, 2001], each containing at least one numeric attribute. The data sets and their total sizes are listed in Table 2. Unless otherwise specified, for each experiment we partitioned each data
set randomly into halves (we will refer to these subsets as D1 and D2). We used ten-fold cross-validation
within D2 to compute average classification accuracy and average speed—which then are used to assess
the quality of the ex-ante rankings, and to construct the “actual” (ex-post) rankings for all comparisons.
(We will use the D1s, later, to construct auto-experimentation rankings; the {D1, D2} partitioning ensures
that all results are comparable.)
8
Dataset name Size heart-h 294 heart-c 303 ionosphere 351 balance-scale 625 credit-a 690 diabetes 768 vehicle 846 anneal 898 vowel 990 credit-g 1000 segment 2310 move 3029 dna 3186 gene 3190 adult10 3256 hypothyroid 3772 sick 3772 waveform-5000 5000 page 5473 optdigits 5620 insurance 9822 letter 20000 adult 32561
Table 2: Data set names and sizes
4.2 Ranking by Speed
Our first experiments examine whether the heuristics can be effective for ranking DM processes by speed. Since being able to rank well by speed is most important for larger data sets, let us consider the largest of our data sets: adult. Table 3 shows the two rankings from Table 1 and the actual (ex-post) ranking based on the average run times for all the plans. The table is sorted by the actual ranking, and the table entries are the positions of each plan in each ranking (i.e., 1 is the first plan in a ranking, 2 the
next, and so on). Both heuristics rank very well. Using Spearman's rank-correlation statistic, rs (recall
that a perfect rank correlation is 1, no correlation is 0, and a perfectly inverted ranking is -1), to compare
with the ideal ranking, we can examine just how well. For the credit-g ranking (on the adult data set), rs
Plan Name credit-g ranking composition ranking D2("actual") ranking Plan # 2 16 16 16 Plan # 6 15 14 15 Plan # 8 14 15 14 Plan # 1 13 13 13 Plan # 7 11 12 12 Plan # 4 9 10 11 Plan # 5 12 11 10 Plan # 14 10 7 9 Plan # 10 7 8 8 Plan # 12 7 9 7 Plan # 3 2 5 6 Plan # 13 9 6 5 Plan # 11 5 4 4 Plan # 9 4 3 3 Plan # 16 3 2 2 Plan # 15 1 1 1
Table 3: Adult data set rankings by speed
Table 4 shows for all the domains the correlations between the rankings produced by the heuristics and the ranking based on the actual speeds. Here and in the subsequent tables, the data sets are presented in
order of increasing size (large ones toward the bottom). Highlighted in bold are the cases where rs > 0.5
(all but the smallest data set).9 Neither heuristic is superior, but both are effective; for both ranking
heu-ristics, the average is approximately rs = 0.85. These results show convincingly that it is possible for an
IDA to rank DM processes well by speed.
9
The choice of 0.5 was ad hoc, but was chosen before running the experiment. Examining hand-crafted rankings with various rs
credit-g ranking composition ranking heart-h 0.39 0.30 heart-c 0.62 0.59 ionosphere 0.80 0.70 balance-scale 0.82 0.81 credit-a 0.94 0.91 diabetes 0.55 0.64 vehicle 0.94 0.95 anneal 0.98 0.92 vowel 0.90 0.93 segment 0.89 0.92 move 0.90 0.95 dna 0.98 0.94 gene 0.92 0.95 adult10 0.97 0.97 hypothyroid 0.95 0.91 sick 0.95 0.89 waveform-5000 0.90 0.94 page 0.86 0.85 optdigits 0.89 0.87 insurance 0.95 0.93 letter 0.90 0.96 adult 0.93 0.98 mean 0.86 0.85 median 0.90 0.92
Table 4: Spearman ranks for ranking heuristics for speed
4.3 Ranking by Accuracy
Ranking by speed clearly is useful, but what about ranking DM processes in terms of the accuracy of the models they will produce? Our next set of experiments examines whether the IDA can be effective for ranking DM processes by accuracy. We note that we would not expect to be able to do nearly as well at this task as we would for ranking by speed. Nevertheless, it would be helpful to be able to give users guidance in this regard, especially when a system proposes a process containing a component with which the user is not familiar. If the process were ranked highly by accuracy, it would justify learning about this new component.
Credit-g and Composition Rankings
As in the speed experiments, we use the heuristic rankings to predict how the different DM processes
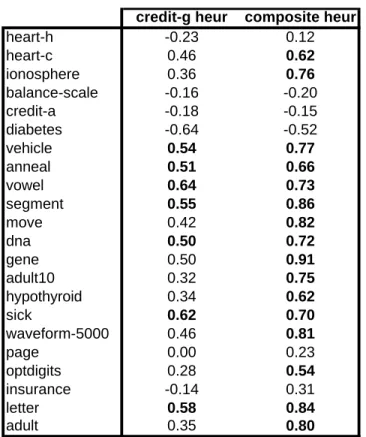
would fare in terms of accuracy. Table 5 shows the correlations (using Spearman’s rs) between the
heu-ristic rankings and the ranking determined empirically through cross-validation using D2. As above, the
the speed rankings (above). The mean rs is 0.28 for the credit-g ranking and 0.53 for the composition
heuristic. Examining the correlations for the composition ranking more closely, we see that in all but 3 (of 23) cases, the ranking is better than random, and in most cases it ranks surprisingly well by accuracy (17 of 23 have rs > 0.5). However, for the diabetes data set the ranking is strikingly poor (rs = -0.52)
10
, pulling down the means (cf., the medians). We reiterate that our purpose was not to study the production of the best heuristic ranking functions; we believe that these could be improved considerably with further research. Nevertheless, these results clearly support our claim that IDAs can rank DM process plans (heuristically) by expected accuracy, and therefore can provide valuable assistance in choosing between different processes.
credit-g heur composite heur
heart-h -0.23 0.12 heart-c 0.46 0.62 ionosphere 0.36 0.76 balance-scale -0.16 -0.20 credit-a -0.18 -0.15 diabetes -0.64 -0.52 vehicle 0.54 0.77 anneal 0.51 0.66 vowel 0.64 0.73 segment 0.55 0.86 move 0.42 0.82 dna 0.50 0.72 gene 0.50 0.91 adult10 0.32 0.75 hypothyroid 0.34 0.62 sick 0.62 0.70 waveform-5000 0.46 0.81 page 0.00 0.23 optdigits 0.28 0.54 insurance -0.14 0.31 letter 0.58 0.84 adult 0.35 0.80 mean 0.28 0.53 median 0.42 0.70
Table 5: Spearman ranks for heuristic ranking for accuracy
Auto-experimentation ranking
There is another option for producing accuracy rankings, which was not available for speed rankings. Specifically, an IDA can perform auto-experimentation, composing process plans and running its own
10
Investigating this further we find that the differences between the accuracies of the different plans are statistically insignificant resulting in somewhat random rankings.
experiments to produce a ranking of the plans by accuracy.11 Although this may initially seem ideal (al-beit time consuming), we must remember that even careful experimental evaluations of the accuracies of predictive models are still only estimation procedures, with respect to the accuracy of the models on un-seen data. The quality of the rankings of DM processes produced by such estimation will vary (e.g., by data-set size), and for any particular domain must be determined empirically. However, we know of no method of ranking by accuracy that performs better generally. Therefore, the auto-experimentation rank-ings can be considered a benchmark (upper bound) against which other ranking procedures can be com-pared.
We now present the results of an experiment to assess the effectiveness of such a procedure. For each domain, IDEA composed the DM process plans and generated Weka code for the plans (and for their
evaluations via cross-validation). For each data set, the cross-validation was performed on data subset D1
to produce an estimation of the accuracy that would result from running the plan on a data set from the domain. These accuracies were used to construct a ranking of the DM-process plans by accuracy for
each data set. These rankings then were compared to the ranking produced on data set D2 (identically to
all previous experiments). Table 6 lists the resulting rank correlations. As expected, the auto-experimentation outperforms the other two rankings considerably. Notably, the empirically determined
rankings are considerably better for the larger data sets: for data sets with 5000 or more records, rs = 0.86
for the empirically determined ranking, as compared to rs = 0.59 for the heuristic ranking. A t test shows
the difference in the means to be statistically significant at the p< 0.05 level (p=0.011) , and the win:loss ratio of 6:0 also is significant (at p<0.016 by a sign test). Also of note, considering the auto-experimentation results as an upper bound places the results of the composition ranking in a much better light.
11
D1 creditg-g ranking composition ranking heart-h -0.06 -0.23 0.12 heart-c 0.06 0.46 0.62 ionosphere 0.20 0.36 0.76 balance-scale 0.55 -0.16 -0.20 credit-a 0.71 -0.18 -0.15 diabetes 0.49 -0.64 -0.52 vehicle 0.91 0.54 0.77 anneal 0.90 0.51 0.66 vowel 0.90 0.64 0.73 segment 0.92 0.55 0.86 move 0.87 0.42 0.82 dna 0.91 0.50 0.72 gene 0.88 0.50 0.91 adult10 0.86 0.32 0.75 hypothyroid 0.96 0.34 0.62 sick 0.18 0.62 0.70 waveform-5000 0.94 0.46 0.81 page 0.74 0.00 0.23 optdigits 0.84 0.28 0.54 insurance 0.84 -0.14 0.31 letter 0.96 0.58 0.84 adult 0.86 0.35 0.80 average 0.70 0.28 0.53 median 0.86 0.42 0.70
Table 6: Spearman rank correlation coefficient for the three different ranking methods
These results show that ranking by accuracy (not surprisingly) is difficult, but that via various methods an IDA can provide guidance as to which methods are expected to be more accurate. For small data sets, the composition heuristic and estimation via auto-experimentation perform comparably. For larger data sets, auto-experimentation outperforms the composition heuristic, but one pays a considerable run-time price as the data-set size grows.
4.4 Trading off Speed and Accuracy
Our long-term goal is not simply to be able to rank by speed or by accuracy, but to allow users to specify desired tradeoffs between different criteria. For example, consider larger data sets. For these, as shown in the previous section, auto-experimentation provides significantly better rankings than does the compo-sition heuristic—but the auto-experimentation is time consuming. Presumably, as data sets get larger and larger, the accuracy of auto-experimentation will increase, but so will the computational cost. What if a user is willing to trade off some speed for a better accuracy ranking, but does not have the time for full-blown auto-experimentation (i.e., running all the plans on all the data)?
An alternative is to perform auto-experimentation on subsamples of the data for the purpose of estimat-ing the accuracy rankestimat-ing for the full data set. Presumably, as the data sets get larger the accuracy of the rankings improves, as does the computational cost. Our next experiment tests whether this in fact is the case—if it is, it will demonstrate that IDAs can allow users to trade off quality of assistance (in particu-lar, the ranking of DM-process plans by expected accuracy) for timeliness of assistance.
For the experiment, we had IDEA run the process plans for the six largest data sets (each having 5000
or more total records) on increasingly larger subsets of the data. Specifically, for each domain’s D1, we
selected random subsets of 10%, 20%, …, 100% of the data. For each subset, IDEA performed cross-validation to determine empirically an expected accuracy ranking, identically to the previous experiment. For this experiment, we consider only the eight DM-process plans that do not contain random sampling.
0 0.1 0.2 0.3 0.4 0.5 0.6 0.7 0.8 0.9 1 10 20 30 40 50 60 70 80 90 100 % of data sampled Spearmans r s waveform-5000 page optdigits insurance letter adult average
Figure 7: Rank correlations and sample size
Figure 7 plots the rank correlations as the size of the sample grows, for the six largest data sets, and in bold shows the average rank correlation as size grows. Clearly the largest samples give better rankings than the smallest ones. For the 100% sample, all are above 0.5, and all but optdigits are above 0.8. On the other hand, for several of the data sets (page, adult, letter) the rankings with the 10% sample are not much better than random. Recall from above that on these six (largest) data sets the composition ranking gives an average rank correlation of 0.59; comparing this with the results in Figure 7 suggests that even this rudimentary heuristic ranking is competitive with auto-experimentation until (on average) 20-30% of the data are used.
With one notable exception, the rank correlations become relatively stable when about half of the data have been seen. The optdigits curve is unusual: the rank correlations do not increase and do not become more stable as more data are used. Further investigation shows that optdigits is, in an important sense, “too easy.” Specifically, all methods perform extremely well, even with small training sets, so it is not possible to rank them meaningfully beyond a certain level (this still is substantially better than random). Figure 8 shows the graph without the optdigits data, showing that the average performance is as desired (generally increasing, but with decreasing marginal benefits).
0 0.1 0.2 0.3 0.4 0.5 0.6 0.7 0.8 0.9 1 10 20 30 40 50 60 70 80 90 100 % of data sampled Spearmans r s waveform-5000 page insurance letter adult average
Figure 8: Rank correlations and sample size without the optdigits dataset
These results show clearly that it is possible to trade off longer response time for higher accuracy of recommendations (rankings). In particular, using fewer data reduces the (average) quality of the rankings produced, but does so considerably faster. Using more data improves the quality of the rankings, up to the maximally accurate ranking (the full-blown auto-experimentation ranking
5
Knowledge Sharing and Network Effects
As we have argued, IDAs are particularly useful because they are systematic in their exploration of the design space of DM processes. Without such a tool users, even experts, seldom are systematic in their search of the DM-process space; it is unlikely that any user will consider all possible process plans. Therefore, users may overlook important, useful DM processes.
Up to this point for emphasis we have discussed novice users and expert users. However, this is not a true dichotomy—there is a spectrum of expertise along which users reside. For the most novice, any help
with DM process planning will be helpful. For the most expert, an IDA could be useful for double-checking his/her thinking, and for automating previously manual tasks, as well as for suggesting addi-tional processes. For others along the expertise spectrum, IDAs will have both types of benefits. Fur-thermore, even among experts, different users have different expertise: a data miner trained in the statistics community and a data miner from the machine-learning community can be experts and novices with respect to different methods. An IDA may help to educate any user. For example, when the system produces a highly ranked plan that a user had not considered previously, the user can examine the ontol-ogy, and become educated on some new aspect of the DM process.
A unique benefit of an IDA based on an explicit ontology is the synergy it can provide between teams of users. If users contribute to the ontology, other users instantly receive the benefit of their
contribu-tions. Thus, IDAs exhibit what economists call network externalities or network effects: users get
posi-tive value from other people using the "network," and therefore the value of the network to each user increases as the network gets more users. In this case, an IDA becomes more valuable to each user as the number of contributing users grows. All users get the benefit of contributors’ work automatically. Fur-thermore, no single member of the group has to be an expert in the entire body of data-mining technol-ogy.
Consider the following example of network effects in action. Georgia is a member of a large team of data miners, with several on-going projects. While reading the statistics literature she discovers a
tech-nique called dual scaling [Nishisato, 1994], a preprocessing operator that transforms categorical data into
(scaled) numeric data, in a manner particularly useful for classification. Georgia codes up a new pre-processor (call it DS) and uses it in her work.
Such discoveries normally are isolated; they do not benefit a team's other projects. However, consider
what happens if Georgia simply adds DS into the IDA, including adding the appropriate entry to the
on-tology. If another team member, Samuel, uses the system, DM process plans may be generated that use
DS (when appropriate). In some cases, these plans will be highly ranked (when DS is likely to do a good
job satisfying the user's criteria). In such cases, Sam could experiment with DS immediately, or could
read about it (using the documentation Georgia added), or could follow pointers to the literature, or could call Georgia directly and talk to her about it. Thereby, the tool brings to bear shared knowledge in the context of a particular need.
6
Demonstration with more complex DM process
We now present the results of a final set of experiments, to demonstrate further the power of IDAs. The prototypical DM-process template that we used for the discussions and experiments above was straightforward—as was necessary to introduce IDAs and to run experiments on a large number of
benchmark data sets. However, in some real-world situations the DM process can be more complex [Agrawal, 1998]. We assert that the potential value of IDAs is even greater in such cases, because there is even greater need for expertise in technique and in process itself.
The data we use for our demonstration were the subject of the 1998 KDDCUP. In 1998 the KDDCUP problem was to select a subset of a customer base to whom to mail solicitations, in order to maximize “profit” (revenues minus the cost of mailing). Participants built models from the training data, using a wide variety of different methods. To determine the “winners,” the organizers evaluated (on a separate test set for which the true answers were hidden) how much profit each team’s model would have gar-nered. More specifically, the 1998 KDDCUP was based on data from a fund-raising campaign under-taken by a national veterans association. The customer base was a set of individuals who donated in prior campaigns, and the goal was to select those from whom to solicit donations in the current campaign. Each observation in the data set is an individual, and includes (for example) the response to the prior campaign.
The training set from the competition consists of 95412 records and the test set consists of 96367 re-cords. The mailing cost is $0.68 and the average donation is $15.60 with a range of $1-$200. The dona-tion frequency is about 5% of the populadona-tion. Using the default strategy of mailing to everyone, the average profit over the test set is $10,560. The results of the 1998 KDDCUP competition are presented in Table 7. For this experiment, we use the variables used in a study reported by Zadrozny and Elkan
[Zadrozny and Elkan, 2001].12
12
Note that selection and construction of features also is part of the KD process. We do not treat them in this paper, except in Limitations, below.
Participants Profit %Gain Urban Science $14,712 39.32 SAS $14,662 38.84 #3 $13,954 32.14 #4 $13,825 30.92 #5 $13,794 30.63 #6 $13,598 28.77 #7 $13,040 23.48 #8 $12,298 16.46 #9 $11,423 8.17 #10 $11,276 6.78 #11 $10,720 1.52 #12 $10,706 1.38 #13 $10,112 -4.24 #14 $10,049 -4.84 #15 $9,741 -7.76 #16 $9,464 -10.38 #17 $5,683 -46.18 #18 $5,484 -48.07 #19 $1,925 -81.77 #20 $1,706 -83.84 #21 ($54) -100.51
Table 7: Results of 1998 KDDCUP
This was a challenging competition: the spread between the different competitors is quite large. No-tice that 9 of 21 entries produced lower profits than did the default strategy of mailing to everyone. In fact, the last-place entry actually lost money. The winners achieved a 39% increase in profit over the default strategy. Notice also that the winners are experts in this sort of data mining: Urban Science spe-cializes in building models for target marketing (and in fact, they also won the 1997 KDDCUP). Close behind in second place is SAS, who also have extensive experience with this sort of modeling.
The competitors with the lower scores most likely applied data mining tools in the manner typical of
data-mining/machine-learning research. As we will demonstrate, the straightforward application of
ex-isting tools is insufficient for high-level performance on these data. However, the inclusion of applica-tion-specific, DM-process-related knowledge is. We followed a methodology intended to mimic the algorithmic portion of the process that KDDCUP competitors would have taken. Specifically, we create rankings of DM processes considering only the training set (estimating the profit that would be obtained). To assess the quality of a ranking, we calculate the “actual” profits on the test set.
The 1998 KDDCUP focused on a problem of cost-sensitive classification: classify into one of two categories, solicit or do not, taking into account the cost of false positives (the mailing costs) and the cost of false negatives (the lost revenue). We use a larger set of induction algorithms than in the experiments above, but for clarity, for this experiment we do not consider pre- and post-processing explicitly.
Process Lin: Create dummies à Linear Regression à Classification by regression
Process Log(CPE): Create dummies à Logistic Regression(CPE) à CPE-Threshholding
Process NB(CPE): Discretization à Naïve Bayes (CPE) à CPE-Threshholding
Process Rule(CPE): Rule Learner(CPE) à CPE-Threshholding
Process DT(CPE): Decision Tree(CPE) à CPE-Threshholding
Figure 9: DM processes generated for cost-sensitive classification
Figure 9 shows 6 DM processes generated for cost-sensitive classification. As mentioned above, a wider variety of learning algorithms (from Weka) is used here, and only one process with each algorithm is generated. Specifically, the first two processes produce regression models: process “NN” is the appli-cation of a neural network learner and process “Lin” is the appliappli-cation of linear regression. As men-tioned in section 3.3, regression models can be converted to cost-sensitive classification models by a postprocessor which chooses (by experimenting with the training data) an appropriate threshold on the predicted (output) value (“classification by regression”). Both of these algorithms require categorical variables to be preprocessed into a set of binary “dummy” variables. The last four processes use algo-rithms that create “class probability estimators,” which give an estimation of the probability that a new example belongs to the class in question (here, “will donate”). Such a model can be converted to a class-probability estimator with a postprocessor that chooses a threshold decision-theoretically, taking into account the misclassification costs. Process Log(CPE) uses logistic regression, which also requires pre-processing of categorical variables into dummies. Process NB(CPE) uses naïve Bayes, for which discre-tization is required as a preprocess. Processes Rule(CPE) and DT(CPE) build rule-based and decision-tree models, respectively; these do not require the preprocessing of numeric or categorical variables.
Table 8 shows the ranking of these processes by estimated profit, the actual profit calculated on the test set, and the resulting percentage gain over the default strategy of mailing to everyone. The profit was estimated by auto-experimentation (using cross-validation, as above) on the training data. Note that ex-cept for the neural network classifier, the ranking by estimated profit is perfect. Unfortunately, even
without the error, the procedure would have placed only 9th in the competition. What’s worse, only one
of the processes actually beats the default strategy of mailing to everyone. To be fair, this was a very difficult problem for data miners not intimate with modeling for problems such as target marketing. In-deed, the participants in the contest were serious data-mining researchers and tool vendors, and only half were able to do significantly better than the default strategy.
Plan
Rank
Profit
%Gain
NN 1 $6,919 -34.48 Lin 2 $11,968 13.33 Log(CPE) 3 $10,520 -0.37 Rule(CPE) 4 $9,924 -6.02 NB(CPE) 5 $9,538 -9.68 DT(CPE) 6 $8,496 -19.54Legend for Operators Used in Plans acronym j48 Log NB Naive Bayes Rule Lin NN Linear Regression Neural Network name/algorithm Decision Tree Logistic Regression Rule Learner
Table 8: Process plans ranked by estimated profit, showing actual profit and gain over default strategy
What did the winners do differently? They did not use more complicated mining algorithms. Rather,
they used a different DM process, one that is known by specialists to be particularly effective for target marketing. Specifically, as shown in Figure 10, a class probability estimator (CPE) is built to estimate the probability of donation; separately, a regression model is built (from the donors in the training set) to estimate the amount to be donated conditioned on the presence of a donation. These two models are used in combination: the product of the two, for any individual, estimates his/her expected donation. If the expected donation is greater than the cost of the promotion to that individual, in this case $0.68, then a mailing should be sent. Otherwise it is not. This is the strategy used by the winner in the 1998 KDDCUP. Training data Pre-processing Regression learner Expected Donation = CPE * Regr Prediction data CPE model Regression model R Regression prediction CPE prediction CPE learner
Model Construction Model Use
Pre-processing
Figure 10: Target Marketing Process
We claim that such process knowledge, in this case about how to combine techniques to form effective special-purpose DM processes, can be added to an IDA’s ontology by specialists, subsequently to be brought to bear by others. To the ontology we can add a template process for target marketing. Note that there still is a large degree of freedom, even given such a process template. What type of learner should be used for class-probability estimation? What type of regressor? Given the learner, what type of
pre-/post-processing is required? The IDA will construct DM processes within the constraints imposed by this template, in addition to the simpler, default template (which we used above).
For our final experiment, we considered the cost-sensitive plans built with the default template and the plans built with the target-marketing template. In order not to bias the ranking with our prior knowledge (we know what the winners did), we use only auto-experimentation (cross-validation) to rank processes. In addition to the six process plans produced with the default (linear) DM process template, using the target-marketing template produces eight additional plans: the cross product of the available CPE learn-ers (four) and the available regression learnlearn-ers (two). All the plans then are ranked by their estimated profit, produced via cross-validation on the training set. If one plan were to be submitted to a contest such as the KDDCUP competition, it would be the highest-ranking plan. Of course, we have the luxury of examining the entire list.
Plan Rank Actual Profit %Gain
Log(CPE) + NN 1 $14,914 41.23 Log(CPE) + Lin 2 $14,778 39.95 Rule(CPE) + NN 3 $13,672 29.47 Rule(CPE) + Lin 4 $13,456 27.42 DT(CPE) + NN 5 $11,055 4.69 NN 6 $6,919 -34.48 DT(CPE) + Lin 7 $10,843 2.68 Lin 8 $11,968 13.33 Log(CPE) 9 $10,520 -0.37 NB(CPE) + NN 10 $10,070 -4.64 RULE(CPE) 11 $9,924 -6.02 NB(CPE) 12 $9,538 -9.68 NB(CPE) + Lin 13 $10,113 -4.23 DT(CPE) 14 $8,496 -19.54
Legend for Operators Used in Plans acronym DT Log NB Naive Bayes Rule Lin NN CPE Linear Regression
Class Prob. Estimator
name/algorithm
Decision Tree Logistic Regression
Rule Learner
Neural Network
Table 9: Process plans ranked by estimated profit, showing actual profit and gain over default strategy
The fourteen process plans, ranked by cross-validated estimated profit, are listed in Table 9 along with their test-set profits and the percentage gain (loss) over the default mailing strategy. The estimated
rank-ing reflects the actual profit rankrank-ing quite well (with a couple notable glitches, Spearman’s rs = 0.798).
Indeed, the range of gains is remarkably similar to the actual ranking of submissions to the contest (note
that we excluded processes such as: (just) build a simple decision tree, which produce
zero profit). The top-ranked plans indeed are competitive with the winners’ submissions. The penulti-mate plan is the one used by the winning submission, and performs comparably in terms of profit. We did not expect the IDA to perform this well, because we figured SAS and Urban Science must have left some tricks up their sleeves (e.g., proprietary twists on the modeling algorithms). The top-ranked process actually would have beaten the winning submission.
These results illustrate not only the power of the IDA generally to enumerate and to rank processes ef-fectively, but also the power of the IDA as a knowledge-sharing device. If one specialist includes knowl-edge about the target-marketing process, and another includes knowlknowl-edge about neural networks, and yet
another includes knowledge about logistic regression,13 other users would benefit from the IDA’s
compo-sition of these to form a top-performing DM process.
7
Related Work
The goal of this paper has been to show that IDAs can provide users with non-trivial “catalogs” of valid DM-processes, tailored to their task at hand, and can help them to choose among the processes in order to analyze their data. We have found few papers that directly address the idea of an IDA for the overall DM-process even though some have argued for its importance [Brazdil, 1998; Morik 2000]. There is, however, quite a long tradition of papers that address some of the same goals (like recommend-ing and rankrecommend-ing) or usrecommend-ing some similar techniques (e.g., plannrecommend-ing, auto-experimentation, and the use of ontologies) for recommending and for ranking individual induction algorithms.
7.1 The Use of IDAs
Especially in the European community, researchers have argued for the importance of IDAs. Morik [2000], for example proposes to use a case-based repository to store successful chains of pre-processing
operators.14 As pre-processing chains are partial DM processes, the insights gained should complement
our work, and ideally could be integrated with a system such as IDEA. The European MetaL project15
has as one of its foci IDA-like systems; we are not aware of any existing system that uses background
knowledge and/or experimentation to compose and rank DM processes, although Brazdil argues that it is
important to do so [Brazdil, 1998].
The only implemented IDA-like system we are aware of was presented by Engels et al., who describe a
user-guidance module for DM processes called CITRUS ([Engels, 1996], [Engels et al., 1997], [Wirth et
al., 1997], and [Verdenius and Engels, 1997]). In particular, the user-guidance module uses a
task/method decomposition [Chandrasekaran et al., 1992] to guide the user through a stepwise
refine-ment of a high-level DM process, in order to help the user to construct the best plan using a limited model of operations. Finished plans are compiled into scripts for execution. The system is implemented by extending SPSS Inc.’s Clementine® system, which provides a visual interface to construct DM-processes manually.
13
As was the case with us.
14
see http://www-ai.cs.uni-dortmund.de/FORSCHUNG/PROJEKTE/MININGMART/index.eng.html
15
MetaL stands for “Meta-Learning,” the process of learning models of the performance of learning algorithms as a function of characteristics of data sets; see http://www.cs.bris.ac.uk/Research/MachineLearning/metal.html.