Small scale tectonism on Venus: an
experimental and image based study.
Matthew Russell Balme
Dept, of Geological Sciences
University College London
Gower Street
London WCIE 6BT
This thesis is submitted fo r the degree o f Doctor o f
Philosophy at the University College London,
ProQuest Number: 10010141
All rights reserved
INFORMATION TO ALL USERS
The quality of this reproduction is dependent upon the quality of the copy submitted.
In the unlikely event that the author did not send a complete manuscript and there are missing pages, these will be noted. Also, if material had to be removed,
a note will indicate the deletion.
uest.
ProQuest 10010141
Published by ProQuest LLC(2016). Copyright of the Dissertation is held by the Author.
All rights reserved.
This work is protected against unauthorized copying under Title 17, United States Code. Microform Edition © ProQuest LLC.
ProQuest LLC
789 East Eisenhower Parkway P.O. Box 1346
Abstract._____________________________________________________________________________ Page 2
-A bstract
Closely spaced parallel lineations in the plains o f Venus are interpreted as extensional
rubble-filled fractures because they show no structure and are radar-bright irrespective
o f look angle. Their formation was investigated using a new methodology which
combines material science and fracture mechanics principles together with
experimental measurement and the analysis o f Magellan data.
Mapping in the Guinevere and Sedna Planitia regions shows that the closely spaced
parallel fractures (CSPF) follow a concentric pattern around the edge o f the large
topographic rise o f Western Eistla Regio. 13 spacing profiles show that most o f the
CSPF have spacings o f between 0.8 and 1.2km.
Using a new fracture mechanics apparatus designed to simulate Venusian surface
conditions (90bar o f CO2, 450°C), the fracture toughness o f basalt was measured from
atmospheric to 200 bar confining pressure and from room temperature to 600°C.
Fracture toughness was found to increase from -2 .4 MPam^^^ at ambient pressure to
about -3 .0 MPam'^^ at 50 bar confining pressure. Higher confining pressures have no
further effect. Fracture toughness shows no clear trend with temperature, rising from an
ambient level o f -2.4MPam^^^ to -3.0MPa^^^ at 150°C and returning to -2.4MPam'^^ at
higher temperatures.
A new, two-dimensional model based upon fracture mechanics is described. The depth
o f the CSPF is controlled by the stress intensity factor but their spacing is controlled by
the initiation o f new cracks. Application o f a faulting criterion to limit the conditions
under which the CSPF can form shows that the spacing is consistent with a regional
tensile stress o f 5.5-8.5MPa. This stress could have resulted from uplift o f Western
Contents._____________________________________________________________________________ Page 3
-Contents.
Chapter 1: Introduction, 27
1.1 Venus: background and current research. 27
1.2 The plains o f Venus. 29
1.3 Closely Spaced Parallel Fractures (CSPF). 29
1.4 A new methodology for investigating tectonic deformation 31
in the Venusian plains.
1.5 Aims o f the project. 31
1.6 Thesis plan. 32
Chapter 2: The Venusian plains, 34
2.1 Introduction. 34
2.2 Magellan imagery and the plains o f Venus. 34
2.3 The Plains o f Venus, evidence for a volcanic origin. 36
2.4 Composition and physical properties o f Venusian basalt. 38
2.4.1 Physical properties o f Venusian rocks. 39
2.4.2 Chemical composition o f Venusian rocks. 42
2.5 Canali and the case for exotic lava compositions. 44
2.5.1 Canali: physical description. 44
2.5.2 Canali, possible mechanism o f formation. 48
2.5.3 Canali, numerical considerations. 49
2.5.3a Laminar ‘insulating crust’ model. 50
2.5.3b Turbulent flow model. 52
2.5.4 Discussion arising from numerical modelling. 57
2.5.5 Carbonatites as channel forming fluids. 58
2.6 Analogue rock types for experiments on Venusian plains material. 58
Contents._____________________________________________________________________________ Page 4
-Chapter 3: Observations o f closely spaced parallel fractures from 60
Magellan Imagery
3.1 Introduction. 60
3.2 Aim o f imagery work. 61
3.3 Results o f imagery work. 62
3.3.1 Mapping o f azimuthal direction o f CSPF. 62
3.3.2 Fracture spacing measurement: method. 68
3.3.3 Fracture spacing measurement: results. 69
3.3.4 Fracture spacing measurements: significance o f trends. 72
3.3.5 Fracture spacing measurements: spacing number frequency 73
distribution.
3.3.6 Fracture spacing measurements: further significance o f trends. 76
3.4 Factors controlling spacing and azimuthal directions. 77
3.5 Length distribution o f CSPF. 82
3.6 Geological and stratigraphie setting o f CSPF. 82
3.7 Previous models o f CSPF. 92
3.7.1 Comments on observations by Banerdt and Sammis (1992). 93
3.7.2 Stress shadow model as described in Banerdt and Sammis (1992). 93
3.7.3 Shear-lag model. 94
3.7.4 Thermal model. 96
3.8 Conclusions. 98
Chapter 4: Application o f rock mechanics to shallow crustal conditions on 100 Venus.
4.1 Introduction. 100
4.2 Rheology o f rocks. 100
4.3 Formulation o f stress as components. 101
4.3.1 Stress Tensor. 101
4.3.2 Cauchy’s Formula. 102
4.3.3 Isotropic and deviatoric stress. 103
4.3.4 Principal axes. 103
4.4 The brittle-plastic transition. 103
Contents._____________________________________________________________________________ Page 5
-4.5.1 Plastic failure criteria. 105
4.5.2 Brittle failure criteria. 106
4.6 Griffith crack theory. 107
4.6.1 The Griffith crack in Uniform tension. 108
4.6.2 The plane Griffith criterion. 110
4.6.3 Modified Griffith criterion. 111
4.7 Fracture Mechanics. 111
4.7.1 Introduction. 111
4.7.2 Stress near the crack tip. 112
4.7.3 Fracture energy or mechanical energy release rate. 114
4.7.4 Critical values o f fracture mechanics parameters. 114
4.7.5 Non-linear fracture mechanics. 114
4.7.6 Experimental methods for determining fraeture mechanics 116
parameters.
4.7.7 Summary o f LEFM. 117
4.8.1 Fracture vs. faulting. 117
4.8.2 Anderson theory o f Faulting. 118
4.9 Sub-critical cracking. 120
4.10 Carbonates, fluids and pore pressure. 121
4.11 Conclusion. 122
Chapter 5: Experimental apparatus. 123
5.1. Introduction. 123
5.2 Design Parameters. 123
5.3 Apparatus overview. 124
5.4 Pressure vessel specifications. 126
5.4.1 Vessel size and working pressure. 126
5.4.2 Vessel closures and fittings. 127
5.5 Confining and actuator pressure system. 129
5.5.1 Confining pressure system. 129
5.5.2 Actuator Pressure system. 131
5.6 Force transfer system. 132
5.7 Sensors. 133
Contents._____________________________________________________________________________ Page 6
-5.7.2 Temperature measurement. 134
5.7.3 Displacement measurement. 135
5.8 Heating system. 135
5.9 Data logging system. 138
5.9.1 Data logging system- Hardware. 139
5.9.2 Data logging system- Software. 140
5.10 Conclusions. 142
Chapter 6: Development o f experimental apparatus and techniques. 143
6.1 Introduction. 143
6.2 Confming-pressure system. 143
6.3 Displacement pressure system. 145
6.4 Force transfer system. 148
6.4.1 Modifications to bottom platten. 149
6.4.2 Failings o f multi-piece actuator housing. 149
6.4.3 Discovery o f flaws in early design. 149
6.4.3a Compliance tests. 150
6.4.3b Compliance test finite element modelling. 153
6.4.4 Single piece actuator housing. 158
6.5 Displacement transducer. 159
6.6 Heating system. 160
6.6.1a Original design o f heating system: description. 160
6.6.1b Original design o f heating system: problems. 161
6.6.2 Solutions to heater problems. 163
6.6.3 First modification to heater system. 164
6.6.4 Further developments to heater system. 165
6.6.5 Modifications to experimental program. 166
6.7 Logging system. 167
6.8 Actuator design and seals. 168
6.9 Conclusion. 168
Chapter 7: Experimental techniques used in the measurement o f fracture 170 toughness and supplementary data.
Contents._____________________________________________________________________________ Page 7
-7.2 Calibration o f sensors. 170
7.2.1 Pressure sensors. 170
7.2.2 Inductive Displacement Transducer (IDT). 172
7.2.3 Thermocouples 175
7.2.4 Force-transfer and CMOD scaling factors. 175
7.3 Sample preparation and treatment. 176
7.3.1 Icelandic basalt samples. 177
7.3.1a Coring and initial grinding o f the samples. 177
7.3.1b Heat Treatment and final grinding. 178
7.3.1c Chevron ligament cutting. 179
7.3.2 Tanzanian natrocarbonatite. 179
7.4 Pre-testing measurements made on the samples. 181
7.4.1 Density and P and S wave velocity measurements. 181
7.4.2 Bulk mineralogical and chemical composition. 182
7.5 Fracture toughness testing methodology. 182
7.5.1 Sample pre-treatment. 182
7.5.2 Experimental method. 183
7.5.2a Intensifier priming. 183
7.5.2b Confining pressure. 183
7.5.2c Heating o f samples. 184
7.5.2d Sample deformation method. 185
7.5.3 Data analysis 186
7.5.3a Level I and II fracture toughness measurements. 186
7.5.3b K-resistance curve. 189
7.6 Post testing measurements. 190
7.7 Conclusion. 190
Chapter 8: Terrestrial analogues f o r rocks form ing the Venusian plains, 192
8.1 Introduction. 192
8.2 Sample collection for experiments. 192
8.2.1 Mt. Vulture, Southern Italy. 192
8.2.2 Oldoinyo Lengai, Tanzania. 194
8.2.2a Oldoinyo Lengai: introduction. 194
Contents._____________________________________________________________________________ Page 8
-8.2.3 Seljadalur, Iceland. 198
8.3 Suitability o f collected analogue material: results from characterisation 200
measurements.
8.3.1 Mineralogy and grain size. 200
8.3.2 Elemental abundance. 201
8.3.3 Density 202
8.4 Conclusions. 203
Chapter 9: Experimental results, 204
9.1 Introduction. 204
9.2.1 Raw data obtained from fracture toughness measurements. 204
9.2.2 Comments on raw data plots. 210
9.3 Summary o f results using ISRM methods to ealculate K and IQ. 211
9.4 Error analysis. 214
9.5 Application o f Matsuki (1991) method to results. 216
9.6 Fracture toughness as a function o f characterisation measurements. 220
9.6.1 Density. 222
9.6.2. P-wave velocity and P-wave modulus. 223
9.6.3. Thermal cracking damage parameter. 223
9.7 Non-linearity correction factor, p. 224
9.8 Young’s modulus measurements from Level II fracture toughness 227
measurements and P and S-wave velocity measurements.
9.9 Other fracture toughness measurements. 229
9.10 Analysis o f eraek faces by SEM and microscopy. 230
9.10.1 SEM results. 230
9.10.2 Optical microscopy o f crack faces. 234
9.11 Conclusions. 236
Chapter 10: Application o f fracture mechanics to experimental data and 239 results from imagery,
10.1 Introduction. 239
10.2.1 A new model for CSPF. 239
10.2.2 The edge crack. 240
Contents._____________________________________________________________________________ Page 9
-10.4 Application o f fracture mechanics to multiple crack problem. 245
10.5 Stress shadow for vertical edge crack. 249
10.6 Equilibrium fracture spacing. 252
10.7 Faulting vs. fracturing. 254
10.8 Implications o f fracture length and fracture width measurements. 256
10.9 Experimental measurements applied to modelling results. 257
10.10 Conclusions. 258
Chapter 11: Discussion o f results and directions f o r fu rth er work, 260
11.1 Introduction. 260
11.2 Imagery. 260
11.2.1 Summary o f results. 260
11.2.2 Discussion arising from imagery results. 261
11.3 Experimental results. 261
11.3.1 Summary o f results. 261
11.3.2 Discussion o f experimental results. 262
11.3.2a Size o f specimens. 262
11.3.2b Pressure effects. 263
11.3.2c Temperature effects. 265
11.3.2d Young’s modulus measurements. 266
11.3.2c Apparatus compliance. 267
11.4 Results o f modelling. 268
11.4.1 Precursor flaw size and the shortcomings o f a two- 268
dimensional model.
11.4.2 Properties o f rock mss required for CSPF formation. 269
11.4.3 Remote tensile stresses and penetration depths consistent 271
with observed spacing o f CSPF.
11.4.4 Spatial variation o f CSPF spacing. 271
11.4.5 Sources o f tensile stress in the lithosphere. 272
11.5. Further work. 274
11.5.1 Imagery. 274
11.5.2 Experiments and apparatus. 274
Contents.____________________________________________________________________________ Page 10
-11.6 Final conclusions 276.
Appendix I: Safety o f pressure vessel. 278
1.1 Safe working pressure o f vessel. 278
1.2 Assessment o f internal energy o f pressurised vessel. 281
1.3 Fracture mechanics vessel failure criterion. 282
1.4 Penetration o f safety barricade by ejected fragments. 284
1.5 Penetration o f barricade by shock wave. 286
1.6 Conclusions. 287
Appendix II: Field work logs. 288
II. I. Tanzania natrocarbonatite sample collection, 29/3/99-10/4/99 288
II.2. Iceland basalt sample collection, 28/8/99-1/9/99. 291
List o f figures._______________________________________________________________________ Page - 11
List o f figures.
Figures contained in chapter 1.
Fig. 1.1. Global topographic map o f Venus. 28
Fig. 1.2. T h e ‘Gridded Plains’ o f Guinevere Planitia. 30
Figures contained in chapter 2,
Fig. 2.1. Venus free-air gravity from Magellan cycles 4 and 5 from 35
NASA Magellan website.
Fig. 2.2. Sapas Mons, a volcano approximately 400 kilometres in diameter 36
and 1.5 kilometres high located on a topographic rise in Atla Regio.
Fig. 2.3. A cluster o f small cone volcanoes, each about 2 kilometres in 37
diameter and 200 metres high in Niobe Planitia.
Fig. 2.4. Heat loss, Q, from a hot surface under Venusian and terrestrial 39
atmospheres.
Fig. 2.5. Venera 9 and 10 panoramas in original perspective. 40
Fig. 2.6. Venera 13 panorama (left and right views). 40
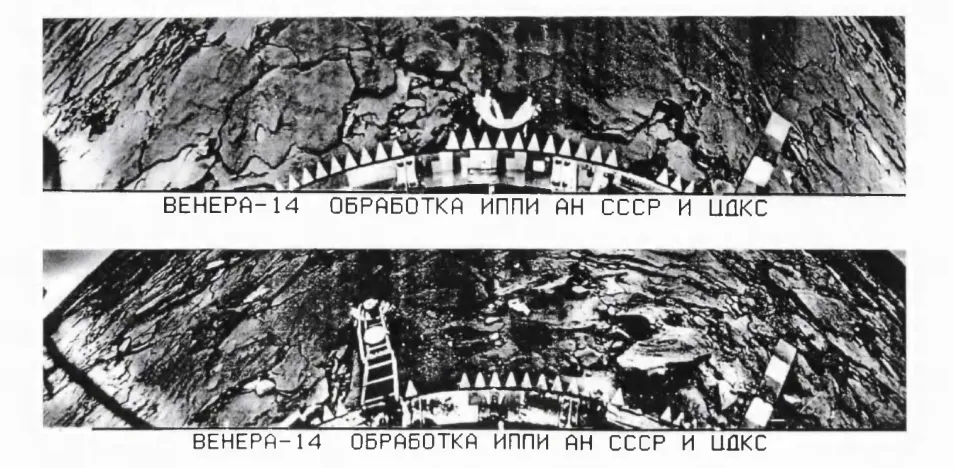
Fig. 2.7. Venera 14 panorama (left and right views). 41
Fig. 2.8. Cut off loops in canale. 46
Fig. 2.9. Delta-like termination o f a canale. 47
Fig. 2.10. Eroding canale. 48
Fig. 2.11. Solution o f Stefan equation applied to formation o f crust 51
on a lava flow.
Fig. 2.12. Turbulence criterion for a typical canale with a variety o f different 53
vélocités.
Fig. 2.13. Graphical plot o f Chezy Equation for ‘typical’ canale o f width 54
2000m and Venusian gravity and slope.
Fig. 2.14. Cooling times for natrocarbonatite flows assuming eruption 55
temperature o f 800K.
Fig. 2.15. Cooling time for Komatiite flows assuming eruption temperature 56
List o f figures._______________________________________________________________________ Page 12
-Figures contained in chapter 3.
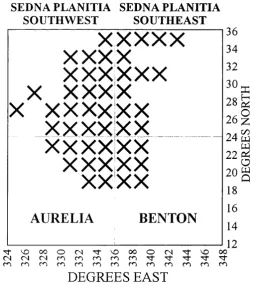
Fig. 3.1. Framelets containing linear features in the four FMAPS used in 63
this study.
Fig. 3.2. Sample images from the study area. 64
Fig. 3.3. Example o f azimuthal direction mapping method. 66
Fig. 3.4. SAR and topography o f Western Eistla Regio. 67
Fig. 3.5. Example o f profile used for spacing measurement. 69
Fig. 3.6. Results from profiles 1-6. 70
Fig. 3.7. Results from profiles 7 and 8. 71
Fig. 3.8. Results from black set o f fractures. 72
Fig. 3.9. Number frequency distribution plots o f fracture spacing for 74
profiles 1-6.
Fig. 3.10. Number frequency distribution plots o f fracture spacing for 75
profiles 7 and 8.
Fig. 3.11. Number frequency distribution plots o f fracture spacing for 75
profiles 9 and 10.
Fig. 3.12. Plot o f standard error on the mean against the spacing o f fractures 77
for all profiles.
Fig. 3.13. Extents o f topographic rise. 78
Fig. 3.14. Variation o f mean spacing with distance from edge o f Western 78
Eistla Regio topographic rise.
Fig. 3.15. Variation o f means spacing with distance from centre o f 79
topographic rise.
Fig. 3.16. Topographic plot showing how the centre o f curvature was 80
constructed for the southern black set o f fractures.
Fig. 3.17. Constructional lines for centre o f radius o f red set o f CSPF. 81
Fig. 3.18. Variation o f mean spacing o f red set o f CSPF with distance 81
from the local centre o f curvature.
Fig. 3.19a&b. Length distribution plots for CSPF. 82
Fig. 3.20. Geological sketch map o f Sif Mons (V 31) and Sedna Planitia 84
(V I9) mapping quadrangles.
Fig. 3.21. Stratigraphie relationships between major units in V I 9 and 88
List o f figures._______________________________________________________________________ Page 13
-Fig. 3.22. Age relationship between CSPF and other extensional features. 89
Fig. 3.23. Wrinkle ridge showing morphology controlled by NE and NNE 91
trending CSPF which it obviously post-dates.
Fig. 3.24. Image showing wrinkle ridge controlled by CSPF. 92
Fig. 3.25a&b. Stress shadows around a crack in a plate (a) and an edge- 94
crack (b).
Fig. 3.26. Active case o f the shear lag model where the upper brittle layer 95
is ductilely coupled to the stronger substrate.
Figures contained in chapter 4,
Fig. 4.1. Stress components on the faces o f an infinitesimal parallelepiped. 102
Fig. 4.2. The brittle plastic transition in P-T space. 104
Fig. 4.3. Failure modes under triaxial conditions. 105
Fig. 4.4. Coulomb and Mohr failure envelopes in normal and shear 107
stress space.
Fig. 4.5. Equilibrium plane crack system. 108
Fig. 4.6. A uniformly loaded elastic plate, C, with an elliptical flaw 109
occupying -x<c<x.
Fig. 4.7. Modes o f crack propagation. 112
Fig. 4.8. Stress field near the tip o f a crackin rectangular and polar 113
co-ordinates.
Fig. 4.9a,b,c. Anderson’s classification o f faulting for a) thrust, b) normal 119
and c) strike-slip faults.
Figures contained in chapter 5.
Fig. 5.1. Schematic overview o f Hastelloy pressure vessel, heating 125
system, force transfer system and closures.
Fig. 5.2. External view o f apparatus showing safety barricades, actuator 126
hand-pump and pressure gauges.
Fig. 5.3. Working pressure o f fracture mechanics apparatus pressure 127
vessel as a function o f temperature.
Fig. 5.4. Schematic o f bottom closure. 129
Fig. 5.5. The high-pressure system (for both confining and actuator 130
List o f figures. ______________________________________________________________________Page 14
-Fig. 5.6. Schematic o f force-transfer system. 133
Fig. 5.7. Sketch o f furnace showing all elements described in text. 137
Fig. 5.8. Heater control system showing one o f three possible channels. 138
Fig. 5.9. Front panel o f Setup-Logger VI showing readouts and controls. 141
Fig. 5.10. Front panel o f Bridge-Logger VI showing readouts and controls. 141
Figures contained in chapter 6.
Fig. 6.1. The original and final confining pressure system. 145
Fig. 6.2. The original and final displacement pressure system. 146
Fig. 6.3. An example o f an early level II tests carried out using a 147
pre-cracked basalt specimen.
Fig. 6.4. Photograph o f initial force transfer system. 148
Fig. 6.5. Development o f bottom platten showing instability caused by 149
radius comers.
150
151 raaius co m ers.
Fig. 6.6. This sample shows no change in compliance over three cycles.
Fig. 6.7. Compliance sample showing how the ligament is cut back for
each successive measurement.
Fig. 6.8. Compliance test results for basalt sample. 152
Fig. 6.9. Compliance test results for aluminium sample. 152
Fig. 6.10. Comparison o f basalt compliance test with theoretical curve 153
from Bubsey et a l (1992).
Fig. 6.11. Finite element plots o f deformed aluminium SR sample. 154
Fig. 6.12. Results from FE analysis. 155
Fig. 6.13. Approximation o f expected level I test and early pre-cracked 156
basalt level I test.
Fig. 6.14. Compliance o f apparatus derived from tests using aluminium 157
and basalt SR specimens and a steel block.
Fig. 6.15. Results from FE modelling o f new design for actuator housing. 158
Fig. 6.16. New apparatus compliance showing the vast change in stiffness. 159
Fig. 6.17. Original heater system showing Hastelloy support. 161
Fig. 6.18. Heater test. 163
Fig. 6.19. Second revision o f the heater system with better insulation 166
List o f figures._______________________________________________________________________ Page 1 5
-Figures contained in chapter 7.
Fig. 7.1. Confining pressure calibration results. 171
Fig. 7.2. Displacement transducer calibration results. 171
Fig. 7.3. Factory calibration o f PYC transducer at various temperatures. 174
Fig. 7.4. Output from PYC 106C transducer as a function o f displacement. 174
Fig. 7.5. One half o f the actuator housing showing important dimensions 176
for force and displacement measurement calculations.
Fig. 7.6. Sample dimensions as constrained by ISRM (1988). 177
Fig. 7.7. The aluminium jig used to ensure that a correctly angled slot 179
is cut in each sample.
Fig. 7.8. Wave velocity measurement apparatus. 181
Fig. 7.9. Construction lines used when performing level II data analysis. 188
Figures contained in chapter 8.
Fig. 8.1. Map o f Italy showing location o f Mt. Vulture. 193
Fig. 8.2. Sketch map o f Vulture showing crater lakes and Monticchio 194
carbonate tuff formation.
Fig. 8.3. Sketch map o f area surrounding Oldoinyo Lengai. 195
Fig. 8.4. Inside the crater o f Oldoinyo Lengai. 197
Fig. 8.5. Source o f lava flow from which sample was extracted. 197
Fig. 8.6. Sketch map o f Iceland. 198
Fig. 8.7. Columnar basalt at Seljadalur quarry. 199
Fig. 8.8. Columnar rubble. 199
Fig. 8.9. Example o f an electron backscatter image o f a sample o f 201
Iceland basalt.
Figures contained in chapter 9.
Fig. 9.1. Plots o f crack mouth opening displacement against opening force 206
for constant ambient temperature and varying pressure with CO2
or air as confining medium.
Fig. 9.2. Plots o f CMOD against opening force at ambient temperature and 207
varying pressure with CO2 as confining medium.
Fig. 9.3. Plots o f CMOD against opening force at ambient pressure and 208
List o f figures._______________________________________________________________________ Page 16
-Fig. 9.4. Plots o f CMOD against opening force at ambient pressure and 209
varying temperature with air as confining medium.
Fig. 9.5. Plots o f CMOD against opening force at ambient and lOObar 210
pressure and ambient pressure.
Fig. 9.6. Plots o f K and Kc as a function o f temperature and pressure. 213
Fig. 9.7. Mean results for K as a function o f temperature and pressure and 214
weighted means for Kc, again as a function o f temperature and
pressure.
Fig. 9.8. Matsuki method plots o f fracture toughness against crack 217
Extension for varying temperature at ambient pressure.
Fig. 9.9. Matsuki method plots o f fracture toughness against crack 218
extension for varying pressure at ambient temperature.
Fig. 9.10. Matsuki method results for Kc as function o f temperature and 219
pressure.
Fig. 9.11. Non-linearity corrected fracture toughness results from all 222
experiments as function o f density.
Fig. 9.12. Non-linearity corrected fracture toughness results from all 223
experiments plotted as function o f P-wave modulus as measured
prior to testing but after heat treatment.
Fig. 9.13. Non-linearity corrected fracture toughness results from all 224
experiments plotted as function o f damage parameter, which was
calculated. From P and S-wave velocity measurements before
and after heat treatment.
Fig. 9.14. Non-linearity factor, p as a function o f temperature. 225
Fig. 9.15. Non-linearity factor, p, as a function o f confining pressure. 225
Fig. 9.16. Variation o f K and Kc with non-linearity factor, p. 226
Fig. 9.17. P and S-wave velocity measurement evaluation o f E. 228
Fig. 9.18. Level II fracture toughness measurement evaluation o f E. 228
Fig. 9.19. Correlation o f Young’s modulus calculated using the two 229
methods.
Fig. 9.20. SEM micrographs o f crack surfaces. 231
Fig. 9.21. SEM micrographs o f crack surfaces. 232
Fig. 9.22. SEM micrographs o f crack surfaces. 233
List o f figures._______________________________________________________________________ Page 17
-Fig. 9.24. Optical image o f crack surface. 235
Fig. 9.25. Optical image o f crack surface. 235
Fig. 9.26. Optical image o f crack surface.
Figures contained in chapter 10.
Fig. 10.1. Stresses acting upon a crack in an elastic, infinite half plane. 241
Fig. 10.2. Penetration depth o f a single crack. 242
Fig. 10.3. Required length for instability o f an edge crack. 243
Fig. 10.4. Two dimensional side-view o f propagating cracks starting from 245
cooling joints.
Fig. 10.5. Multiple crack problem. 246
Fig. 10.6. ‘F-function’ as a function o f depth for various values o f 2b as 247
shown in legend.
Fig. 10.7. Stress intensity factors o f multiple crack system for a variety o f 248
crack spacings
Fig. 10.8. Effects o f crack spacing on penetration o f cracks. 249
Fig. 10.9. Bazant and Griffith flaw approximations for the stress shadow 250
near an edge crack o f length a.
Fig. 10.10. Equilibrium spacing plots for S=10, 20 and 35MPa. 253
Fig. 10.11. Fracture spacing as a function o f remote tensile stress for S=10, 254
20 and 35MPa.
Fig. 10.12. Fracture spacing and associated fracture depth for S= 10, 20 254
and 35MPa.
Fig. 10.13. Depth o f penetration as a function o f remote tensile stress for 255
S=10, 20 and 35MPa.
Fig. 10.14. Fracture spacing as a function o f rock mass fracture resistance 256
parameter, S.
Fig. 10.15. Plan view o f a crack o f length L in an infinite plane deformed 256
by a remote tensile stress, at.
Figures contained in chapter 11.
Fig. 11.1. Frictional interaction between crack faces occurs behind the 264
crack tip and resists the tensile opening force shown by the
List o f figures._______________________________________________________________________ Page 1 8
-Fig. 11.2. Sketch o f a section o f Venusian plains material with some 269
fracturing caused by a remote tensile stress acting perpendicular
to the large fractures.
Fig. 11.3. Deformed beam representing uplift o f a segment o f the lithosphere.273
Figures contained in appendix I.
Fig. 1.1. Strain in thick walled vessel. 278
Fig. 1.2. Tensile strength o f Hastelloy C-22 alloy corrected for 0.75 factor. 280
Fig. 1.3. The maximum working pressure o f the Hastelloy C-22 pressure 280
vessel.
List o f tables. Page 19
-List o f tables.
Table contained in chapter 1.
Table 1.1. Physical properties o f Earh and Venus. 27
Tables contained in chapter 2,
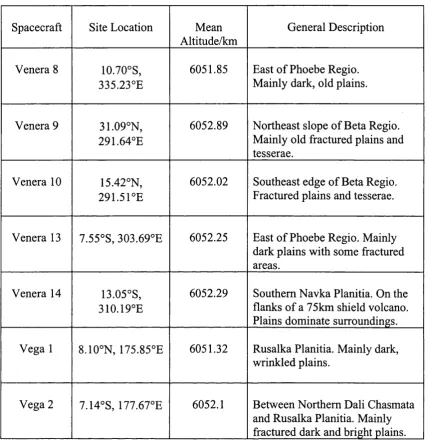
Table 2.1. Venus probes landing sites. 42
Table 2.2. Compiled results revealed by Gamma Ray Spectroscopy. 43
Table 2.3. Compiled results from XRF spectroscopy with terrestrial igneous 43
rock results for comparison.
Table 2.4. Potential flow distances o f carbonatites. 56
Tables contained in chapter 3.
Table 3.1. Correlation factor and significance for spacing profiles. 72
Table 3.2. Mean spacing o f split profiles and standard errors on the means. 76
Tables contained in chapter 8.
Table 8.1. Mineralogy o f Icelandic basalt. 201
Table 8.2. Elemental abundance o f Icelandic basalt used in rock mechanics 202
tests.
Table 8.3. Compiled results from Venusian lander XRF data compared to 202
laboratory samples used in tests.
Tables contained in chapter 9.
Table 9.1. Sample identification and summary o f experiments carried 205
out in this study.
Table 9.2 Results from the main series o f tests showing level I and II 212
fracture toughness measurements tested using air or CO2 only.
Table 9.3. Characterisation measurements. 221
Table 9.4. Summary o f experimental error estimates and calculations. 221
Table 9.5. Young’s modulus measurements using the wave velocity and 227
fracture mechanics methods.
List o f tables. Page 20
-Table contained in chapter 10.
Table 10.1. Smallest crack which will propagate in a given remote
tensile stress field.
244
Tables contained in appendix I.
Table 1.1. Thermophysical properties o f carbon dioxide.
Table 1.2. Internal energies for 1 litre o f compressed CO2.
Table 1.3. Maximum vessel stress intensity factors.
Table 1.4. Top closure ejection velocities.
Table 1.5. Shock wave TNT equivalents.
Table 1.6. Equivalent shock wave static overpressure.
Table 1.7. Initial wall velocities for shock wave transmission.
281
281
283
285
286
286
List o f symbols.______________________________________________________________________ Page 2 1
-List o f symbols.
a crack length (in specimens or in half plane)
A area
b crack half width; 2b = crack spacing in chapter 10
c crack half length
Co critical crack length
Ck specimen size correction factor
Cm penetration coefficient
d depth; spacing o f fractures in shear lag model
D diameter (o f specimens)
E Young’s modulus
E’ Young’s modulus in plane stress
f friction factor
F force
Fc corrected force (in level II tests)
Fj force at i**’ cycle in level II test
Fmax force required for specimen failure
g gravitational strength; sample geometry based compliance
G fracture energy
H enthalpy
i subscript meaning ‘initial’
I impulse
k thermal diffusivity
K stress intensity factor; level I fracture toughness; bulk modulus; pressure vessel
wall thickness parameter
Kc fracture toughness (in measurements, corrected for anelasticity)
L latent heat o f fusion
m mass
P anelasticity correction factor
P pressure
List o f symbols.______________________________________________________________________ Page 22
-Pb burst pressure
Q Heat loss from a surface.
R Rheological function; crack resistance energy
r statistical correlation factor; distance
Re Reynolds number
s slot thickness (in specimens)
So inherent shear stress
S rock mass fracture resistance; stiffness
t slit width (in specimens); penetration depth o f fragments
T temperature
Tm temperature o f molten material
To ambient temperature; tensile strength
U energy o f a system
u velocity o f lava flow
Ua loading system energy
Ue elastic strain energy
Um mechanical energy
Us surface energy
V voltage; velocity
Vp P wave velocity
Vs S wave velocity
w length (of specimens)
X distance
Xc critical spacing o f fractures in shear lag model
Y non-dimensional stress intensity factor
z depth o f crack penetration; depth into the crust
a slope; a/D (for Matsuki method calculations)
X P-wave modulus
s strain
y free energy per unit area o f a crack surface
List o f symbols.______________________________________________________________________ Page 23
-jj, coefficient o f friction
0 chevron notch angle (in specimens)
p density
o standard deviation; stress
Qij stress tensor
X shear stress
V kinematic viscosity; Poisson’s ratio
List o f abbreviations. Page 24
-List o f abbreviations.
4WD four wheel drive (vehicle)
BL Bridge logger
CB chevron bend
CMOD crack mouth opening displacement
CRB Columbia River basalt
CRBG Columbia River basalt group
CSPF closely spaced parallel fractures
FMIDR full resolution mosaicked image data record
GRS gamma ray spectroscopy
HPTA high pressure technology association
IDT inductive displacement transducer
ISRM international society for rock mechanics
LEFM linear elastic fracture mechanics
LVDT linear voltage displacement transducer
MIDR mosaicked image data record
MORB mid-ocean ridge basalt
SAR synthetic aperture radar
SEM scanning electron microscope
SL setup logger
SR short rod
VI virtual instrument
WR wrinkle ridge
Acknowledgements.__________________________________________________________________ Page 25
-Acknowledgements,
Primarily, I would like to thank my supervisors, Peter Sammonds and Claudio
Vita-Finzi, for their support and advice over the period o f this PhD and to honestly say
that I cannot see how their complementary strengths as advisers could be bettered. I
would also like to show my respect for Phil Meredith, whose advice has been
invaluable to me.
This project would never have been able to continue without the support o f the
Rock and Ice Physics experimental officers and I hope John Bowles, Neil Hughes and
Steve Boon will remember me as fondly in years to come as I will them. Other past and
present members o f the Rock and Ice Physics Laboratory I would like to thank for their
advice and friendship include Valentina Rocchi, Oswald Clint, Cathy Stafford, Colin
Jones and Steve Covey-Crump. Friday football will also be sorely missed.
I would like to thank John Guest, Ellen Stofan and Chris Kilbum for their help
with all things planetary or volcanological. Jim Davey, Andy Beard, Celine Murphy,
Ron Dudman, Leisa Clemente, Toby Stiles, Danuta Kaminski and Richard Rabe and
others are thanked for their frequent and good-natured assistance in a variety o f fields.
I acknowledge the UCL graduate school and central research fund for funding
essential to my research and NERC who sponsored me during this project.
I wish to acknowledge Francesco Stoppa for his guidance in Italy and Kirsty
Langley and Haldor Torfason for their assistance during my expedition to Iceland. For
help in my African adventure, I would also thank Matt Genge, Adrian Jones, Alex
Magayane o f the Tanzanian Ministry o f Energy and Minerals, Tony Church o f Safari’s
Unlimited and Burra Gadiye, the Lengai guide.
In the houmous eating planetary group I thank Antony Brian, Emma Bowden,
Paula Martin, Dominic Fortes, Louise Bishop, Pete Grindrod and Veronica Bray for
Acknowledgements.__________________________________________________________________ Page 26
-and Dave Heather, who inspired me to venture into the world o f scientific outreach. I
would also like to say a huge thankyou to the whole UCL Geology department for the
friendly and welcoming attitude displayed by staff and students alike. In particular,
cheers to Dave Hodgson and Matt Phillips who I feel I have known longer than these
few years.
Finally I would like to thank Naomi, Jon, Gayle, Ollie and Anne for putting up
with me in one way or another over these last three years and my parents for putting up
Chapter 1. Introduction Page 27
-Chapter 1
Introduction,
1.1. Venus: background and current research.
Venus could almost be termed Earth’s twin, so similar is it in size and mass.
However, Venus has a much thicker atmosphere and is surrounded by a dense mass of
clouds making visual observations o f the surface impossible. There was much
speculation about the nature o f the Venusian surface prior to the space age, and the
exploration o f Venus by the NASA Pioneer Venus spacecraft and the Russian Venera
and Vega missions increased our knowledge o f the planet considerably. It was the
spectacular radar imagery o f the NASA Magellan mission in the early 1990s, however,
that really captured the imagination o f scientists and general public alike (see for
instance Magellan at Venus special edition o f Journal o f Geophysical Research (1992)
or Cattermole, 1994). Figure 1.1 shows a global topographic map o f Venus generated
from Magellan data and some important physical properties o f Earth and Venus are
shown in table 1.1.
Property Mass / k g Mean Density /k g m ’^ Surface gravity /ms'^ Equatorial radius /k m Mean orbital radius /a u
Orbital period / days Sidereal rotational period Mean surface temperature /°C
Mean surface pressure /M P a Atmospheric com position
Venus Earth 4.87x10^4 5.98x10^"^ 5420 5520 8.87 9.78 6051 6378 0.73 1.0 224.7 365.25
243 days 23.9 hours
468 15
0.9 0.1
CO2 N2, O2
Table 1.1. Physical properties o f Earth and Venus.
The surface conditions on Venus are very different from those o f Earth, despite
the similarities in size and mass. Because there is no water or vegetation to hide the
geology o f Venus and the atmosphere protects the planet from the regolith-forming
action o f small impacts, the geological record is almost pristine, thus spacecraft images
are especially useful in unravelling the geological history o f the surface. Probably the
most important discoveries made by the Magellan mission are the fact that Venus has
no plate tectonics (Solomon et a l, 1991) and that it has a paucity o f impact craters
(Schaber et a l, 1992), implying a relatively young surface (Nimmo and McKenzie,
TERR&'% t I fT flfI
m
Chapter 1. Introduction_____________________________________________________________Page 29
-As Schubert et al. (1997) point out, plate tectonics is an important heat loss
mechanism on Earth and the absence o f such a mechanism on Venus has important
effects on the thermal evolution o f the planet. Recent work suggests that internal heat
production o f Earth and Venus is similar but scales directly with the mass o f the planet.
This means either that the mantle o f Venus heating up, or that there are other sources of
heat loss.
The low density and near random distribution o f impact craters have been used
to suggest that there was a global resurfacing event 400-700Ma (Strom et a l, 1994),
although some authors (e.g. Phillips, 1992) suggest that resurfacing was more localised
and not so temporally constrained (the equilibrium resurfacing theory). See Basilevsky
et al. (1997).
1.2. The plains o f Venus.
Plains units make up as much as 80% o f Venus’ surface (Masurky et a l, 1980).
The plains o f Venus are typically deformed by both extensional and compressional
tectonism (Banerdt et a l, 1997) which can be found in localised deformation zones or
distributed over larger areas. Rifting (Solomon et al, 1982), wrinkle-ridges (Mcgill,
1993) and coronae (Stofan et a l, 1997) commonly deform the plains and detailed
observations o f these features can be used as a tool to investigate the crust, lithosphere,
geological relations and resurfacing history o f the local area. Small scale tectonic
deformation in the plains caused by rift areas or topographic rises are particularly useful
because they constrain the formation times o f these large features with respect to the
surrounding plains.
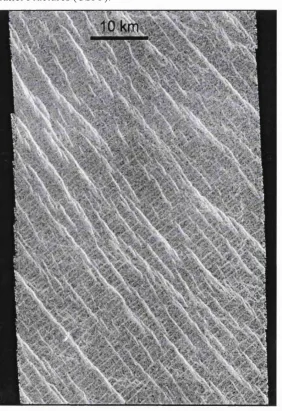
One such example o f small scale features are closely spaced parallel lineations,
the best example o f which forms one component o f the ‘Gridded-plains’ o f Guinevere
Planitia (see Eg. 1.1) and are described in Solomon et a l (1992) and Banerdt and
Sammis (1993). These features are particularly mystifying because o f their close
spacing and large areal extents (fig. 1.2) which seem to defy explanation by common
geophysical models (Solomon et a l, 1992).
1.3. Closely Spaced Parallel Fractures (CSPF).
The parallel lineations referred to above are found in an area centred at 3ON
333E and are Synthetic Aperture Radar (SAR) bright, linear features 10s or hundreds of
kilometres long in closely spaced, sub-parallel sets which can number hundreds.
Chapter 1. Introduction Page 30
-As the features are bright in left and right-looking SAR imagery, they have been
interpreted as rubble-filled mode I extensional fractures (Banerdt and Sammis, 1992). I
accept this hypothesis and suggest that a suitable designation for these features is
Closely Spaced Parallel Fractures (CSPF).
# 0
Fig. 1.2. The ‘Gridded Plains’ of Guinevere Planitia. Image centred at 30N333. North is up. The fainter, NE-SW trending lineations are very closely spaced and are very thin. The brighter, NW-SE trending features are interpreted as extensional features such as narrow graben or normal faults.
Anderson and Smrekar (1999) and Banerdt and Sammis (1992) have proposed
models of formation for CSPF. Banerdt and Sammis (1992) favour a shear lag model
where the driving force for the fractures comes from basal drag o f a strong ductile layer
beneath a weaker brittle layer. Anderson and Smrekar (1999) propose that global
Chapter 1. Introduction_____________________________________________________________ Page 3 1
-1.4, A new methodology fo r investigating tectonic deformation in the Venusian plains.
In this thesis I describe a new methodology for investigating planetary
tectonism. The methodology is based upon the principles o f material science, geological
modelling (incorporating fracture mechanics), and uses experimental data and
interpretation o f imagery. A similar methodology has been used successfully in the
interpretation o f crevassing on the Ronne Ice Shelf in Antarctica (Rist et a l, 1999) and
is described in Sammonds (1999).
Description o f CSPFs as extensional fractures initiated at the surface can be
accommodated using a two-dimensional fracture mechanics model. The key unknowns
will be the fracture properties o f the crustal material at Venusian surface conditions and
at depth. These are required to determine the initiation and spacing o f the fractures and
the depth where the crack becomes stable. The tensile strength o f material cannot be
used in such a model because o f the well-known effect o f scaling, whereby larger
rock-masses are weaker owing to the inclusion o f larger flaws. ‘Fracture toughness’ testing is
accordingly used in this project. This critical fracture parameter is a material property
and therefore independent o f scale and experiments on laboratory-scale samples can be
applied to the deformation observed in CSPF. The key physical properties have to be
measured using Earth analogues o f Venusian rocks. The choice o f analogue rock type is
constrained by the geochemical data o f the Venera and Vega probes and by the
conditions on the surface o f Venus.
The apparatus used to measure fracture toughness at Venusian conditions is a
key element o f this methodology. The development o f the apparatus itself is a new
application o f scientific and engineering techniques and, because measurements under
demanding Venusian conditions are difficult to perform, considerable effort has been
devoted to ensuring that the new apparatus functions correctly.
1.5. Aims o f the project.
The primary aim o f the experimental part o f this project was to carry out a series
o f fracture toughness tests on basalt, the analogue Venusian rock, at a variety of
temperatures and confining pressures. A secondary part o f the project was to use
carbonatite in these tests. Despite a successful sample collection trip to East Africa to
collect carbonatite, the material was permeated with undetectable macroscopic flaws.
This made measurement o f fracture toughness impossible owing to pre-existing damage
Chapter 1. Introduction_____________________________________________________________ Page 32
-used prior to the discovery that the samples were unusable are still given in this thesis).
The aims o f the imagery study were to measure the spacing and orientations o f the
CSPF and to analyse the geological and stratigraphie settings o f the units in which they
occur. These two themes are then drawn together using fracture mechanics modelling,
the aim o f which is to construct a consistent model o f fracture spacing that can be used
to assess the criticality o f variables such as material properties, atmospheric conditions
and lithospheric stress.
1.6, Thesis plan.
Chapter two describes the plains o f Venus and discusses the evidence that makes
the assumption o f their being largely composed o f basaltic igneous rock so
overwhelming. It also details some simple modelling work on carbonatites that I have
performed which shows that some features on Venus are unlikely to be formed by
basaltic volcanism and that some o f the plains could consist o f rocks o f a more exotic
composition. Chapter three presents the results o f the imagery work performed in the
Guinevere and Sedna Planitia regions o f Venus, including details o f fracture spacing,
orientation and geological setting. Chapter four summarises the rock mechanics theory
applicable to this project, specifically Linear Elastic Fracture Mechanics (LEFM) and
describes experimental techniques for measuring fracture mechanics properties. Chapter
five gives full details on the experimental apparatus used in this project and chapter six
describes its evolution. The chapter is split into separate sections, each devoted to the
different subsystems o f the apparatus in approximately chronological order. Chapter
seven gives details o f the experimental methods used, not only in the fracture toughness
tests but also in the calibration o f the apparatus and in the measurement o f additional
parameters used to characterise the rock samples. Chapter eight presents details o f the
sample collection fieldwork in Italy, Tanzania and Iceland and describes the results
from a variety o f characterisation measurements made on the samples. Chapter nine
presents the results from over 30 fracture toughness tests as well as full descriptions of
error analysis. Alternative methods o f data analysis are provided and compared with the
standard methods from the literature. Chapter ten describes a new fracture mechanics
model o f crack spacing, which uses these experimental results. Chapter 11 presents a
discussion o f these results, the imagery measurements and the outcome o f the
experimental model. A key issue in the discussion is the reliability o f the experimental
Chapter 1. Introduction_____________________________________________________________ Page 33
-chapter also includes comments on possible future work on CSPF including
Chapter 2. The Venusian plains.________________________________________________________ Page 34
-Chapter 2
The Venusian plains.
2.1. Introduction.
In this chapter I introduce the different types o f Magellan data used in this
thesis and discuss the origin and composition o f the Venusian plains. The arguments as
to why the plains are assumed to be volcanic in origin and as to why these flood lavas
have traditionally been thought o f as having a basaltic composition are examined.
Several criteria for the choice o f a terrestrial analogue to Venusian basalt are then
formulated. In addition, the results o f numerical modelling that 1 have performed
dealing with channelised flow o f lava are presented. These results, together with
imagery o f channels, suggest that basalt cannot form all the morphological features
found on the surface. The arguments for alternative lava types, and therefore, alternative
Venus analogue rocks, are summarised.
2.2. Magellan Imagery and the plains o f Venus.
Venus has a surface area about twice that o f the continents o f Earth making
mapping o f the surface a major undertaking. Despite the size o f the task, the NASA
Magellan mission mapped about 98% o f the surface using Synthetic Aperture Radar
(SAR) to view the surface through the cloud cover. The Magellan mission is described
in Wall et a l (1995). The images returned by the mission have been assembled to
produce Mosaiced Image Data Records (MlDRs) with a variety o f resolutions. Full
resolution data (FMlDRs) have been re-sampled to give 75m per pixel data products
although the true resolution o f the data is never better than 120m. The full resolution
data has also been compressed and re-mosaiced to give Cl-M lDRs, C2-MlDRs and
C3M1DRS, which have pixel sizes corresponding to 225, 675 and 2025 metres
respectively. The final type o f SAR data product is the FMAP, a large format version o f
the FMIDR, which has the same pixel size but typically covers a 12° by 12° area o f the
surface. Other data sets from the Magellan mission include the topographic data that
have a vertical resolution o f about 50m but a horizontal resolution o f about 5km and
data products that display gravity, roughness, emissivity and slope. A comprehensive
Chapter 2. The Venusian plains. Page 35
-This thesis mainly uses FMAP SAR imagery and topography data. Fig. 1.1 shows a
global topography map o f Venus.
The gravity data for Venus (fig. 2.1), based on either line-of-sight acceleration
tracking o f the spacecraft or Doppler data, show a greater spatial correspondence with
topography than for any other planet (Sjogren et a i, 1997). This implies that almost all
o f the Venusian topography is actively compensated, either by lithospheric buoyancy or
by dynamic support caused by density variation associated with convection in the
mantle. The spatial resolution o f the gravity data has improved greatly in recent years
thanks to an increase in computing power and higher order gravity models are
continually being generated (Harriot et a i, 1998 have produced a 180^^ order and degree
model). Some authors (e.g. Smrekar et a i, (1997) have used the gravity data and the
admittance (wavelength dependent ratio o f gravity and topography) to infer whether
large topographic rises are dynamically or isostatically compensated. Some rises, such
as Western Eistla Regio, may be recently active, as shown by a bottom loading
signature in the admittance plots (Smrekar, 1994).
120 K ISO K
m ttiig a ls
2-wr K
100 200
Fig. 2.1. Venus free-air gravity from Magellan cycles 4 and 5 from NASA Magellan web-page. Comparison with fig. 1.1 shows a high correlation between topography and gravity.
The Magellan SAR and topography data revealed that the majority o f the surface
o f Venus is made up o f extensive volcanic plains which range from approximately 1.5
km below the mean planetary radius o f 6051.3km to about 2 km above it (Guest et a i,
1992). Plains units cover more than 80% (Masurky et al., 1980) o f the surface, and
display numerous volcanic flow fields which are commonly greater than 50,000 km^ in
Chapter 2. The Venusian plains._______________________________________________________ Page 36
-flows, but there are large areas o f the plains, which appear homogenous when viewed
by SAR. These homogenous areas are interpreted to be either older volcanic flows
which have been weathered in such a way that their margins cannot be resolved, or
flows so large that their margins are too widely separated to appear on adjacent SAR
images.
2,3, The Plains o f Venus: evidence f o r a volcanic origin.
Volcanic landforms dominate the surface o f Venus and exist at all scales.
Extensive lava flows can be seen in fig. 2.2 and it is easy to trace flows from source to
termination hundreds o f kilometres away. In figures 2.2 and 2.3, older features are
embayed by younger ones.
Chapter 2. The Venusian plains. Page 37
-»
Fig. 2.3. A cluster o f small cone volcanoes, each about 2 kilometres in diameter and 200 meters high, in Niobe Planitia. False colour.
The peculiarly low crater density on the surface o f Venus suggests that there has
been at least one large-scale resurfacing event which obliterated any trace o f earlier
impact events shared with the rest o f the inner solar system. Some authors have
suggested that the crater distribution is impossible to distinguish from a random
population and have used this to suggest that the resurfacing was either global (Schaber
et a i, 1992, Strom et a l, 1994) or continual and regional (Phillips at al, 1992). Huack et
a l, (1998) found that the crater distribution is not completely spatially random and
imply that resurfacing was less than catastrophic and may have occurred over 0.5Gyr.
Despite disagreements over the timing and nature o f resurfacing, all these authors agree
that widespread volcanic activity occurred in the past and is responsible for the large
plains units o f Venus.
There is very little evidence to suggest that explosive volcanic activity is a
significant mechanism in the emplacement o f the plains, although, theoretically, there
are instances where it might occur (Fagents and Wilson, 1995). The lack o f explosive
volcanism is explained by the inhibiting effect that the dense atmosphere would have on
explosive devisiculation (Head and Wilson, 1992). This implies that the extensive flow
patterns visible on the Magellan images are not pyroclastic deposits and that the plains