A Web Based Energy Cloud Platform for Campus
Smart Grid for Understanding Energy Consumption
Profile and Predicting Future Energy Demand
S.H. Shah Newaz
1, Jin Hong Yang
1, Alaelddin Fuad Yousif Mohammed
1, Gyu Myoung Lee
1,2, Jun Kyun Choi
1 1Korea Advanced Institute of Science and Technology (KAIST)Daejeon, 305-732, South Korea.
2 School of Computing and Mathematical Sciences, Liverpool John Moores University
Liverpool, United Kingdom.
Email: [email protected], [email protected], [email protected], [email protected], [email protected].
Abstract—This paper proposes a web based energy cloud platform framework for analyzing energy consumption behav-ior of campus environment, forecasting future energy demand and controlling some power hungry appliances when electricity demand overpasses generation. In addition to that, one of the key objectives of our work is to incorporate a rule based data filtering logic with this web based energy cloud platform; so that, data associated with energy consumption behavior analysis could be reduced. This work is mainly based on our previously developed ThingsGate platform, which facilitates IoT (Internet of Thing) management on wireless Access Point (AP) and its execution. This paper also provides some insightful discussion on some technical aspects of access networks which should be taken into consideration for ensuring Quality of Service (QoS) of smart grid traffic (e.g. control messages). Our discussion would be useful for successfully deployment of smart grid in a campus environment.
Index Terms: Smart grid, Web based energy cloud, IoT, Remote appliance control, Big data.
I. INTRODUCTION
ICT technology and energy storage systems will be utilized to foster current electric power delivery and energy manage-ment system for future smart grid market [1]. Furthermore, in smart grid network Machine-to-Machine/Internet-of-Thing (M2M/IoT) devices could be utilized to build the advanced metering infrastructure (AMI) [2].
The web based cloud platform can play a key role for gath-ering data from consumer appliances and electronic systems. The energy metering information can be collected at a periodic manner by a number of Internet of Thing (IoT) devices, which could be connected with energy cloud platform, and send data through web agreeable data format (e.g. Resource Description Framework (RDF), Extensible Markup Language (XML)). The total energy consumption utilizations can be realized using this platform. Finally, such understanding will lead to select appropriate energy storage at a campus area. Furthermore, this would leverage real-time demand-response system (including improving the accuracy of electricity demand forecast).
One of the main challenges in big data analysis is to man-age data obtained from different sensors and meters installed at edge (e.g. home, offices) [3]. Therefore, it is needed to
0 2 4 6 8 10 12 14 Amplifier Cordless Phone Answer Machine Battery Charger Dishwasher Internet Appliance Microwave Oven Phone/Fax/Copier Printer Television Video Game Cable Modem Watts A p p li a n c e s
Standby Mode Power Consumption of Different Appliances
Max. Avg. Min.
Fig. 1. Standby mode power consumption of some popularly used appliances (data source [29], [30]).
collect data from sensors intelligently taking into account: data integrity, storage savings and processing load reduction of different time series data. Furthermore, to analyze energy consumption profile at the edge (residential area, office area, campus area), data should be collected selectively. That is, analyzing focus should not cover all the areas inside a campus or office building area. Rather, it would be wise to focus on those places where energy consumption fluctuates due to different internal and external stimuli (events).
Shifting demand when power consumption overpass gener-ation is one of the challenging issue in smart grid. To actualize this, there are many research and development efforts have been made so far (e.g. [16], [17]). Here, the main focus is
ThingsGate
ThingsGate internal hardware setup
Fig. 2. ThingsGatetest-bed at our laboratory(bottom)and internal hardwire
setup insideThingsGate (top)[18].
to turn off some of the power hungry appliances (e.g. dryer, washing machine, air conditioner) remotely or locally.
Another important research focus in smart grid is ensuring Quality of Service (QoS) among different smart grid electronic devices. The main characteristics of a smart gird is that it facilitates two-way flow of electric power and information [6]. In a smart gird, there are many electronic devices (e.g. intelli-gent electronic devices, sensors) need to communicate among themselves and outside of their domain (e.g. utility company). For ensuring reliability of smart grid, traffic originated from electronic devices of a smart grid installed in different locations need to be provided desired QoS support [26].
At this point, it needs to mention here that our proposed platform framework presented in this paper is mainly based on our previously developed ThingsGate platform, which facili-tates IoT management on wireless Access Point (AP) and its execution [18]. In this paper, we present how our proposed web based energy cloud platform works for campus smart grid and technical aspects of communication network that need to be taken into account for ensuring desired QoS for smart grid communication network traffic. Currently, we are in the development phase of this platform. This paper is arranged as follows: Section II presents related work. Section III describes the proposed web-based energy cloud platform framework. Some technical challenges are discussed in Section IV. Finally, Section V presents future work and concludes this paper.
II. RELATEDWORK
A. Web-cloud Platform for Smart Grid:
The authors in [4] introduce a web platform based on distributed cloud architecture to analyze energy consump-tion profile over time. Their proposed platform contributes a great deal of understating consumption behavior pattern for energy/utility companies. To manage demand response in smart grid, a solution is proposed in [5] based on cloud
platform. Authors claim that their proposed solution leverages data-centric communication. In [32], authors propose a novel cloud based software platform for analyzing big data with the objective of managing demand response dynamically. Their proposed platform facilitates integration of sensor data and data sources while making decision. Additionally, for forecast-ing future demand, authors in [32] proposed machine learnforecast-ing models which are trained over immense dataset collected from different sources (sensors, data sources).
B. Possibility for Cutting Energy Consumption at Edge:
Sometimes home/office appliances (e.g. computer monitor, fan, heater) are turned on unnecessary. This causes wastage of energy and could cause accident (e.g. fire) in a home/office. It is theoretically calculated in [8] that idle computers are responsible for emitting 1.8 Mega Tonnes of CO2 in the atmosphere every year in India. Some of the appliances can move into standby mode to minimize energy consumption. However, research findings in [10] show standby mode power consumption is not negligible (Fig. 1 states standby mode power consumption of some appliances). To cut off further energy consumption at a home/office, appliances should be turned off instead of keeping them in standby mode. If there is no one in home/office at a given time, there is no opportunity to turn off any of the appliances of that home/office in case they are left on/standby. Therefore, it is significantly important to have control over appliances remotely.
There are several protocols have been proposed so far to control appliances remotely. Indeed, there are significant research efforts already made for smart home/building automa-tion (e.g. [11], [12], [13], [14], [15]).
Energy Conservation and Homecare Network (ECHONET) standard was initialed first in Japan [16]. This standard speci-fies an open system architecture that facilitates the integration of numerous home appliances and sensors [16]. Different appliances and sensors used in a home or office may not be from the same vendor. ECHONET standard takes into account this issue. This standard supports remote control and monitor of consumer appliances. To achieve ECHONET certification, a vendor needs to create same interfaces mentioned in the ECHONET standard [16].
Pacific Northwest national Laboratory [7] initiated Grid Friendly Appliance (GFA) Project. The aim of this project is to modify some of the power hungry appliances of home; so that, they can be controlled remotely when there is no adequate elec-tricity generation to satisfy demand. They modified 150 clothes dryers to make them capable of responding to signals received from under-frequency, load-shedding appliance controllers.
Earlier, there was uses of programmable thermostats widely [20] to control temperature and humidity. Currently, the ex-tended version of programmable thermostats named as Pro-grammable Communication Thermostats (PCT) is available with remote communication capability. This PCT comes with communication and networking capability along with LCD user interfaces [20], [21]. Through a PCT’s different wireless and wired interfaces, it is possible to control thermal comfort related and other appliances [20], [21] in a home/office. In addition to that, PCT allows to download audit data through USB or similar I/O port.
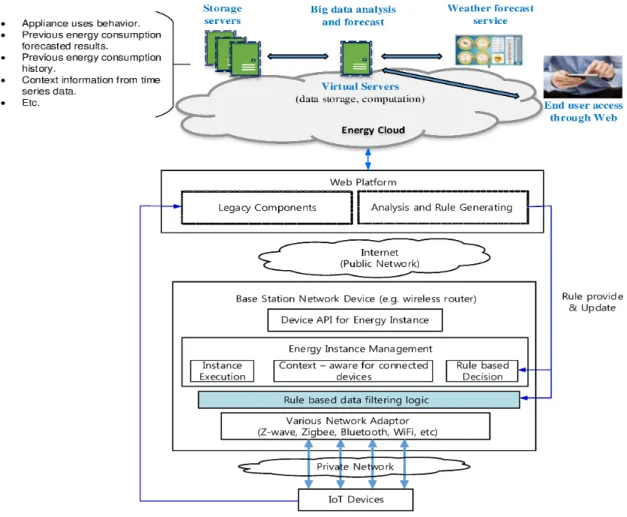
Fig. 3. Web-based energy cloud platform framework.
To date, there are several power outlets (e.g. smart sockets [17]) that allow controlling different household appliances through any Internet-equipped device. That means, it is possi-ble to turn on/off an appliance from laptop/smartphone while avoiding using them in those scenarios where energy demand is more than generation.
C. Occupants Presence Sensing Approaches:
For understanding occupants’ daily activities or switching on/off any appliances at office/home, it is increasingly impor-tant to detect presence of occupants at a particular location. In some cases, it might be required to identify an occupant before making any decision. To date, many research efforts have been made to detect, count and identify occupants. Each of the approaches comes with merits and demerits. For example, authors in [38] claim that their proposed solution based on vision-based system can achieve 93% and 83% of accuracy level inside office and corridor, respectively. However, this solution is likely to invade privacy of occupants. Authors in [36], [37] provide very detailed discussion about different kinds of approaches used for detecting occupants’ presence along with strength and weakness of those approaches.
D. Reducing Big Data Analysis Traffic Volume:
For big data analysis, one of the major challenges is to handle huge amount of data obtained from different sen-sors/IoTs and data sources [3]. Plausibly, smart meters are the main sources of data in a smart grid. To provide consumption behavior of a power system, a smart meter sends periodically energy consumption (kWh) value. Author in [34] argues that time driven metering scheme leads to not only increase data traffic load for communication network but also add big data processing load. Therefore, in [34], author came up with a novel event-driven electricity metering approach. Experimental results presented by author show that this event-driven elec-tricity metering approach can reduce data volume by around 90%.
III. PROPOSEDWEB-BASEDENERGYCLOUDPLATFORM
FRAMEWORK
Framework presented in Fig. 3 is an extension of our earlier developed ThingsGate platform [18]. The ThingsGate plat-form, which is equipped with two wireless interfaces (Zigbee and WiFi), mainly allows IoT management and execution on WiFi AP to provide context aware service at the edge. Figure 2 showsThingsGatetest-bed developed in our laboratory. The test-bed presented in Fig. 2 was facilitated for the purpose of
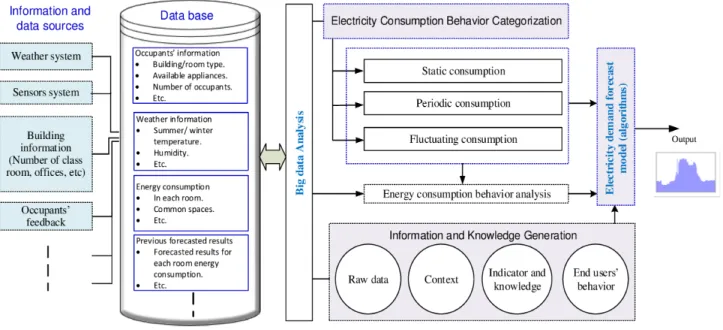
Fig. 4. Energy consumption forecast and consumption profile measurement system model.
controlling consumer appliances remotely through Internet (a fan and three table lamps are considered in the test-bed setup as shown in this figure). The following paragraphs present the key features of the proposed web based energy cloud platform framework for campus smart grid.
Figure 3 presents architectural concept of web based energy cloud platform. The proposed energy cloud platform consists of demand forecast and data storage server as well as a lot of IoT/sensor devices which are installed at the edge (class room, dormitory and experiment laboratory). The energy generation and consumption data are collected from different IoT/sensor devices. Based on intelligent filtering mechanism, which can be dynamically modified based on requirement at a given time, only the useful information that would be useful to indicate future consumption behavior or understand any context information are forwarded to the big data analysis and forecast server as shown in Fig. 3.
In a campus, there would be class rooms, experiment laboratories, offices and dormitories. We (authors) believe that there is no use of analyzing all the data from all the areas in a campus for forecasting future energy demand. To the best of our knowledge, in many areas inside a campus energy consumption is very deterministic and can be easily quantified. For example, a classroom energy consumption mainly relies on number of classes take place per-day, number of students at each of the classes, duration of classes, weather parameters, and desired classroom temperature. Therefore, our proposed platform framework puts effort to categorize power consumption behavior into mainly three categories as shown in Fig. 4. These categories are: (i) static consumption (e.g. common places lighting), (ii) periodic consumption, and (iii)
fluctuating consumption, which are mainly due to unexpected stimulus.
Most of the existing solutions consider fixed appliances while they measure future electricity demand. However, as the
number of Electric Vehicles (EVs) are increasing, we must take into account load arrival rate (e.g. EVs, laptops) while forecasting future energy demand in a campus environment. Similar EV load arrival consideration can be found in [27], [28]. It needs to be noted that if there are many EVs arrivals throughout a day, their electricity demand could significantly affect the overall electricity demand of a campus. Therefore, we must take into account load arrival rate at campus’s charging station in our demand forecast model as considered earlier in [27], [28]. Our service scenario can be applied to a single home, apartment, shopping malls, or hospitals.
In a campus, usually, there would be several WiFi APs. When a handheld device user moves into a new place, usually they get connected with the AP which provides the most powerful signal compared to all other neighboring APs [31]. Using this simple tracking approach, our system model will be able to track a handheld device user’s mobility behavior (e.g. current location of a student in campus) and number of available occupants in a particular place at a given time [35] (authors in [35] propose different novel solutions to track occupants’ presence using existing network infrastructure). Additionally, other existing occupants detection approaches (e.g. video sensing, pressure mat, CO2 sensors [37]) can be employed along with the existing communication network infrastructure based approach proposed in [35] to improve tracking accuracy level.
Our proposed framework takes into consideration presence of occupants while controlling any appliance remotely (e.g. turning off any appliance (fan, air conditioner, TV, computer monitor) when there no one available in a dormitory room) and deciding on future energy demand. Standby power con-sumption of some of the appliances is not negligible [8], [10]. Therefore, whenever situation allows, proposed energy cloud platform should signal to turn off power hungry standby appliances which are less likely to be used within a while.
Furthermore, for forecasting future energy demand, proposed platform need to take into account weather information, and different direct and indirect indicators (e.g. class routines, number of students at each class) as considered in [33].
Our energy cloud platform would be able to collect differ-ent kind of data from edge through differdiffer-ent interfaces (Z-wave, WiFi etc.); so that, human level intelligence can be introduced after transforming raw data into information. In addition, after analyzing energy consumption behavior, results can be displayed at a web-based user screen. Furthermore, this platform might expect users intervention before making any decision in any exceptional case (when decision cannot be made by the web based energy cloud system).
In our platform, device APIs will be provided for energy metering instance along with add-on functions (e.g. new rule generation, analysis to any statistics). Finally, it should be mentioned here that developing an accurate demand forecast model is one of the key challenging issues in smart grid research area. An efficient model can contribute a great deal of reducing both capital expenditure and operational expenditure of a grid. For instance, if energy demand forecast accuracy is high, reasonably, it would not be required to install large Energy Storage System (ESS), which is still considered as an expensive solution for improving electricity supply reliability in grids. The impacts of this proposed framework are several-folds:
• Forecasting future (short-term and long-term) energy
demand in campus with good accuracy level.
• Minimize wastage of energy at edge (e.g. homes and
offices) by turning off appliances that do not have any uses at any particular time.
• Turn off any power hungry appliance (e.g. washing
machines, dryer) when demand exceeds generation (i.e. demand shifting).
• If we have control over different consumer appliances
of edge, we can implement any protocol when power outage or any natural disaster takes place.
• Proposed platform also aims at ensuring occupants’
desired comfort level, while reducing energy con-sumption in campus.
• Reduction of big data processing and storage load by
introducing rule based novel data filtering approach.
IV. TECHNICALISSUES OFENERGYCLOUDPLATFORM
Ensuring end-to-end QoS, reliability and security in energy cloud platform should be considered as the most important research issues. However, QoS and reliability are the main focuses in our research. In the following paragraphs, we discuss few technical aspects of access networks that should be taken into consideration in smart grid communication network study and big data processing load minimization.
Smart meters and different kind of sensors need to upload huge amount of data to cloud data centers periodically. In addition, from control center (e.g. utility companies) different smart grid electronic components and appliances used at edge might receive different control signals time to time. Therefore,
network operators need to take into consideration future smart grid traffic load while planning their network deployment. In a smart grid communication network, different traffics are generated from different sources (e.g. smart meters, sensors) and they travel through existing communication networks (from the access segment to core backbone). These traffics need to be provided different level of QoS [26], [19]. Some of the messages need to reach within very short time to the decision center (control center); so that, reliability can be ensured. Authors in [26] provide detailed discussion on the QoS requirement of different types of smart grid traffic including synchrophasor traffic, and Supervisory Control and Data Acquisition (SCADA) traffic.
Traffic from different sources in a smart grid might travel through different kind of networks having different priority classes. For example, WiMaX, WiFi, and Ethernet Passive Optical Network (EPON) have priority levels 5, 8, and 8, respectively [25]. Therefore, it would be interesting to find how these smart grid traffic behaves when they are forwarded through different networks (e.g. home to WiMaX, then PON). There has been significant research effort to minimize en-ergy consumption in communication network due to the rise of energy costs [23]. Research finding shows that access network is responsible of consuming 70% of total energy consumption of telecom network, whereas it is underutilized most of the time (utilization is only 15%) [24]. The common approach for improving energy saving in a network equipment is sleep mode (this approach is widely used in many access network equipment; for example, Optical Network Units (ONUs), Base Stations (BSs)). Under this approach, when an access network equipment (e.g. ONU) moves into sleep state turning of transceivers, traffic forwarding is no longer possible. Authors in [23] explain how sleep mode can impose additional delay in a TDM-PON, which is a very widely used access network technology. Therefore, an access network equipment should take into account QoS constrains of traffic generated from different sources in a smart grid along with other traffic (e.g. voice, video, file) while managing sleep mode for maximizing its energy efficiency.
Big data processing load needs to be minimized. Otherwise, it would be devastating if we cannot figure out any critical indication within very short time to avoid any unexpected sit-uation (e.g. blackout, accidents). It would be wise to reduce the amount of traffic from the places where traffics are originated (i.e. sensors installed in offices/classrooms, smart meters). For example, proposed event-driven electricity metering approach in [34] could significantly contribute on reducing smart meters’ traffic. As it is mentioned in [3] that many IT organizations are currently putting effort to introduce new techniques for filtering data on the fly. This would reduce big data processing load, minimize energy consumption at different network nodes (e.g. ONUs, BSs) and readily improve QoS performance of smart grid traffic. The reasons behind improvement of QoS performance of smart grid traffic when data reduction is pos-sible (using data filtering or compression mechanism) are: (i)
as amount of traffic reduces, bandwidth saturation is likely to be occurred less frequently causing less congestion at different network nodes, and(ii)less number of collision will take place while smart meters’ and sensors’ data are uploaded through wireless network to cloud data centers [39].
V. CONCLUSION
In this paper, we have presented a web based energy cloud platform framework for analyzing energy consumption behav-ior in a campus, forecasting future (short-term and long-term) energy demand and controlling remotely appliances which are left on/standby unnecessary. Here, we have explained several technical issues for actualizing our objectives. Currently, we are in the development phase of the proposed framework presented in this paper based on our previously developed
ThingsGate platform [18]. In future work, we will present some experimental and analytical results to demonstrate how the proposed platform framework performs in a campus energy grid.
ACKNOWLEDGMENT
This work was supported by grant No. EEWS-2014-N01140044 from Climate Change Research Hub Project of the KAIST EEWS Research Center (EEWS: Energy, Environment, Water and Sustainability).
REFERENCES
[1] The National Institute of Standards and Technology (NIST), [Online]
Available: http://www.nist.gov/smartgrid/.
[2] TR 102 935 v2.1.1, Machine-to-Machine communications (M2M):
Ap-plicability of M2M architecture to Smart Grid Network, ETSI, Sept. 2012.
[3] IBM white paper; “Managing big data for smart grids and smart
me-ters”,[Online] Available: http://www.smartgridnews.com/artman/uploads/ 1/IBM anaytics paper.pdf
[4] V. Nikolopouloset al., “Web-based decision-support system
methodol-ogy for smart provision of adaptive digital energy services over cloud
technologies,”Software, IET , vol.5, no.5, pp.454,465, Oct. 2011
[5] Hongseok Kim et al., “Cloud-based demand response for smart grid:
Architecture and distributed algorithms,”2011 IEEE International
Con-ference on Smart Grid Communications (SmartGridComm), pp.398,403, 17-20 Oct. 2011.
[6] IEEE Std P2030, Draft Guide for Smart Grid Interoperability of Energy
Technology and Information Technology Operation with the Electric Power System (EPS), and End-Use Applications and Loads, 2011.
[7] Pacific Northwest GridWiseT M Testbed Demonstration Projects; Part II.
Grid FriendlyT M Appliance Project, [Online] Available:hhttp://www.
pnl.gov/main/publications/external/technical reports/PNNL-17079.pdfi
[8] Electricity wastage in Schools/Colleges; [Online] Available:
http://www.devworx.in/contests/intel-app-innovation-contest-2013/ image pfd/1377405758 Play n Save.pdf.
[9] Office appliances on standby mode consume 60GWh energy annually
WWF introduces more Low-Carbon appliances for businesses;
[On-line] Available: hhttp://www.wwf.org.hk/news/press release/index.cfm?
unewsid=3820&ulangid=1i.
[10] Cutting Britains energy bill Green Alliance policy insight: making
the most of product efficiency standards. sept. 2012. [Online]
Avail-able:hhttp://www.green-alliance.org.uk/resources/Cutting%20Britain’s%
20energy%20bill.pdfi.
[11] T.Yamazaki,“UbiquitousHome,”InternationalJournalofSmartHome,
vol. 1, no. 1, pp. 17-22, Dec. 2007.
[12] WangChun-dong, Liu Xiao-qin, WangHaui-bin, “A Framework of
Intelligent Agent Based Middleware for Context Aware Computing,” Natural Computation.2009. ICNC09. Fifth International Conference on, vol.6, pp.107-110, 14-16. Aug. 2009.
[13] S.K.Dasetal.,“TheRoleofPredictionAlgorithmsintheMavHome
Smart Home Architecture,”IEEE Wireless Communications Magazine,
vol. 9, no. 6, pp. 77-84, 2002.
[14] Young-GukHa, “Dynamicintegrationofzigbee homenetworksinto
home gateways using OSGI service registry,” IEEE Transactions on
Consumer Electronics., vol. 55, Issue. 2, pp.470-476, May. 2009.
[15] Yu-Setal,“ArchitectureforInteroperability ofServicesbetweenan
ACAP Receiver and Home Networked Devices,”IEEE Transactions on
Consumer Electronics, vol. 52, no. 1, pp. 123- 128. 2006.
[16] ECHONET;[Online]Available:http://www.echonet.gr.jp/english/.
[17] Smart Sockets Let You Control Your Power From Your
Phone; [Online] Available: hhttp://www.fastcoexist.com/1680346/
smart-sockets-let-you-control-your-power-from-your-phonei.
[18] ThingsGate:[Online]Available:http://www.thingsgate.com/.
[19] Emilio Ancillotti, et,al; “The Role of the RPL Routing Protocol for
Smart Grid Communications”;IEEE Communications Magazine; Jan.
2013.
[20] J.Douglas,“Smartthermostatsforcomfortandconservation,”EPRIJ.,
vol. 19, no. 2, pp. 2023, Mar. 1994.
[21] D. Meier, “Residential thermostats: Comfort controls in California
homes, Univ. California, eScholarship Repository [Online]. Available: http://repositories.cdlib.org/lbnl/LBNL-938E.
[22] B.Qela;H.T.Mouftah,“Observe,Learn,andAdapt(OLA)An
Algo-rithm for Energy Management in Smart Homes Using Wireless Sensors
and Artificial Intelligence,” ,IEEE Transactions on Smart Grid, vol.3,
no.4, pp.2262,2272, Dec. 2012.
[23] S.H.S.Newazetal.,“AdaptiveDelay-AwareEnergyEfficient
TDM-PON,” Computer Networks, Volume 57, Issue 7, Pages 1577-1596, 8
May 2013.
[24] P. Chowdhury et al., “Building a green wireless-optical broadband
access network (WOBAN), ”Journal of Lightwave Technology; vol. 28,
no. 16, pp. 2219 -2229, Aug. l5, 2010.
[25] J.Leeetal.,“QoSMappingoverHybridOpticalandWirelessAccess
Network,”2009 First International Conference on Evolving Internet, pp.
139-141, 2009.
[26] Q.-D.Ho,Y.Gao,andT.Le-Ngoc,“Challengesandresearch
opportuni-ties in wireless communication networks for smart grid,”IEEE Wireless
Commun., vol. 20, no. 3, pp. 8995, 2013.
[27] S. Chen and L. Tong, “iEMS for large scale charging of electric
vehicles: Architecture and optimal online scheduling, ” in Proc. IEEE
Conf. on Smart Grid Communications. Taiwan: IEEE, pp. 629634, 2012. [28] S. Chen, Y. Ji, and L. Tong, “Large scale charging of electric vehicles,
”in IEEE Power and Energy Society General Meeting, pp. 19, 2012.
[29] “Leaking Electricity Fact Sheet,” Teach Engineering [Online].
Available: http://teachengineering.org/collection/cla /lessons/cla
lesson7 household energy/leaking electricity fact sheet.pdf.
[30] “Standby Power Summary Table, ” Lawrence Berkeley National
Laboratory, 2014, [Online]. Available: http://standby.lbl.gov/summary-table.html.
[31] S.H.S.Newazetal.,“Anewstrategytoimplementsecurityinanarea
using picocell base transceiver station,” 11th International Conference
on Advanced Communication Technology (ICACT 2009), vol.01, no., pp.56,60, 15-18 Feb. 2009.
[32] Y. Simmhan et al., “Cloud-Based Software Platform for Big Data
Analytics in Smart Grids,”Computing in Science & Engineering, vol.15,
no.4, pp.38,47, July-Aug. 2013.
[33] S Aman et al., “Improving Energy Use Forecast for Campus
Micro-grids using Indirect Indicators, ”ICDM Workshops 2011, p.p. 389-397,
2011.
[34] M.Simonov,“Event-DrivenCommunicationinSmartGrid,”
Commu-nications Letters, IEEE, vol.17, no.6, pp.1061,1064, June 2013.
[35] R.Melfietal.,“Measuringbuildingoccupancyusingexistingnetwork
infrastructure,in Proc. IGCC, Jul. 2011, pp. 18.
[36] T. Teixeira, G. Dublon, and A. Savvides, “A survey of human-sensing: Methods for detecting presence, count, location, track, and identity,” ACM Comput. Surveys, vol. 5, no. 1, pp. 5969, 2010.
[37] T. Ekwevugbe, “Advanced Occupancy Measurement Using Sensor
Fusion,” Ph.D. dissertation, Institute of Energy and Sustainable Devel-opment, De Montfort Univ., Leicester, United Kingdom, 2013. [38] Y. Benezeth et al., Towards a sensor for detecting human presence and
characterizing activity,Energy and Buildings, vol. 43, Issues 23, pp.
305-314, Feb.Mar. 2011.
[39] Simulation platform for smart grid communications networks: [Online]. Available: http://www.ee.usyd.edu.au/eLearning/opnet.html.
![Fig. 1. Standby mode power consumption of some popularly used appliances (data source [29], [30]).](https://thumb-us.123doks.com/thumbv2/123dok_us/10119012.2912462/1.918.488.842.409.789/fig-standby-mode-power-consumption-popularly-appliances-source.webp)
![Fig. 2. ThingsGate test-bed at our laboratory (bottom) and internal hardwire setup inside ThingsGate (top) [18].](https://thumb-us.123doks.com/thumbv2/123dok_us/10119012.2912462/2.918.79.447.85.392/fig-thingsgate-laboratory-internal-hardwire-setup-inside-thingsgate.webp)