Weekly Market Action – Friday 30 November 2012 to Friday 7 December 2012
The Australian market finished the week up 1.0% in the week to Friday based on the S&P/ASX 200 Index. Small companies underperformed larger companies, with the Small Ordinaries Index finishing the period down 0.8%.
The best performing sector was the Health Care sector, up 2.9%. CSL Limited (CSL) led the performance rising by 5.9%. The worst performing sector was the Information Technology sector, down 0.7% with SMS Management (SMX) and IRESS Limited (IRE) down 4.3% and 3.2% respectively.
Returns % (excluding distributions)
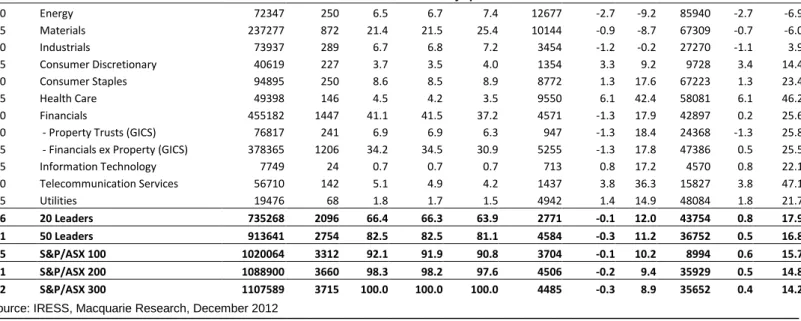
Sector Weekly Period Month Rolling Quarter Rolling Year Rolling Health Care 2.95 8.94 14.36 43.85 Financials ex-Property 1.71 0.57 5.94 13.69 Financials 1.65 0.46 5.47 14.28 Property Trusts 1.38 -0.06 3.19 17.20 Consumer Staples 1.36 4.11 1.85 15.17 Telecoms 1.22 5.15 14.04 34.29 Industrials 0.67 1.48 2.80 -2.89 Consumer Discretionary 0.03 4.66 2.62 4.61 Materials -0.02 -2.29 7.07 -11.54 Energy -0.26 -2.57 -3.40 -12.20 Utilities -0.27 1.83 0.17 11.80 Information Technology -0.74 -0.92 -2.27 16.59
Returns % (excluding distributions)
Index Weekly Period Month Rolling Quarter Rolling Year Rolling Small Ordinaries -0.76 -2.24 -0.35 -8.39 S&P/ASX 200 1.02 0.78 5.22 6.04 S&P/ASX 100 1.12 0.92 5.51 6.93 All Ordinaries 0.84 0.48 4.76 4.70 Source: IRESS
Macquarie Bank Limited makes a market in the securities in respect of CSL Limited. Macquarie and its affiliates collectively and beneficially own or control 1% or more of any class of CSL Limited's equity securities. Macquarie and its affiliates collectively and beneficially own or control 1% or more of any class of SMS Management & Technology Limited's equity securities. Macquarie Bank Limited makes a market in the securities in respect of IRESS Market Technology.
Analyst Certification: The views expressed in this research reflect the personal views of the analyst(s) about the subject securities or issuers and no part of the compensation of the analyst(s) was, is, or will be directly or indirectly related to the inclusion of specific recommendations or views in this research. The analyst principally responsible for the preparation of this research receives compensation based on overall revenues of Macquarie Group Ltd (ABN 94 122 169 279, AFSL No. 318062) (“MGL”) and its related entities (the “Macquarie Group”) and has taken reasonable care to achieve and maintain independence and objectivity in making any recommendations.
General Disclosure: This research has been issued and is distributed in Australia by Macquarie Equities Limited (ABN 41 002 574 923, AFSL No. 237504) ("MEL"), a Participant of the ASX, and in New Zealand by Macquarie Equities New Zealand Limited (“MENZ”) an NZX Firm. Macquarie Private Wealth’s services in New Zealand are provided by MENZ. Macquarie Bank Limited (ABN 46 008 583 542, AFSL No. 237502) (“MBL”) is a company incorporated in Australia and authorised under the Banking Act 1959 (Australia) to conduct banking business in Australia. None of MBL, MGL or MENZ is registered as a bank in New Zealand by the Reserve Bank of New Zealand under the Reserve Bank of New Zealand Act 1989.Any MGL subsidiary noted in this research, apart from MBL, is not an authorised deposit-taking institution for the purposes of the Banking Act 1959 (Australia) and that subsidiary’s obligations do not represent deposits or other liabilities of MBL. MBL does not guarantee or otherwise provide assurance in respect of the obligations of that subsidiary, unless noted otherwise.
This research is general advice and does not take account of your objectives, financial situation or needs. Before acting on this general advice, you should consider the appropriateness of the advice having regard to your situation. We recommend you obtain financial, legal and taxation advice before making any financial investment decision. This research has been prepared for the use of the clients of the Macquarie Group and must not be copied, either in whole or in part, or distributed to any other person. If you are not the intended recipient, you must not use or disclose this research in any way. If you received it in error, please tell us immediately by return e-mail and delete the document. We do not guarantee the integrity of any e-mails or attached files and are not responsible for any changes made to them by any other person. Nothing in this research shall be construed as a solicitation to buy or sell any security or product, or to engage in or refrain from engaging in any transaction. This research is based on information obtained from sources believed to be reliable, but the Macquarie Group does not make any representation or warranty that it is accurate, complete or up to date. We accept no obligation to correct or update the information or opinions in it. Opinions expressed are subject to change without notice. The Macquarie Group accepts no liability whatsoever for any direct, indirect, consequential or other loss arising from any use of this research and/or further communication in relation to this research. The Macquarie Group produces a variety of research products, recommendations contained in one type of research product may differ from recommendations contained in other types of research. The Macquarie Group has established and implemented a conflicts policy at group level, which may be revised and updated from time to time, pursuant to regulatory requirements; which sets out how we must seek to identify and manage all material conflicts of interest. The Macquarie Group, its officers and employees may have conflicting roles in the financial products referred to in this research and, as such, may effect transactions which are not consistent with the recommendations (if any) in this research. The Macquarie Group may receive fees, brokerage or commissions for acting in those capacities and the reader should assume that this is the case. The Macquarie Group‘s employees or officers may provide oral or written opinions to its clients which are contrary to the opinions expressed in this research.
Important disclosure information regarding the subject companies covered in this report is available at www.macquarie.com/disclosures.
Please refer to the important disclosures and analyst certification on inside back cover of this document, or on our website www.macquarie.com/disclosures.
Australia & NZ
Macquarie Marquee Ideas (MMIs)
represent our best alpha-generating ideas.
MMIs represent a collection of Macquarie Research's best ideas derived from our coverage universe. The time frame for each idea is typically three months, with the list reviewed every two weeks. Stocks may be removed from the list earlier than the three month typical duration if the particular MMI has played out and expected outperformance of the idea has materialised. Similarly MMIs may remain on the list for longer than three months if significant alpha is still to be generated.
Selection criteria reflect high levels of analyst conviction and near term catalysts
The MMI list is selected by a group of Macquarie Research Senior Analysts, Strategists, the Quant Team and by Heads of Research. MMI's are typically in line with the analysts' fundamental view. However emphasis is on level of conviction and the existence of catalysts over the next quarter. In order for institutional investors to realistically invest in MMIs, minimum stock turnover requirements have also been considered.
Overleaf are Macquarie’s valuations on all the stocks we cover.
6 December 2012
Macquarie Securities (Australia) Limited
Macquarie Marquee Ideas
The forgotten yield play
Several changes this week after a reasonable period of performance for MMIs. Key additions include SPN (buy), BPT (buy), OSH (buy) and MSB (sell).
Forgotten yield play: We add SPN AusNet to MMIs. SPN continues to provide strong regulated revenue and EBITDA growth (expected 5.3% pa over the next 5 yrs), despite relatively sluggish gas and electricity
consumption. Further, cost control remains strong, particularly in the transmission business.
Although the regulatory environment is tightening for all regulated assets, SPN is currently undervalued compared to its peers by ~0.10x EV/RAB, primarily given the overhang of the 2010 Victorian bushfires. SPN whilst having insurance, obtained a draft ruling from the AER that if insurance cover is adequate, despite spending the insurance budget, as long as there is no gross negligence the additional costs can be passed back through a higher RAB. Finalisation of this decision will largely eliminate the bushfire risk generating an expansion of the RAB by 0.1x. The final decision, which we expect to be in SPN's favour, is due mid-December. At a running yield of 7.7% (pre 34% franking) and IRR of 11-12%, SPN is the most attractive play within the regulated sector.
Adding OSH – expect news flow by year end: OSH trading in-line with core NAV which we see as a good entry point given its low risk upside from greater clarity around the Taza discovery, the ongoing near field appraisal programme and the growing potential for a 3rd train in due course. Indeed, there is no other stock in the sector that can match OSH‟s rich vein of catalysts and medium term production growth.
Adding BPT: We upgraded BPT‟s valuation (+9.5%) and target price (+6.3%)
post its investor day 5th December. While it is still early in the financial year, based on the September quarter run rate, it appears BPT can comfortably deliver the bottom end of the 8.5–9.0mmboe production guidance range.
Including MSB again: The big Teva-oriented catalyst approaches. With Teva updating the market on its R&D strategy on December 11, we see risk Teva may not be as bullish as its partner and that large-scale phase 3 trial for its investigational heart failure product may be smaller and less definitive than what the market currently expects.
We see more upside for CSL, DJS and REA and more downside for CAB and hence they remain MMIs. The MTS catalyst has come and gone resulting in the long WOW / short MTS trade being a success. With the absence of a further trigger we remove it as an MMI.
We release NCM from its MMI shackles after a prolonged period of
underperformance. We are fully aware that the removal of NCM may just be the trigger it needs to commence outperformance!
Macquarie Private Wealth Macquarie Marquee Ideas
6 December 2012 2
Macquarie Marquee Ideas
Macquarie Marquee Ideas*
Rec Code/Stock Start Date Last price FY13 PER TP TSR % Analyst LEADERS
O/P BPT – Beach Energy 06/12/12 1.48 14.8 1.70 16.4 Kirit Hira
O/P CSL – CSL 12/10/12 52.95 22.4 55.00 5.5 Craig Collie
O/P DJS – David Jones 23/03/12 2.50 11.3 3.06 30.1 Rob Blythe
U/P MSB – Mesoblast 06/12/12 5.39 nmf 5.40 0.2 Craig Collie
O/P OSH – Oil Search 06/12/12 7.13 65.7 9.00 26.8 Adrian Wood
O/P SPN – SP AusNet 06/12/12 1.05 11.9 1.23 25.7 Ian Myles
EMERGING LEADERS
U/P CAB – Cabcharge Australia 04/09/12 4.00 6.7 3.00 -15.3 Jodie Bannan
O/P REA – REA Group 04/09/12 18.11 23.6 19.00 7.2 Cameron Pierce
NEW ZEALAND
O/P VCT – Vector 04/09/12 2.65 13.5 3.05 20.8 Stephen Hudson
PAIR TRADES
O/P FMG – Fortescue (LONG) 04/09/12 3.75 9.2 4.10 11.4 Lee Bowers
N AGO – Atlas Iron (SHORT) 04/09/12 1.30 20.5 1.65 27.7 Lee Bowers
O/P MND – Monadelphous (LONG) 21/09/12 21.58 12.3 25.30 24.0 Rikki Bannan
U/P ALQ – ALS (SHORT) 21/09/12 9.61 13.5 8.38 -8.9 Rikki Bannan
O/P ANZ – ANZ Bank (LONG) 15/11/12 24.77 11.4 27.93 18.7 Michael Wiblin
N NAB – NAB (SHORT) 15/11/12 24.31 10.8 25.63 13.4 Michael Wiblin
O/P TOL – Toll Holdings (LONG) 15/11/12 4.56 11.9 4.74 9.6 Russell Shaw
N AIO – Asciano (SHORT) 15/11/12 4.40 12.6 5.04 16.9 Russell Shaw
Source: Macquarie Research, FactSet pricing, December 2012. Note because MMIs can be catalyst driven and have a typical duration of three months, TSR%s (which are annual) may not always align with the MMI.
*Since inception of MMIs in April 2010, we have a winners/losers ratio of 61%/39% and an average non annualised return per trade of +80 bps.
SPN AU – SP AusNet
We have added SP AusNet to our MMI list.
Date became MMI: 06/12/12 SPN AU vs ASX 100, & rec history
Note: Recommendation timeline - if not a continuous line, then there was no Macquarie coverage at the time or there was an embargo period.
Source: FactSet, Macquarie Research, December 2012 (all figures in AUD unless noted)
Recommendation: Outperform
Last Price: AUD 1.05
Price Target: AUD 1.23
TSR %: 25.7
Catalyst: Bushfire litigation, which is
ongoing, however the AER will pass down its final determination on insurance pass-through mid December.
SPN continues to provide strong regulated revenue and EBITDA growth (expected 5.3% pa over the next 5 yrs), despite relatively sluggish gas and electricity consumption. Further, cost control remains strong, particularly in the transmission business. With one of the lowest gearing levels (x5 to ND:RAB) in the sector and strong RAB growth over the next 3-4 years (~7-8%), SPN is well placed for steady distribution growth.
Although the regulatory environment is tightening for all regulated assets, SPN is
currently undervalued compared to its peers by ~0.10x EV/RAB, primarily given the overhang of the 2010 Victorian bushfires. SPN whilst having insurance, obtained a draft ruling from the AER that if insurance cover is adequate, despite spending the insurance budget, as long as there is no gross negligence the additional costs can be passed back through a higher RAB. Finalisation of this decision will largely eliminate the bushfire risk generating an expansion of the RAB by 0.1x. The final decision, which we expect to be in SPN's favour, is due mid-December.
Macquarie Private Wealth Macquarie Marquee Ideas
6 December 2012 3
SPN is trading at a RAB multiple of ~1.16x, a 5-10% discount to peers. The uncertainty around bushfire litigation is slowly disappearing, reducing the risk to investors. Despite AER desires, RAB growth will stay strong for the next 3-4 years as necessary replacement capex in transmission occurs along with incremental investment opportunities like desalination. At a running yield of 7.7% (pre franking) and IRR of 11-12%, SPN is the most attractive within the regulated sector.
OSH AU – Oil Search
We have added Oil Search to our MMI list.
Date became MMI: 06/12/12 OSH AU vs ASX 100, & rec history
Note: Recommendation timeline - if not a continuous line, then there was no Macquarie coverage at the time or there was an embargo period.
Source: FactSet, Macquarie Research, December 2012 (all figures in AUD unless noted)
Recommendation: Outperform
Last Price: AUD 7.13
Price Target: AUD 9.00
TSR %: 26.8
Catalyst: The Taza side track in Kurdistan is
expected to be complete by year end. OSH is targeting a 250-500mmbbl oil discovery and confirmation of the encouraging initial signs could potentially add 60Acps to our risked NAV.
Following the recent cost overrun, it appears Exxon has built in sufficient cushion to avoid further cost overruns. In the downstream, Exxon is confident of plant delivery close to the original U$4bn budget with the facilities ready to receive commissioning gas from Kutubu in April/May 2013, as scheduled. In the upstream Exxon now expects the first Antinov to arrive in mid-February. Management however believes much of this lost time can be recovered by increasing truck deliveries and re-scheduling work and so remains confident that Hides gas will be sent down to the LNG plant in 2Q14.
Exxon already sees sufficient resource in P‟nyang to underpin an 8-10 year contract for a potential expansion train. Meanwhile at Hides, management remains as confident as ever of the resource upside potential in this under-appraised field. Elsewhere in the highlands, we remain convinced of the significant volumes of gas yet-to-be discovered in this under-explored region while TOTAL‟s recent arrival in the Gulf of Papua is a strong endorsement of OSH‟s offshore prospectivity.
OSH trading in-line with core NAV which we see as a good entry point given its low risk upside from greater clarity around the Taza discovery, the ongoing near field appraisal programme and the growing potential for a 3rd train in due course. Indeed, there is no other stock in the sector that can match OSH‟s rich vein of catalysts and medium term production growth.
Macquarie Private Wealth Macquarie Marquee Ideas
6 December 2012 4
BPT AU – Beach Energy
We have added Beach Energy to our MMI list.
Date became MMI: 06/12/12 BPT AU vs ASX 100, & rec history
Note: Recommendation timeline - if not a continuous line, then there was no Macquarie coverage at the time or there was an embargo period.
Source: FactSet, Macquarie Research, December 2012 (all figures in AUD unless noted)
Recommendation: Outperform
Last Price: AUD 1.48
Price Target: AUD 1.70
TSR %: 16.4
Catalyst: Imminent flow rate results from the
Moonta-1 vertical well in the Cooper Basin as well as drilling of a horizontal well commencing in mid-December.
With the next round of fracture stimulation commencing in the Cooper Basin, we expect news flow surrounding the unconventional program will accelerate over coming months. BPT is due to deliver flow rates form the Moonta-1 vertical well in the coming weeks. This will provide further insight into the productivity over the deeper Patchawarra interval (where 9 of the proposed 10 frac have been targeted). BPT will also double hydraulic pumping rates to ~80bbls/min (similar to that used at STO‟ Moomba-191 well), which should also result in improved frac productivity. While BPT delivered initial flow rates of 1.8-2.1mmscf/day from Encounter and Holdfast, the flow rate from Moonta could potentially be as high as ~4mmscf/day. BPT will also commence the first horizontal well targeting the REM shale intervals in mid-December, with flow rates expected early next year.
Following successful appraisal activity at Bauer (which has seen estimated gross reserves grow to ~10mmbbls) and further exploration success at Pennington-1 (where it appears results have substantial exceeded expectations) oil reserves in the Western Flank are expected to grow. Completion of the Hanson production facility in 4Q12, commissioning of the Bauer-to-Lycium pipeline in 1Q13 and completion of Bauer-2&4 as producers will result in further production increases in coming quarters. While it is still early in the financial year, based on the September quarter run rate, it appears BPT can comfortably deliver the bottom end of the 8.5–9.0mmboe production guidance range (excluding any production growth from the Western Flank and Egypt). If we incorporate the growth from Egypt and Western Flank we expect that production will exceed the guidance range.
We upgraded BPT‟s valuation (+9.5%) and target price (+6.3%) post its investor day 5th
December.
MSB AU – Mesoblast
We have added Mesoblast to our MMI list.
Date became MMI: 06/12/12 MSB AU vs Small Ordinaries, & rec history
Note: Recommendation timeline - if not a continuous line, then there was no Macquarie coverage at the time or there was an embargo period.
Source: FactSet, Macquarie Research, December 2012 (all figures in AUD unless noted)
Recommendation: Underperform
Last Price: AUD 5.39
Price Target: AUD 5.40
TSR %: 0.2
Catalyst: Teva R&D strategy
Macquarie Private Wealth Macquarie Marquee Ideas
6 December 2012 5
For some time now MSB management has been providing the market with very positive commentary on (i) the results of its phase 2 heart failure trial, and (ii) that R&D partner Teva will definitely be funding a large-scale phase 3 trial for its investigational heart failure product. With Teva updating the market on its R&D strategy on December 11, we see risk Teva may not be as bullish as its partner and that the trial may be smaller and less definitive than what the market currently expects.
PAIR TRADE – WOW AU – Woolworths (LONG) / MTS AU – Metcash (SHORT)
We have removed the WOW/MTS pair trade from our MMI list.
Our trade has provided an excess return of 7.5% since its addition to the MMI list on 15 November 2012.
We are removing the trade to capture the excess returns earned over the past 3 weeks due to confirmation of MTS's deteriorating performance and downgraded guidance as announced in its HY13 result.
NCM AU – Newcrest Mining
We have removed Newcrest Mining from our MMI list.
NCM has provided an excess return of -38.4% since its addition to the MMI list on 03 February 2012.
While we remain positive on the long-term outlook for Newcrest we see continued uncertainty surrounding the delivery of Cadia East and Lihir MOPU weighing on the stock for the short to medium term.
CSL AU – CSL
Date became MMI: 12/10/12 CSL AU vs ASX 100, & rec history
Note: Recommendation timeline - if not a continuous line, then there was no Macquarie coverage at the time or there was an embargo period.
Source: FactSet, Macquarie Research, December 2012 (all figures in AUD unless noted)
Recommendation: Outperform
Last Price: AUD 52.95
Price Target: AUD 55.00
TSR %: 5.5
Catalyst: Quarterly CMS pricing data
CSL has been a strong performer delivering an excess return of 12% since inception into the MMI on 12th October. And whilst further re-rating of the stock may be difficult, we continue to see upside risk to earnings given the longevity of the revenue drivers currently at play, and potential for ongoing margin expansion.
Withgrowth in China showing no signs of abating, competitor supply constraints creating a positive Ig pricing environment (which could continue for the next two years), and specialty products continuing to grow rapidly, we see CSL comfortably delivering mid-teens EPSg for the next 2-3y – a proposition we believe more than justifies its current multiple. We also see it likely the company's earnings continue to surprise on the upside.
Macquarie Private Wealth Macquarie Marquee Ideas
6 December 2012 6
DJS AU – David Jones
Date became MMI: 22/03/2012 DJS AU vs ASX 100, & rec history
Note: Recommendation timeline - if not a continuous line, then there was no Macquarie coverage at the time or there was an embargo period.
Source: FactSet, Macquarie Research, December 2012 (all figures in AUD unless noted)
Recommendation: Outperform
Last Price: AUD 2.50
Price Target: AUD 3.06
TSR %: 30.1
Catalyst: 2Q sales.
Please refer to Essentials article 23 March 2012, “Zebra loses its $tripe$”.
We have upgraded our recommendation on DJS to Outperform. Why not? We have had the massive downgrade - while guidance for FY12 NPAT is for a 35-40% fall, DJS expect growth in FY13 & 14. Further the financial services earnings have been exposed and DJS are spending a fortune to acquire/develop an online business model which will allow the social customer to engage with the brand at all levels. DJS is fast tracking the development of its brand as a social object not to lead the market but merely to catch-up. While it might be late, it has engaged credible business partners (IBM) to build out a capability and if the brand is relevant and the online piece well executed DJS may just manage to accelerate sales growth.
The share price has not been this low since 2006 and while earnings expectations have tumbled so has the price. We are looking for a relief rally and a “what if” proposition regarding sales. This isn‟t a macro call or even an interest rate cut call, DJS is undervalued and its transformation initiatives could improve perception and ability to compete with the various pure-play online and established Omni Channel Retailers.
CAB AU – Cabcharge Australia
Date became MMI: 04/09/12 CAB AU vs Small Ords, & rec history
Note: Recommendation timeline - if not a continuous line, then there was no Macquarie coverage at the time or there was an embargo period.
Source: FactSet, Macquarie Research, December 2012 (all figures in AUD unless noted)
Recommendation: Underperform
Last Price: AUD 4.00
Price Target: AUD 3.00
TSR %: -15.3
Catalyst: The RBA's revised Guidance
Note is expected imminently . CDC will go to tender for its last NSW bus contract In July 2013 .
The RBA's Payments System Board released a “final” Guidance Note to interpret its decision to vary “Surcharging Standards” effective 18 March 2013. It incorporates a number of changes from the previous draft, including specific references to thetaxi industry as well as pointing to Professor Allan Fels‟ yet to be accepted VIC Taxi Inquiry which suggests regulating service fees so they do not exceed the resource cost of providing electronic payment services – i.e. excluding financial flows between processors, operators and networks. The Fels report has “found no evidence that this (service fee) should exceed 5 per cent of transaction value”.
Cabcharge maintains its business model applies "fees on financial services rather than as a surcharge on the underlying transaction" . We await for any news from Visa and Mastercard as to whether they will be approaching Cabcharge to lower surcharges.
Macquarie Private Wealth Macquarie Marquee Ideas
6 December 2012 7
Professor Allan Fels' Inquiry into the VIC taxi industry is currently sitting with VIC parliament, and a response is expected pre Christmas. If Professor Fels' recommendations are agreed to
by VIC Parliament we expect there will potentially be implications for other states.
The potential impacts on Cabcharge's Taxi Services business, which accounts for ~50% of group revenues, are not easily quantifiable and remain very uncertain given the complexity of the taxi industry, political involvement and CAB‟s perceived “market power”. However, we believe on the balance of probabilities that the company will be negatively impacted by these issues.
Technology change is the other threat which cannot be discounted, with a number of taxi booking apps and smart phone credit card processing devices posing a threat to traditional taxi networks and payment processing terminals longer term. We note NSW taxi regulation which dictates taxi drivers must be a member of a taxi network to operate is due to be reviewed in CY13, and early signs are that technology apps will be on the agenda for discussion.
Cabcharge's associate company, CDC, was assumed to be one of the more stable businesses in the portfolio . However, following the recent loss of 2 of its 3 NSW bus contracts there is now significant contract re-sign risk for the remaining Sydney region which goes to Government tender in July 2013 (Region 3 accounts for >500 buses and together with the other 2 NSW contracts represents >50% of CDC's volume). We expect this third contract will be renewed at significantly lower margins given the competitive tension or otherwise lost completely to another operator.
The Cabcharge business model appears to be under attack on a number of fronts and we do not believe the significant risk and uncertainty has been adequately priced in. Underperform.
REA AU – REA Group
Date became MMI: 04/09/12 REA AU vs Small Ords, & rec history
Note: Recommendation timeline - if not a continuous line, then there was no Macquarie coverage at the time or there was an embargo period.
Source: FactSet, Macquarie Research, December 2012 (all figures in AUD unless noted)
Recommendation: Outperform
Last Price: AUD 18.11
Price Target: AUD 19.00
TSR %: 7.2
Catalyst: Continued above market growth,
AGM commentary, capital management.
REA is a high quality structural growth stock benefitting from the migration of real estate
advertising from print to online.. Its business model and dominant market position are amongst the best in the EL sector.
Despite a 9% reduction in the number of new real estate listings and a 5% reduction in agent numbers in FY12, REA's Australian business grew earnings revenues by 15% and earnings by 16%. The growth was driven by further increases in the average revenue per agent (ARPA) due largely to increased take-up of new products. REA's Italian business, casa.it, also maintained its positive momentum reporting a small profit for the first time. While competitive pressures and a weak economic backdrop remain, this immature market is demonstrating signs of rapid growth.
REA has a strong balance sheet with net cash of $182m. Given the cash generation and circa $100m of surplus franking credits this is scope for capital management initiatives in the absence of acquisition opportunities.
While trading at a premium multiple REA is forecast to continue to deliver well above market growth rates. Strong growth is set to continue into FY13.Key assumptions are 10% ARPA growth, driven by modest price increases and further take up of depth products. Looking further ahead, tweaking of the online offering to allow for premium content upgrades directly transacted with the vendor has the potential to add another lay of revenue growth.
Macquarie Private Wealth Macquarie Marquee Ideas
6 December 2012 8
VCT NZ – Vector
Date became MMI: 04/09/12 VCT NZ vs NZSE50, & rec history
Note: Recommendation timeline - if not a continuous line, then there was no Macquarie coverage at the time or there was an embargo period.
Source: FactSet, Macquarie Research, December 2012 (all figures in AUD unless noted)
Recommendation: Outperform
Last Price: AUD 2.65
Price Target: AUD 3.05
TSR %: 20.8
Catalyst: Nov Supreme and High Crt
rulings; Nov ASM
Our Outperform recommendation is based on the view that the regulator‟s current policy settings for the company's NZ electricity and gas lines businesses (84% of gross asset valuation) are fully reflected in the current share price.
PT is currently $3.05 (TSR +19%) and 5.5% net yield and FCF grows broadly at 5 and 6% pa respectively medium term. The stock is one of our preferred large cap stocks in NZ.
Our upside regulatory case (+$0. 40 ps) is not incorporated in the above valuation; it turns on a re-opening by the High Court of the current allowable RAB for NZ electricity lines businesses. The incorporation by the Court of a more representative replacement cost value as at the beginning of the regulatory period rather than the current short-hand CPI-based roll-forward is a reasonable prospect, in our view (70% chance).
Given that Government-owned Transpower is currently appealing its regulatory WACC and a number of other factors around the composition of the Court, we would now not discount a favourable ruling on the appropriateness of the regulatory WACC (such a ruling would give rise to a similar level of upside as above).
PAIR TRADE – FMG AU – Fortescue Metals Group (LONG) / AGOAU – Atlas Iron (SHORT)
Date became MMI: 04/09/12 FMG AU vs ASX 100, & rec history
Note: Recommendation timeline - if not a continuous line, then there was no Macquarie coverage at the time or there was an embargo period.
Source: FactSet, Macquarie Research, December 2012 (all figures in AUD unless noted)
Recommendation: Outperform
Last Price: AUD 3.75
Price Target: AUD 4.10
TSR %: 11.4
Catalyst: Kings restart decision - December
Date became MMI: 04/09/12 AGO AU vs ASX 100, & rec history
Note: Recommendation timeline - if not a continuous line, then there was no Macquarie coverage at the time or there was an embargo period.
Source: FactSet, Macquarie Research, December 2012
(all figures in AUD unless noted)
Recommendation: Neutral
Last Price: AUD 1.30
Price Target: AUD 1.65
TSR %: 27.7
Macquarie Private Wealth Macquarie Marquee Ideas
6 December 2012 9
Long FMG
Post completion of the near-term industry destock and volatility, we believe market fundamentals dictate iron ore prices with a normalised US$115/t floor over the next few years. As such, we are attracted to the margin and balance sheet leverage that FMG's rapid growth profile (even under its now more staged format) provides to this dynamic. However, this combined leverage clearly also amplifies the downside investment risks should we see a sustained environment of sub-US$105/t iron ore prices (not our base case).
The recent share price rally has left FMG trading broadly alongside our fundamentally driven price target – as is the case with much of our iron ore universe. The potential sale of a significant stake in one of FMG's core assets remains the key wildcard catalyst over the next six
months. Outperform rating and A$4.10ps price target.
On track. All development timelines were reaffirmed at FMG's Pilbara site visit in late October - 95mtpa run rate by end December 2012 and 115mtpa by end March 2013 - and operational management confirmed the company is on track to deliver the expected ~20mt volume in the current quarter.
Core asset stake sales. Nothing new here - FMG continues to be in active discussions with credible parties who have indicated considerable interest. The desire to de-leverage post the peak capital spend and debt levels incurred in the current expansion phase has been
repeatedly emphasised by management.
The Kings push. Management recently confirmed the strength of its desire to reactivate the Kings expansion by Xmas and deliver the full 100mtpa expansion to 155mtpa by December 2013. The hard decision to resequence Kings saw ~15% of the T155 expansion capital deferred but at the implicit cost of ~40% of the expansion volumes. The Kings tonnes are expected to further lower the aggregate production costs of the FMG business post Firetail with C1 production costs of ~US$30/t FOB versus the Chichesters currently at US$45-50/t (Firetail is expected to be ~US$25/t). As such, it is again clear how large the incentive is for FMG to complete the Kings development as rapidly as is practicable - the cost-to-complete capital intensity for T155 after 115mtpa is achieved stands at just US$40-50/t capacity addition.
The enhanced liquidity position. Post the US$5b bank debt refi completed
last month FMG has a pro-forma cash balance at 30 September of US$4.1b (incl Leucadia note repayment and refi costs). US$2.3b of the FY13 capex budget of US$4.6b was spent in the SepQ. First major debt maturity is now in November 2015.
Short AGO
With its sharp margin leverage, AGO is well positioned to benefit from any further short term restock rally in iron ore prices. However, the combination of FMG's sharp margin and balance sheet leverage sees it with greater real and perceived exposure to such a dynamic. We also believe the planned timing of AGO's ramp-up to 12mtpa over the next 15 months is fairly aggressive, versus the FMG ramp-up profile which the market (including us) has chosen to model very conservatively versus guidance.
The timing of the short-term AGO volume growth profile to 12mtpa appears ambitious (specifically the back end - Mt Webber), although this might naturally be slowed anyway in a lower iron ore price environment, notwithstanding the new debt facility. In the end, the key driver of our recently lowered rating was a stretching valuation (NPV A$1.33ps) following AGO's recent rally back above ~A$1.50ps. This situation remains unchanged. Potential bottom-up drivers include a tie-up with other Pilbara players on infrastructure (seemingly unlikely near term) and the fact that AGO remains a nimble, well capitalised and generally lower capital intensity player in the Pilbara, and thus well positioned to capitalise on niche opportunities. Neutral rating and A$1.65ps price target.
A solid operating result. The SepQ was a record sales quarter (6.4mtpa annualised) with C1 cash costs as expected (high A$40’s/t FOB). In saying that, the sales figure was boosted above expectations by an additional shipment of the lower grade Value Fines (~55% Fe) than was expected. The marginal upgrade to FY13 sales guidance was also driven by the same dynamic. Given the market turmoil over the quarter, AGO‟s average realised price of US$98/dmt CFR was encouragingly at a similar discount to the 62% Index as the past couple of quarters (~13%).
Macquarie Private Wealth Macquarie Marquee Ideas
6 December 2012 10
Horizon 1 funded in the new price world. AGO has secured a fully underwritten US$325m secured term loan with a 5-year maturity. As with the recently signed Fortescue facility, it is covenant-lite and expected to have similar pricing. The reality is that this facility, combined with the quarter end cash balance of A$314m, delivers AGO strong certainty on its ability to finance its growth plans to 12mtpa. Whether the company would proceed with Mt Webber development (at least on current timing) should the iron ore price environment soften again is a different question.
Joining the cost-out chorus. Following the seemingly ubiquitous expenditure review process in the Australian iron ore sector at present, AGO has identified several reductions in both operating and capital cost spend (potentially totalling ~A$125m over the next two years) – efficiency driven opex savings of A$1-2/t in FY13, deferral of a significant chunk of long term exploration and evaluation activity and potential phasing/elongation of Mt Webber and off-highway haul road capital spend.
PAIR TRADE – MND AU – Monadelphous Group (LONG) / ALQ AU – ALS (SHORT)
Date became MMI: 21/09/12 MND AU vs ASX 100, & rec history
Note: Recommendation timeline - if not a continuous line, then there was no Macquarie coverage at the time or there was an embargo period.
Source: FactSet, Macquarie Research, December 2012 (all figures in AUD unless noted)
Recommendation: Outperform
Last Price: AUD 21.58
Price Target: AUD 25.30
TSR %: 24.0
Catalyst: Contract wins, 1H13 result in
February
Date became MMI: 21/09/12 ALQ AU vs ASX 100, & rec history
Note: Recommendation timeline - if not a continuous line, then there was no Macquarie coverage at the time or there was an embargo period.
Source: FactSet, Macquarie Research, December 2012 (all figures in AUD unless noted)
Recommendation: Underperform
Last Price: AUD 9.61
Price Target: AUD 8.38
TSR %: -8.9
Catalyst: Extent of seasonal slowdown over
Dec-Feb
Long MND
MND’s guidance for 40% revenue growth in 1H13 and 25% growth for the full-year was well above our prior expectations for 25% and 17% growth respectively (consensus +21% and +15%). MND pointed to an "extraordinary surge in construction activity" as the key revenue driver this year with a number of large EC projects (incl port Hedland SMP, Hope Downs 4, WICET, Kestrel) all ramping up strongly over the past few months. We now forecast a 25% increase in FY13 NPAT to $158m, with 28% revenue growth (41% 1H13) and margins flattish on pcp.
Working to offset margin pressure with productivity, mix should also help. The negative news was that MND is starting to see margins come under pressure as customers increase their focus on cost and tighten discretionary capex/opex. MND is working to offset this via better productivity and cost management as it executes on its current projects. We note MND has a good track record re managing margins, with only a 180bp difference between peak and trough margins over the last few years (low of 9.2% in FY06, high of 11.0% in 2008). A shift in revenue mix may also help to offset margin pressure, given a greater proportion of EC work this year vs last year‟s strong contribution from lower-margin maintenance services.
Macquarie Private Wealth Macquarie Marquee Ideas
6 December 2012 11
Good level of construction revenue visibility, oil & gas to provide the next wave. MND has announced $775m of new work and contract extension since 30 June, in addition to the record $2.0bn awarded over the course of FY12. Together with additional unannounced work and scope expansions, MND has a high level of earnings visibility and is well positioned to deliver strong growth over the next few years. Awards for later stage Structural, Mechanical, Piping (SMP) and Electrical & Instrumentation (E&I) contracts on sanctioned LNG and CSG projects are still 6-18 months away, and should fill the gap once large iron ore expansions reach completion in CY2014. We estimate the potential value of SMP and E&I work for domestic contractors on these projects could be ~US$13-19bn. Oil & gas currently represents ~20- 25% of MND's revenue, although this is expected to increase closer to 30% over the next few years.
Short ALQ
Earnings likely to soften in Q4. ALS has guided for $130-140m of 1H13 NPAT (+27-37% on pcp), however we expect earnings to decline in the 2H as ALS Minerals (~60% of group
earnings) cycles a tough comp (prior year benefited from a shorter than usual seasonal slowdown) and exploration activity softens.
ALQ delivered a solid set of 1H numbers and FY13 guidance consistent with expectations.
Strong top line growth was driven by acquisitions (+12%), with market share gains on the back of lab expansions in Minerals and Coal, and increased geochemical sample flows driving organic growth (+15%). ALQ has provided guidance for $235-255m FY13 NPAT, which compares to our $243m forecast and $251m consensus (suspect the latter moves down to the lower end of guidance range).
Downturn has arrived for Minerals. MD Kilmister noted we are currently in Year One of a two year slowdown for ALQ's Minerals business. Minerals sample volumes have declined in the last few months vs a strong Q1 with the key areas of weakness being North America and Africa. Interestingly Australian volumes are still higher than pcp in part due to a lower junior exposure at 20% vs Minerals' division ~35% exposure. We expect this weaker overall trend to continue through CY2013, and despite a partial offset from the non-Minerals businesses, expect a negative earnings year for ALQ in FY14 (earnings -11%).
Acquisitions remain on the agenda. ALQ remains focused on building a globally integrated Food/Pharma business. There are a number of potential acquisition opportunities, however ALQ remains disciplined (typical multiples are 8x EBITDA for a size <$50m and 10x for something larger). Interestingly the global peers are trading on an average 11.7x EBITDA (these are larger and more diversified TIC businesses). Upstream oil & gas testing/ inspection is also an attractive area but acquisition multiples are higher again.
PAIR TRADE – ANZ AU – ANZ Bank (LONG) / NAB AU – National Australia Bank (SHORT)
Date became MMI: 15/11/12 ANZ AU vs ASX 100, & rec history
Note: Recommendation timeline - if not a continuous line, then there was no Macquarie coverage at the time or there was an embargo period.
Source: FactSet, Macquarie Research, December 2012 (all figures in AUD unless noted)
Recommendation: Outperform
Last Price: AUD 24.77
Price Target: AUD 27.93
TSR %: 18.7
Macquarie Private Wealth Macquarie Marquee Ideas
6 December 2012 12
Date became MMI: 15/11/12 NAB AU vs ASX 100, & rec history
Note: Recommendation timeline - if not a continuous line, then there was no Macquarie coverage at the time or there was an embargo period.
Source: FactSet, Macquarie Research, December 2012 (all figures in AUD unless noted)
Recommendation: Neutral
Last Price: AUD 24.31
Price Target: AUD 25.63
TSR %: 13.4
Catalyst: FY12 AGM
Long ANZ
ANZ recently confirmed an aspirational target of 2pp reduction in the Group cost-to-income ratio over the next three years at the FY12 results and showed their commitment with a 30bp YoY CI reduction - this announcement came in unison with a commitment to continue focusing on returns which will no doubt help the cost-to-income reduction. We believe cost out in Australia and NZ could deliver 1pp+ of this reduction. The cost-out is two-fold, 1) the "Banking on Australia" strategy launched in early October which aims to shrink the branch space by 36%, leading to a 25% reduction in property expense. 2), ANZ is restructuring its NZ division, ANZ/National operations, consolidating brands and branches.
Asia showing signs of recovery, ANZ best placed to leverage off the region – our MRE Asian
bank analysts imply the Asia region is at a turning point with strong income and volume growth achievable in the Wholesale banking and trade finance operating areas in FY13. ANZ with its established Asian franchise is best placed of the Majors to leverage off the 2013 Asia turnaround story.
Mike Smith has de-risked ANZ over the last 4 years, so, unlike 2008, we anticipate ANZ will do better on BDDs in this slowdown – Unlike peers ANZ is less exposed to WA with the Group having a preference for non-interest income revenue streams such as trade finance and forex. In addition we believe the experience of CEO Mike Smith is likely to show through during this downturn, as opposed to 2008, with ANZ‟s book much cleaner than before.
Short NAB
NAB – UK macro economic outlook still bleak: the UK macro economic outlook continues to look bleak with negative GDP growth forecast until 1H13. As a result, NABs UK banking division is likely to still feel the pressure in 1H13 despite the provisioning top-up in 2H12 and the continuation of the restructuring program.
NAB – Largest business banking exposure in WA and QLD: NAB has the largest WA and QLD business banking asset exposure amongst the majors (closely followed by WBC). We continue to maintain our macro economic thesis, that a business banking BDD cycle will play out in FY13, and as a result, NAB will be hit hardest of the majors.
NAB – Lowest coverage amongst peers heading in to softer economic conditions: as at Sep-12, NAB has the lowest impaired asset coverage amongst peers (NAB, 65%; WBC, 87%; ANZ, 87%; and CBA, 100%). Stripping out the UK, coverage levels increases to 75%, still 13pp below peers.
NAB – Trading at a discount, but doesn’t mean the discount can’t get bigger: NAB is trading at a 0.1x price to book discount to ANZ and 0.35-0.81x price to book discount to the retail banks (WBC and CBA). Given the UK burden, the higher risk corporate book and the possibility of further negative catalysts for NAB, there is always a possibility that NAB could trade at a greater discount as these uncertainties linger.
Macquarie Private Wealth Macquarie Marquee Ideas
6 December 2012 13
PAIR TRADE – TOL AU – Toll Holdings (LONG) / AIO AU – Asciano (SHORT)
Date became MMI: 15/11/12 TOL AU vs ASX 100, & rec history
Note: Recommendation timeline - if not a continuous line, then there was no Macquarie coverage at the time or there was an embargo period.
Source: FactSet, Macquarie Research, December 2012 (all figures in AUD unless noted)
Recommendation: Outperform
Last Price: AUD 4.56
Price Target: AUD 4.74
TSR %: 9.6
Catalyst: We expect TOL will be able to sell
its Japanese assets for at least $110m in the next few months which should be positively received by the market
Date became MMI: 15/11/12 AIO AU vs ASX 100, & rec history
Note: Recommendation timeline - if not a continuous line, then there was no Macquarie coverage at the time or there was an embargo period.
Source: FactSet, Macquarie Research, December 2012 (all figures in AUD unless noted)
Recommendation: Neutral
Last Price: AUD 4.40
Price Target: AUD 5.04
TSR %: 16.9
Catalyst: Commentary at the AGM is likely
to reflect soft intermodal and port volumes.
Long TOL
Despite the less than optimistic near term outlook for domestic freight we believe all of the bad news is already factored into TOL's share price, and little credit has been given to Management for its attempts to unite the various Toll brands within Australia with the intention of generating
additional cross-selling opportunities. In FY13 TOL's exposure to resources should see overall growth in Australia, with Gorgon only 20% of the way through its construction phase and several other opportunities for contract wins across Gladstone LNG, Wheatstone and Inpec.
One of the drags on performance has been the Japanese Footwork Express business which TOL wrote down to ~$220m last year. We believe the market is valuing this at close to zero given its poor earnings track record, however we remain confident Management will be able to exit this business with proceeds in excess of $100m, which is roughly the value of the properties and PPE in the business. This would also remove an ongoing drag of ~$5m pa.
Despite being near the bottom of the earnings cycle TOL is trading below a market multiple and yet offers a ~6% dividend yield which is fully cash covered. TOL remains positively leveraged to any recovery in the Australian economy as well as globally through its global forwarding business.
Short AIO
We recently cut our recommendation on AIO to Neutral from Outperform, cutting our target price from $6.35 to $5.21 on account of lower longer term margin expectations in the Terminals and Logistics Business, as well as weaker container volume growth anticipated in FY13.
Whilst we still see value in AIO we struggle to see the share price closing the gap with our valuation, given the AGM is likely to reflect soft commentary around the ports and in intermodal rail. Commencement of operations by the third entrant at Brisbane could see some price discounting, and investors are likely to adopt a wait-and-see approach to extrapolate pricing and market share shifts at Brisbane across to Botany Bay and Port of Melbourne in FY15 and FY17 respectively,
We expect 1Q coal volumes to be relatively strong although from a customer standpoint the outlook is far less certain, with patchy end user demand likely to see a deferral of new projects and existing volume ramp-ups.
Macquarie Private Wealth Macquarie Marquee Ideas
6 December 2012 14
Macquarie Marquee Ideas – Performance
Code/Stock Type Start Date Excess return since
inception %*
Excess return over last week %*
DJS – David Jones Buy 22/03/12 3.2 1.5
REA – REA Group Buy 04/09/12 8.2 -1.7
CAB – Cabcharge Sell 04/09/12 34.8 -3.0
VCT – Vector Buy 04/09/12 -8.7 -0.2
CSL – CSL Buy 12/10/12 12.9 1.7
FMG Long / AGO Short Pairs 04/09/12 4.7
MND Long / ALQ Short Pairs 21/09/12 -1.7
TOL Long / AIO Short Pairs 15/11/12 7.0
ANZ Long / NAB Short Pairs 15/11/12 -1.7
M a c qu a rie Priv a te W e a lth M a c q u a rie M a rq u e e I d e a s 6 De c e m b e r 2 0 1 2 15
MMI Performance – All ideas (singles stocks and pair trades; includes positions currently still active) 22/04/2010 - 06/12/12 – Avg return: 0.8%, 61% winners & 39% losers
Macquarie Private Wealth Macquarie Marquee Ideas
6 December 2012 16
Macquarie Research earnings revisions
The table below highlights all earnings revisions during the past week. Earnings revisions are classified as either upwards or downwards according to their overall % change in EPS for FY1, FY2 and FY3. Earnings forecasts are adjusted earnings. Note: All figures are in the currency in which the company reports.
Adjusted Profit EPS
Ccy From To % Chg. From To % Chg. Reason
Upward Revisions
Air New Zealand NZD 06/13 128.47 146.15 13.8% 11.65 13.35 14.6% Updated model for profit update. See Essentials 29 November.
(AIR.NZ) 06/14 132.29 178.07 34.6% 11.92 16.56 38.9%
06/15 91.69 142.26 55.2% 8.21 13.22 61.0%
Argosy Property
Trust NZD 03/13 33.37 35.67 6.9% 6.02 6.34 5.3% Updated for 1H13 results.
(ARG.NZ) 03/14 30.28 31.22 3.1% 5.43 5.51 1.4%
03/15 30.74 31.67 3.0% 5.48 5.56 1.3%
CSL AUD 06/13 1138.76 1180.64 3.7% 228.34 236.79 3.7% Upgraded FY13 guidance. See Essentials 28 November.
(CSL.AU) 06/14 1283.30 1351.81 5.3% 266.28 280.49 5.3%
06/15 1485.01 1560.30 5.1% 309.07 324.74 5.1%
DUET Group AUD 06/13 84.88 96.36 13.5% 7.36 8.36 13.6% Update for AMI accounting policy which differs from cashflow. (DUE.AU) 06/14 132.31 139.97 5.8% 11.29 11.95 5.9% Income is better cashflow in coming years.
06/15 177.66 190.19 7.0% 14.96 16.03 7.2%
Fisher & Paykel
Healthcare NZD 03/13 70.18 69.65 -0.8% 12.97 12.99 0.2% Updating for first half result.
(FPH.NZ) 03/14 77.29 68.59 -11.3% 13.93 12.50 -10.3%
03/15 72.17 62.40 -13.5% 12.69 11.09 -12.6%
Lycopodium AUD 06/13 22.27 22.33 0.3% 57.61 57.77 0.3% Updated for AGM commentary. See Essentials 22 November.
(LYL.AU) 06/14 23.52 18.16 -22.8% 60.84 46.98 -22.8%
06/15 24.79 19.27 -22.3% 64.13 49.84 -22.3%
Monadelphous
Group AUD 06/13 148.62 160.45 8.0% 162.29 175.05 7.9% FY13 eps +7.9%, FY14 +8.5% reflecting expectations of stronger (MND.AU) 06/14 163.56 177.65 8.6% 178.40 193.61 8.5% revenue growth. See Essentials 21 November.
06/15 174.55 191.59 9.8% 190.26 208.65 9.7%
Oil Search USD 12/12 132.97 149.71 12.6% 9.98 11.24 12.6% Adjusted forecasts following PNG site tour. See Essentials 23
(OSH.AU) 12/13 146.57 150.81 2.9% 10.95 11.26 2.9% November
12/14 366.64 378.98 3.4% 27.24 28.16 3.4%
Programmed
Maintenance AUD 03/13 29.20 30.47 4.3% 24.50 25.56 4.3% Increased FY13 EPS by 4.3% reflecting lower interest and tax, (PRG.AU) 03/14 30.85 32.93 6.7% 25.88 27.63 6.7% partially offset by weaker Property Services earnings. See
03/15 31.43 36.17 15.1% 26.37 30.35 15.1% Essentials 22 November.
Qantas Airways AUD 06/13 241.71 242.91 0.5% 10.67 10.81 1.3% Updated for 1H13 guidance. See Essentials 16 November.
(QAN.AU) 06/14 359.31 330.55 -8.0% 15.86 15.13 -4.6%
06/15 359.29 329.08 -8.4% 15.85 15.05 -5.1%
Resource Generation AUD 06/13 -2.43 -2.43 0.0% -0.94 -0.94 0.0% No change to FY13E EPS. Minor change to FY14E EPS. See
(RES.AU) 06/14 -8.61 -7.94 7.7% -3.34 -3.08 7.7% Essentials 4 December.
06/15 -17.56 -17.48 0.5% -6.81 -6.78 0.5%
Rio Tinto USD 12/12 8071.98 8321.74 3.1% 435.88 449.36 3.1% Rio Tinto Sydney Investor Seminar. See Essentials 3 December.
(RIO.AU) 12/13 9465.44 9943.51 5.1% 511.12 536.94 5.1%
12/14 9427.20 10376.42 10.1% 509.06 560.31 10.1%
Santos AUD 12/12 581.20 592.96 2.0% 61.01 62.13 1.8% Adjusted forecasts following investor day. See Essentials 23
(STO.AU) 12/13 695.00 655.92 -5.6% 72.14 67.17 -6.9% November
12/14 813.95 736.93 -9.5% 83.90 74.15 -11.6%
Seven Group
Holdings AUD 06/13 308.28 356.36 15.6% 99.39 114.82 15.5% Updated FY13 assumptions following AGM. See Essentials 16
(SVW.AU) 06/14 326.34 331.12 1.5% 105.19 106.72 1.5% November.
06/15 345.52 356.26 3.1% 111.34 114.79 3.1%
Tatts Group AUD 06/13 210.97 220.57 4.6% 15.34 16.03 4.5% Incorporation of SA Lotteries transaction, as well as (TTS.AU) 06/14 218.38 227.19 4.0% 15.64 16.26 4.0% adjustments to FY13 to reflect recent jackpot activity in Tatts
06/15 231.42 243.54 5.2% 16.35 17.19 5.2%
Downward Revisions
Austal AUD 06/13 33.72 20.50 -39.2% 17.92 7.77 -56.6% Updated for capital raising. See Essentials 27 November.
(ASB.AU) 06/14 58.45 45.93 -21.4% 31.06 12.68 -59.2%
06/15 62.03 48.89 -21.2% 32.96 13.50 -59.1%
.
Ausdrill AUD 06/13 138.06 125.90 -8.8% 44.61 40.59 -9.0% Updated for profit warning. See Essentials 23 November.
Macquarie Private Wealth Macquarie Marquee Ideas
6 December 2012 17
Adjusted Profit EPS
Ccy From To % Chg. From To % Chg. Reason
06/15 172.99 147.12 -15.0% 54.53 46.03 -15.6%
Aurora Oil & Gas USD 12/12 75.23 56.37 -25.1% 16.89 12.89 -23.6% 3Q12 results.
(AUT.AU) 12/13 193.66 136.47 -29.5% 42.66 29.97 -29.7%
12/14 246.45 165.25 -32.9% 54.28 36.29 -33.1%
Bendigo and
Adelaide Bank AUD 06/13 376.70 350.89 -6.9% 93.01 86.63 -6.9% Downgrades to reflect the margin pressure and some upside from (BEN.AU) 06/14 422.53 399.84 -5.4% 102.90 97.42 -5.3% the potential acquisition of Southern Financial Group Limited.
06/15 481.92 456.14 -5.3% 115.77 109.72 -5.2%
Boart Longyear USD 12/12 151.77 118.23 -22.1% 32.91 25.64 -22.1% FY12 eps down 22% reflecting earnings downgrade and FY13 eps (BLY.AU) 12/13 90.51 48.81 -46.1% 19.63 10.58 -46.1% down 46% due to lower run rate and price declines. See
12/14 97.05 67.62 -30.3% 21.04 14.66 -30.3%
Cardno AUD 06/13 94.98 84.51 -11.0% 67.46 60.03 -11.0% Earnings adjustments post announcement re 1H13 guidance. See (CDD.AU) 06/14 100.81 88.30 -12.4% 71.26 62.42 -12.4% Essentials 22 November.
06/15 106.39 92.93 -12.7% 74.89 65.42 -12.6%
Chorus NZD 06/13 155.55 149.58 -3.8% 40.41 38.86 -3.8% Draft UBA and final UCLL pricing decision from the regulator. (CNU.NZ) 06/14 153.61 148.08 -3.6% 39.90 38.47 -3.6% See Essentials 4 December.
06/15 149.86 123.31 -17.7% 38.93 32.03 -17.7%
Drillsearch Energy AUD 06/13 37.01 35.87 -3.1% 9.58 8.82 -7.9% Adjusted forecasts following A$50m capital raising. See (DLS.AU) 06/14 59.23 58.95 -0.5% 15.33 13.87 -9.5% Essentials 20 November
06/15 34.65 39.64 14.4% 8.97 9.33 4.0%
Energy Resources of
Australia AUD 12/12 -112.26 -141.27 -25.8% -21.68 -27.29 -25.8% Analyst roundtable and revised production and earnings guidance, (ERA.AU) 12/13 -154.47 -166.71 -7.9% -29.84 -32.20 -7.9% See Essentials 28 November.
12/14 -116.76 -126.55 -8.4% -22.55 -24.44 -8.4%
Fleetwood
Corporation AUD 06/13 45.15 38.21 -15.4% 73.76 62.53 -15.2% Updated assumptions following AGM. See Essentials 26 November.
(FWD.AU) 06/14 50.29 44.79 -10.9% 80.66 71.93 -10.8%
06/15 51.60 45.78 -11.3% 81.29 72.20 -11.2%
GrainCorp AUD 09/13 179.61 174.72 -2.7% 78.76 76.62 -2.7% FY13 earnings -3% largely reflecting higher depreciation. FY14 (GNC.AU) 09/14 146.14 152.11 4.1% 64.05 66.66 4.1% +4%, FY15 and FY16 +10% and +15% respectively reflecting
09/15 152.99 168.41 10.1% 67.04 73.81 10.1%
realisation of ~80% of incremental $110m EBITDA target. See Essentials 16 November.
GR Engineering
Services AUD 06/13 13.35 9.32 -30.2% 8.90 6.21 -30.2% Updated for profit warning. See Essentials 20 November.
(GNG.AU) 06/14 14.64 11.75 -19.8% 9.76 7.83 -19.8%
06/15 15.35 12.23 -20.3% 10.24 8.16 -20.3%
Henderson Group GBP 12/12 135.86 130.95 -3.6% 12.64 12.18 -3.6% We have updated our estimates for the latest market assumptions
(HGG.AU) 12/13 130.97 121.95 -6.9% 12.19 11.35 -6.9% and 3Q IMS.
12/14 143.70 134.26 -6.6% 13.37 12.49 -6.6%
Kiwi Income Property
Trust NZD 03/13 65.12 59.38 -8.8% 6.60 6.02 -8.8% Minor adjustments post 1H13 result.
(KIP.NZ) 03/14 68.14 63.75 -6.4% 6.80 6.37 -6.3%
03/15 73.57 68.70 -6.6% 7.00 6.56 -6.4%
Molopo Energy AUD 06/13 -0.89 -3.49
-290.6% -0.36 -1.42
-290.6% Adjusted forecasts following October ops update. See Essentials (MPO.AU) 06/14 36.41 30.77 -15.5% 13.83 10.84 -21.6% 30 November.
06/15 70.90 66.66 -6.0% 20.68 17.86 -13.7%
NRW Holdings AUD 06/13 104.93 85.46 -18.6% 37.62 30.64 -18.6% Updated for profit warning. See Essentials 29 November.
(NWH.AU) 06/14 108.11 88.46 -18.2% 38.76 31.72 -18.2%
06/15 112.19 92.12 -17.9% 40.23 33.03 -17.9%
Oakton AUD 06/13 12.06 10.70 -11.3% 13.22 11.76 -11.1% Reduced FY13 EPS by 11.1% reflecting reduced Federal Government (OKN.AU) 06/14 14.87 11.95 -19.7% 16.24 13.09 -19.4% demand. See Essentials 22 November.
06/15 16.07 12.68 -21.1% 17.53 13.88 -20.8%
Regis Resources AUD 06/13 229.25 203.28 -11.3% 47.41 41.94 -11.5% November production update. See Essentials 29 November.
(RRL.AU) 06/14 323.57 320.89 -0.8% 65.92 65.37 -0.8%
06/15 260.13 255.54 -1.8% 52.99 52.06 -1.8%
Seek AUD 06/13 151.46 143.78 -5.1% 44.95 42.67 -5.1% FY13 AGM trading update sees downgrade from soft employment (SEK.AU) 06/14 168.37 162.84 -3.3% 49.97 48.33 -3.3% conditions, investment in JobsDB and currency headwinds. See
06/15 188.20 182.20 -3.2% 55.85 54.07 -3.2% Essentials 30 November.
Sims Metal Mgmt AUD 06/13 114.48 87.32 -23.7% 55.89 42.63 -23.7% Sale of Arizona operations. See Essentials 4 December.
(SGM.AU) 06/14 176.16 145.15 -17.6% 86.00 70.86 -17.6%
06/15 229.29 217.64 -5.1% 111.94 106.25 -5.1%
Macquarie Private Wealth Macquarie Marquee Ideas
6 December 2012 18
Adjusted Profit EPS
Ccy From To % Chg. From To % Chg. Reason
Estates
(TWE.AU) 06/14 143.82 141.59 -1.5% 22.17 21.83 -1.5% and planned V13 crush. See Essentials 26 November.
06/15 111.30 150.44 35.2% 17.10 23.15 35.4%
Macquarie Private Wealth Macquarie Marquee Ideas
6 December 2012 19
Macquarie Research recommendation changes
Note: All figures are in the currency in which the company reports.
Recommendation
Company From To Comment
Upward
Revisions
Henderson
Group NEUTRAL OUTPERFORM We have upgraded our rating to Outperform reflecting the leverage to European asset re-rating, the stocks
(HGG.AU) discounted earnings rating and premium yield.
Lynas
Corporation UNDERPERFORM OUTPERFORM Upgrade to Outperform, increased confidence in LAMP start up now that concentrate has arrived in Malaysia.
(LYC.AU) See Essentials 23 November.
Treasury Wine
Estates UNDERPERFORM NEUTRAL Upgrade to Neutral. We think it is unlikely current management will undertake an in species distribution to
(TWE.AU) create TPWC, but somebody else might. See Essentials 26 November.
Downward
Revisions
Boart
Longyear NEUTRAL UNDERPERFORM Downgrade to Underperform. A second significant downgrade within 3 months is disappointing and another hit (BLY.AU)
to management credibility. Despite earnings cuts there is no certainty that we've reached an earnings bottom. See Essentials 20 November
Fleetwood
Corporation OUTPERFORM NEUTRAL Downgrade to Neutral. Fleetwood has a sound balance sheet, exposure to long-term growth industries (FWD.AU) (Retirement, Recreation and Resources) and a solid dividend yield. See Essentials 26 November.
Mirvac Group OUTPERFORM NEUTRAL Downgrade to neutral with the share price now in our valuation range. See Essentials 29 November.
(MGR.AU)