Wayne State University Kinesiology, Health and Sport Studies College of Education
1-1-2012
Planned Missingness Study Design: Two Methods
to Developing the Study Survey Versions
E. Whitney G. Moore
University of Kansas, [email protected]
This Article is brought to you for free and open access by the College of Education at DigitalCommons@WayneState. It has been accepted for inclusion in Kinesiology, Health and Sport Studies by an authorized administrator of DigitalCommons@WayneState.
Recommended Citation
Moore, E. W. G. (2012). Planned Missingness Study Design: Two methods to developing the study survey versions (Report No. KUANT 023.1). Retrieved Septmeber 15, 2017 fromhttp://crmda.ku.edu/guide-23-planned_missing
Planned Missingness Survey Design
This section will walk you through the steps in developing the different survey versions necessary for a planned missingness study. The initial step in designing the planned
missingness surveys is to develop the MASTER survey. To make future steps as simple as possible, ensure that a) all the items – including demographic and identifying items – are included in the proper order and layout, and b) all spelling and grammatical issues have been resolved. This MASTER survey will then serve as your template for the different versions that will be designed to represent its information. In the example walk through, three versions (i.e., 1-3) were made from the MASTER survey.
Once the MASTER survey is finalized, the first decisions to be made are regarding the common portion. The common portion will be: a) present on all versions, b) the first section of all survey versions, and c) comprise the items best for informing the missing data imputation process (after all the data has been collected). Therefore, any demographic information should be part of the common portion. Additionally, the most informative items should be part of this common portion. These items can be: a) the highest loading (e.g., most predictive) items from each scale, and/or b) the items from the scales that are most central to the research question. We will be walking through the first option below, because in most cases this design would be
expected to provide the greatest amount of information for the missing data imputation process.
Preliminaries
A planned missingness data study design takes advantage of modern techniques for handling data missingness that is MCAR (Missing Completely at Random) and MAR (Missing at
Random) (Brown, 2006; Enders, 2010). As modern data imputation techniques have
improved, this study design option has become a powerful, cost-effective option for collecting the most data across the largest sample possible, while keeping the fatigue effect and expense of the study minimized (Little, 2010a, 2010b, 2012). The purpose of this guide is to provide an applied example for designing the surveys necessary when conducting a planned missingness research study design.
The theory behind a planned missingness study design is that there is common information, which all participants provide that is best at informing the missing data imputation process. In addition to this common portion, each survey is also comprised of aspects that perfectly overlap with other survey versions, but does not overlap with any of the other versions in its entirety (see Figure 1). For example, if three versions were developed from the MASTER survey, then each version could have at least a 66% item overlap with any other version (assuming all portions were equal).
KU
ANT
Guides
Planned Missingness Study Design:
Two methods to developing the study survey versions.
Moore, E.W.G. (2012)
www.quant.ku.edu
Guide No.
Design Option 1:
The items are divided into the following portions1: A, B, C, and Common. The Common portion is developed before the A-C portions. Based upon prior research (your own and the field's literature) select the highest loading and most representative items from each scale for the Common portion. Be sure that if there are true sub-scales present to have at least one representative item from each sub-scale included in the Common portion. It is important to remember that the scale's items do not need to be equally divided among the Common, and A-C portions. There may only be one or two items in the A-Common portion, while there are 6 or 7 items in the A-C portions. Once the Common items have been selected, then the remaining items can be as evenly distributed as possible across the three portions (e.g., A-C). Evenly distributing the items entails taking item content and loading strength into account. Additionally, it is important to be sure the items sound as non-repetitive as possible within each portion (e.g., A, B, and C), since the participants will be seeing fewer items per construct to respond to. In general, if the items are divided so that the construct is as well represented as possible on each portion (e.g., A, B, and C), then repetition should be minimized to some extent.
Utilizing a planned missingness survey design also enables researchers to use the long-form version of scales for measurement, rather than using the short-form scales. By using the long-form versions and dividing the items among the different portions, the construct measurement is being optimized without increasing the risk of fatigue effects on the participants’ responses. If there are 3 or fewer items in a subscale, then a theory- and knowledge-driven decision must be made regarding how the items will be divided: a) all in Common, b) one per portion A, B, and C, (e.g., none in Common), or c) one in Common and one in two of the A-C portions. Option A means that everyone will answer this scale in its entirety. If this is a very important scale to the research question, then this decision would be supported. Option B means that everyone will answer at least two, and in one case all three, of the scale's items. If this scale is important, but one item is clearly the strongest predictor, then this decision would have support. Option C means that everyone will answer two questions; however, no one item will be answered by all individuals. If the scale is not the primary research interest, and/or the items are all equally strong predictors of the construct, then this may be a supported decision.
Design Option 2:
The Common portion is comprised of a select few scales, in addition to the demographic and descriptive information items. The research question’s most central scales are the one’s included in the Common portion. The remainder of the research question’s scale items can be divided either: a) only among the A-C portions, or b) across the Common and A-C portions. An example of when it would be preferable to include an entire scale in the Common portion would be when the researcher is testing a scale’s psychometric properties. Including this scale in the Common portion would be very justifiable in this case, as the strength of the loadings are not yet known for this scale; thus, meaning any item distribution across the portions would be poorly informed, if at all.. Additionally, even if the scale is hypothesized apriori to be measuring a single construct, it is possible that upon analysis two constructs are revealed to have been measured by this single scale. Not knowing this, the items could be divided into the A, B, and C portions in a pattern that did not measure both constructs equitably across the different survey versions. When a scale’s psychometric properties are being evaluated, the items from the scales used to measure the criterion variables could then be divided among the A-C portions, or across the Common as well as the A-C portions.
1 A-C portions have been used here, because they match our example and provide at least 66% overlap between any two of the three resultant versions. Based upon the survey size and design, more portions, and versions, may be involved.
Example Walk Through (Design Option 1)
Step 1: Master Survey Chart Coded (Common, Portion A, Portion B, Portion C)
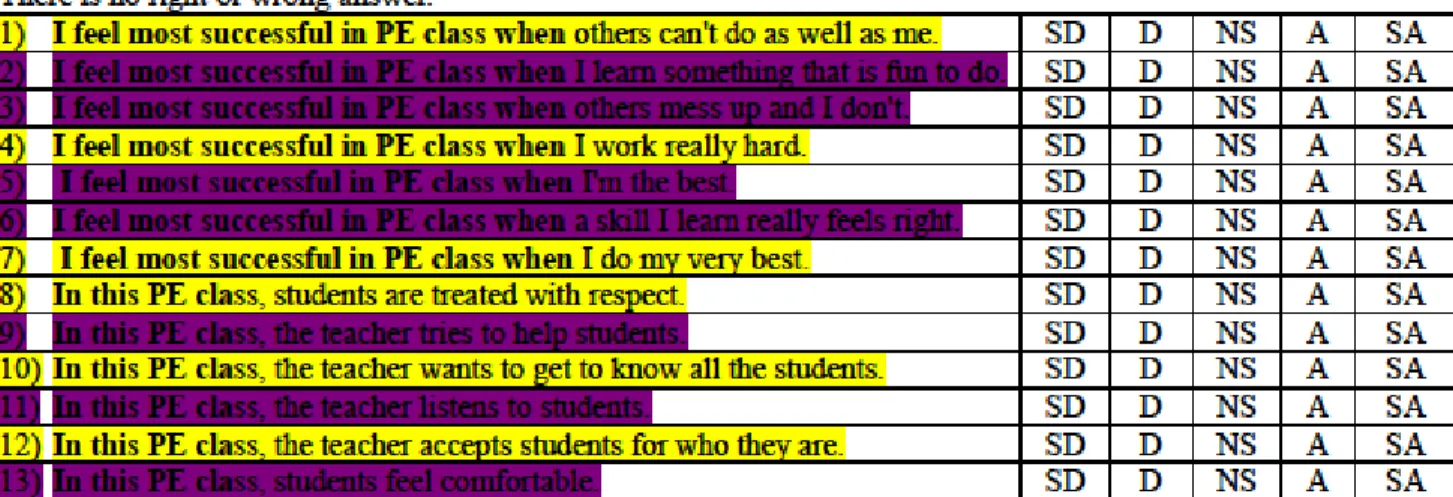
Figure 1 shows the items for the first two scales from a MASTER Survey coded for inclusion in either the Common, A, B, or C portions. The scale on the left has no subscales, therefore the items selection of the Common portion was based upon item loading strength and having good coverage over the concepts comprising the scale’s construct. The scale on the right is comprised of two subscales. Therefore, items were divided first by subscale, and then examined by loading strength and sub-scale construct coverage. One item from each sub-scale stood above the rest for loading strength and therefore these two items were selected for the Common portion. The rest of the items were divided based upon sub-scale construct representation and loading strength to ensure that each of the portions (e.g., A-C) have as equally strong predictive items as possible; thus, making each portion’s item strength for each sub-scale is as similar as possible.
Step 2: Compiling the Common Portion for the Final Survey Versions (1-3)
Figure 2 shows the common portion of the survey based upon the MASTER Survey coding for the two scales above. The common scale items start on the survey after the demographic and descriptive information items, which are also part of the survey’s overall Common section. Thus, the beginning for each survey version (e.g., 1-3) is exactly the same. This increases the likelihood that participants will complete the information most useful for informing the missing data imputation process. For illustrative purposes, only items from the two scales coded in Figure 1 for inclusion in the Common portion have been shown below in their Final Survey format.
Step 3: Compiling the A and B portions for the Final Survey Version 1
Figure 3 shows the Final Survey Version 1 items that appear after the Common portion. The items shown are color-coded to illustrate the different portion (e.g, A or B) that the item was assigned in Figure 1. In this example, because there are three final survey versions (1-3) being made from the combination of the portions A-C, each version will include two of these portions. Version 1 was developed by combining the items from portion A and portion B. These items were combined so that all items from the same scale appeared together. There may be research designs in which this would not be the suggested approach. Organizing the items, so that the participant responds to similar scale material before switching to another scale’s material is a straight forward and logical approach.
Step 4: Compiling the B and C portions for the Final Survey Version 2
Figure 4 shows the Final Survey Version 2 items that appear after the Common portion. The items shown are color-coded to illustrate the different portion (e.g, B or C) that the item was assigned in Figure 1. In this example, Version 2 was developed by combining the portion B and C items.
Step 5: Compiling the A and C portions for the Final Survey Version 3
Figure 5 shows the Final Survey Version 3 items that appear after the Common
portion. The items shown are color-coded to illustrate the different portion (e.g, A or C) that the item was assigned in Figure 1. In this example, Version 3 was developed by combining the portion A and C items.
Note: Other KUant Guides focus specifically on the theory behind, and techniques for performing multiple imputation. Suggested KUant Guides are included in the References.
References
Brown, T. A. (2006). Confirmatory Factor Analysis for Applied Research. New York: Guilford Press.
Enders, C. (2010). Applied missing data analysis. New York, New York: The Guilford Press. Geldhof, G. J., Selig, J. P., McConnell, E. K., & Schoemann, A. M. (2010). Multiple Imputation.
(KUant Guides # 8.2). Retrieved from the Center for Research and Data Analysis Website: http://web.ku.edu/~quant/cgi-bin/mw0/index.php?title=KUant_Guides Lee, J. (2008). Monte Carlo Simulation in Mplus. (KUant Guides #12.1). Retrieved from the
Center for Research and Data Analysis Website: http://web.ku.edu/~quant/cgi-bin/mw0/index.php?title=KUant_Guides
Little, T. D. (2010a). Structural Equation Modeling: Advanced Longitudinal Modeling. Paper presented at the University of Kansas Summer Institutes in Statistics, Lawrence, KS. Little, T. D. (2010b). Structural Equation Modeling: Foundations and Extended Applications.
Paper presented at the University of Kansas Summer Institutes in Statistics, Lawrence, KS.
Little, T. D. (2012). Longitudinal structural equation modeling: Individual difference panel models. New York: Guilford press.
Little, T. D., McConnell, E. K., Howard, W. J., & Stump, K. N. (2008). Missing Data in Large Data Projects: Two methods of missing data imputation when working with large data projects. (KUant Guides #11.3). Retrieved from the Center for Research and Data