1
Demonstrating academic library impact to faculty: A case study
Masami Yamaguchi and Joanna RichardsonLibrary and Learning Services, Griffith University, Australia
Abstract
Purpose – This paper describes the approach taken by an Australian university library in using data visualisation to increase academic / library staff collaboration.
Design / methodology / approach – The authors have undertaken a critical review of the literature as the foundation for their case study, which presents observations and reflections arising from their first-hand experience with infographics.
Findings –The use of data visualisation, specifically infographics, to present data about relatively low student engagement from a designated school with Griffith University Library and its contribution to increased communication between the school and the Library. In addition, the Library has increased its use of infographics to demonstrate library impact to both academic and non-academic audiences. Practical implications – This case study would be useful to libraries wishing to demonstrate to academic staff their capability to partner with faculty to achieve institutional goals.
Originality / value – This case study outlines the advantages of librarians partnering with academics in terms of major university drivers such as student success and student retention. It provides an example of the use of infographics as an effective communication strategy in an academic library. Keywords: Infographics, Data visualisation, Student retention, Faculty, Collaboration, Partnerships Article classification: Case study
1. Introduction
In recent years, academic institutions have begun to allocate a high priority to student retention and graduation rates, which often form part of their mission and/or strategic plans (Oakleaf, 2010; Brown and Malenfant, 2016). There are a number of stakeholders, including the library, who have a key role to play in helping the institution achieve these goals. Given the nature of their interaction and influence with students, both academic and library staff are integral to assisting students in developing the skills required to be successful in their academic endeavours.
Drawing upon experts in the field, the authors have examined the potential for library / academic staff collaboration to enhance student academic success and, possibly, retention, while noting the general poor track record to date of libraries in demonstrating their impact, particularly with faculty. Using a case study approach, this paper reports on an example from Griffith University in which data visualisation, specifically infographics, was used to increase collaboration with a particular cohort of academics. The authors conclude with a discussion of some of the key principles now used by the Library to demonstrate impact.
2
2. Literature review
In undertaking a critical review of the literature, the authors have focused on two main areas. First, they have examined the principal factors influencing student retention, including the role of academics and of library staff. Secondly, they have then examined aspects of how libraries can demonstrate impact, specifically through the use of infographics.
2.1 Student retention
Student retention and graduation rates are important measures in higher educational institutions. Forty years ago, low outcomes used to be attributed to students’ failure based on a lack of
“attributes, skills and motivation (Tinto, 2006, p. 2).” However, findings from recent research conducted by Harvey et al. (2017) state that “much of student attrition is either unpredictable or inevitable. … and often beyond institutional control (p. 9).” Yet, retention remains one of the measures of institutional success and, as such, influences the reputation of the institution
(Haddown, 2013). In the United States, institutional retention and/or graduation rates are used as a measure of an accountability program for some public institutions (Tinto, 2006). In Australia, the current government is planning to introduce a performance-based element to its Commonwealth Grant Scheme (Australia, Department of Education and Training, 2017a). Performance
measurements will include student retention.
While a high priority for higher education institutions, student retention is, nevertheless, a complex issue. Although some attrition cannot be avoided because of a student’s personal circumstances (Harvey et al. , 2017), influencing factors include lack of preparedness for study (Thomas, 2002; Madgett and Bélanger, 2008) and lack of engagement, both academically and socially (Thomas, 2002; Tinto, 2006; Bell, 2008; Madgett and Bélanger, 2008; Svanum and Bigatti, 2009). Furthermore, Elliott (2002) suggests that a sense of belonging and a quality education are the keys to students’ satisfaction with their experience in university. Accordingly, higher satisfaction has a positive correlation with student retention (Elliott, 2002). Recommendations compiled by the Australian Department of Education and Training (2017b) to enhance student academic success in higher education include providing student transition support programs and academic support services throughout their studies.
2.1.1 Preparedness
Academic difficulties are one of the reasons for which students leave an institution (Thomas, 2002). It is particularly critical for first year students to develop a sense of successful transition to the new environment (Tinto, 2006). Research conducted by Scutter et al. (2011) found that only 30% of commencing students had realistic expectations about the effort required to succeed academically. This gap between expectations and reality could lead to students’ withdrawal from a university. A feeling of a lack of academic preparedness can have an impact on a student’s decision to withdraw (Thomas, 2002). Therefore, there is an opportunity for institutions to engage students by
undertaking planned and focused efforts in regard to first-year students (Jobe et al., 2016).
2.1.2 Engagement
Students’ engagement with their studies and the institution itself is another factor of students’ academic success (Bell, 2008; Svanum and Bigatti, 2009). A feeling of being part of the community academically and/or socially influences students’ considerations about leaving their university (Madgett and Bélanger, 2008; Maher and Macallister, 2013). In particular, developing a “sense of belonging” is essential for first-year student retention, as students need support to cope with the pressures of a new, challenging environment. Their first year is critical in terms of a decision as to whether to stay or leave the institution (Tinto, 2006). Thus, a sense of belonging is a vital element to improve student retention (Madgett & Bélanger, 2008; Knapp et al., 2014). Basically, students need to feel that they are receiving enough attention academically and personally (Elliott, 2002).
3
One of the areas which Palmer et al. (2009) have identified to improve student retention is the provision of a cohesive learning experience. This could increase communication between staff and students and could lead to the development of “a sense of community” (Palmer et al. , 2009, p. 39), which would influence first-year students’ decision to stay or leave the institution. In addition, the demonstration of a willingness to support them by institutional, faculty, library, and administrative staff is a vital element in improving student retention.
2.1.3 Library contribution to retention
“Libraries … are an integral part of the college experience (Mezick, 2007, p. 561).” Moreover, according to Meyer and Stuart (2007), the library has been responding effectively to clients’ changing needs. For example, because of a pedagogical shift from lecture-centred to student-centred, the library now often provides a space for learning activities for individuals as well as for groups (Bryant et al., 2009).
Research shows that “libraries improve their institution’s general education outcomes and demonstrate that information literacy contributes to inquiry-based and problem-solving learning, including critical thinking, ethical reasoning, global understanding, and civic engagement (Brown and Malenfant, 2016, p. 2).”
The library makes a contribution to student’s academic success from a number of perspectives, as discussed below.
2.1.3.1 Library use
Student’s library use can be interpreted as a kind of engagement with the institution (Haddown, 2013). First-year in university is challenging for many students and it has a big impact on retention (Madgett and Bélanger, 2008). The University of Tennessee, Knoxville (2011) found that more students leave the institution “after the first year than after the second and third years combined (p. 17).” However, research conducted by Soria et al. (2013) demonstrates that “first-year students who used libraries in their first semester had higher grade point averages and retention (p. 162).”
Research has revealed a strong, positive relationship between the usage of library resources and student grades across all years of study (Cox and Jantti, 2012; Stone and Ramsden, 2013). Haddown (2013) found that retained students use library resources more than ones who left the institution. The library appears to be a place which can provide a positive learning environment for all students (Kuh and Gonyea, 2003).
2.1.3.2 Space
The academic environment has an impact on retention decisions, which includes the library as a physical facility (Bean, 2003; Murray, 2015). Students need activities and opportunities to interact with their peers to create a sense of belonging (Palmer et al., 2009). Research conducted by Stone and Ramsden (2013) indicates that the library is regarded as a space for learning as well as meeting peers to discuss their study. Bryant et al. (2009) have observed that library space is also used as a social space. Students doing their academic work as a group are learning and socialising
simultaneously (Bryant et al., 2009), which enhance their sense of community. Furthermore, “[w]ell-designed social spaces are likely to increase students’ motivation” and could enhance their learning (Joint Information Systems Committee, 2006).
2.1.3.3 Information literacy skills
Information literacy skill and knowledge are essential for students to allow themselves to be a self-directed learner and confident in their learning (Barnard et al., 2005). Academic libraries often deliver information literacy skills workshops and/or lecturers as an embedded session in courses. These can contribute to student retention as the skill and knowledge support students’ academic performance and learning (Barnard et al., 2005), as well as actually engage students in learning.
4
It is critical for commencing students to develop a sense of external and internal resourcefulness as well as a connection with peers in the first three weeks of semester (Wilson et al., 2014). Some university libraries deliver orientation programs for commencing students to support their
transition, by providing basic information on how to conduct research for their assignment as well as introductory content on the use of referencing tools, academic reading and writing, and time
management. This approach provides participants with some ideas on how and where to start their essay assignments and what they need to do to maintain academic integrity. Usually, sessions include information on where to get help, which generates in students a feeling of being supported (Wilson et al., 2014). They help students’ successful transition to university.
2.1.4 Collaboration between academics and library staff
All elements within an academic institution are influenced by the need to contribute to the parent organisation’s strategic goals. In this context, “the library is increasingly recognised as integral to advancing the academic success of students at higher education institutions (Brown and Malenfant, 2016, p. 23).”
However, there are academics who do not see the necessity for the involvement of librarians, despite awareness of a lack of required basic research skills in their students (Miltenoff, 2013). This could be because that they do not know what services the library provides (Anthony, 2010) and/or they do not regard librarians as their peers (Oberg, 1989; Kotter, 1999; Galbraith et al., 2016). Academics often see librarians as service professionals doing different things from them
(Christiansen et al., 2004). According to Fleming-May and Yuro, (2009), unless academics recognise the library’s ability, they will not encourage students to use library services. The greater the trust and support the library receives from faculty, the more the students will use the library. Therefore, academics’ perceptions about the library and their expectations about information literacy skills can affect students’ overall learning success, library use, and, possibly, their retention.
As faculty members are generally more visible to students than librarians, they may have more influence over students than librarians. Creaser and Spezi (2012) suggest that “[w]orking in partnership with teaching and research staff was found to be an effective way to promote the library, and to increase the perception of value (p. 1).” Faculty tends to be regarded as being in a stronger position than the library in terms of high-level, organisational decision-making (Mix, 2013). It is therefore critical for the library to demonstrate to academic staff its capability to partner with faculty to achieve institutional goals.
2.2 Demonstrating library impact to faculty
Demonstrating library contribution to student academic success is crucial (Creaser and Spezi, 2012) to change any negative faculty perception about the library. Presenting the impact on student academic success is a relatively new concept (Creaser and Spezi, 2012); however, there are
stakeholders interested in the contribution of the library toward student success (Oakleaf, 2010) and retention (Lindauer, 1998). According to Oakleaf (2010), to win faculty support, it is essential for the library to demonstrate the achievements of library users and the library’s engagement with their academic journey.
Traditional measures of library value may place a high priority on statistics, such as number of resources, number of staff, number of access to resources, and the budget (Council of Australian University Librarians, 2014). According to Tenopir (2012) and Oakleaf (2010), the library often demonstrates its return on investment (ROI) by reporting on the dollar value to its institution. However, these measures do not demonstrate the academic library’s impact directly on student learning outcomes, retention, and research contribution. Moreover, what the library tends to promote is its service or collection, not the benefit that users potentially can receive (Urquhart, 2015).
5
Instead, outcomes from library interventions could be qualitative rather than quantitative, as demonstrated by a success story, assessment quality, or students’ / academics’ testimonials. According to the Council of Australian University Librarians (2014), library data should focus on “impact”, not “size”, to engage faculty. Traditional data, which the library has been demonstrating, will not impress or engage faculty, as it will not match their interests (Murray, 2015). Murray (2015) goes on to point out that the library should seek new methods to gather data and to demonstrate library value, which is aligned specifically with student success. Moreover, library staff need to develop the skill to demonstrate library value as aligned with the institution’s priorities.
According to Barr (2012), the lack of time for academics to read and digest information from the library is an obstacle in promoting the library to them as well as the lack of time for library staff to promote themselves. Therefore, the library needs to identify effective and scalable ways to communicate impact. In short, libraries need to develop a new mindset in which their communications to faculty are impact focused rather than output focused.
2.2.1 Using visualisation to demonstrate impact
Given the visually rich environment in which people live and operate, they expect to receive information in a variety of content forms. As a result, there is a wide range of media which organisations can use to demonstrate impact. Not surprisingly, information visualisation has been widely adopted as an effective tool to present information in a concise and accessible way.
Information visualisation improves viewers’ comprehension, memorability, and engagement (Ware, 2004; Houts et al., 2006; Borkin et al., 2013; Arcia et al., 2016).
While initially the subsets of data visualisation and infographics may have been used
interchangeably, infographics now refers specifically to information graphics, which “[combine] data visualizations, illustrations, text, and images together into a format that tells a complete story (Krum, 2014, p. 6).” Data is an important element of an infographic because, according to Dunlap (2016), a story around data has the potential to evoke the viewers’ emotion, which could enhance their memory and engagement with the message the infographic intends to communicate.
2.2.2 Infographic examples from wider industry
Given that infographics enhance a viewer’s attention and the overall effectiveness of communication (Houts et al., 2006), they are used in many industries, such as business, healthcare and politics, to promote their messages (Scott et al., 2016). For example, in the United Kingdom, Chief Medical Officers (CMOs) have developed infographics about physical activity to send a clear message without a professional’s explanation, to raise awareness, and to encourage the public to be more physically active (Scott et al. , 2016). Newspapers use infographics to present complex information as data with narrative (Segel and Heer, 2010). The UK’s Office for National Statistics (ONS) has created visuals from census data to promote “understanding of the messages from the statistics” by the public (Obe, 2013, p. 173).
2.2.3 Infographics within the library
The American Library Association has developed a series of infographics to demonstrate public library challenges as a result of stringent public funding cuts (Qualey, 2014). In addition, the
Association of Research Libraries has developed an infographic to highlight key points from their 34-page document, “Code of best practices in fair use for academic and research libraries” (Qualey, 2014). These are examples of the use of visualisation for advocacy.
With the increased pressure on hospital libraries to be either closed or downsized, Bouquin and Epstein (2015) suggest that they use infographics to market their value. While librarians may already be familiar with infographics as tools to help educate patients, they may not have considered their applicability in marketing to their stakeholders. Hofschire (2016), for her part, outlines some of the
6
key considerations in harnessing the potential for infographics to demonstrate impact in academic libraries. For librarians wishing to create effective infographics, Yuvaraj (2017) outlines not only their key types but also how to create engaging products.
3. Methodology
The authors undertook a critical analysis of the literature on student retention and data
visualisation. The purpose of the review was twofold: to evaluate a number of perspectives on the critical success factors which contribute to student retention, and to determine the extent to which libraries are using data visualisation to increase their collaboration with academic staff and thereby positively influencing student outcomes.
Since the authors were interested in obtaining qualitative—rather than quantitative—data, they utilised case study methodology. According to Yin (1984), social scientists in particular have used this methodology for many years to examine contemporary real-life situations and provide the basis for the application of ideas and extension of methods. It is well suited for exploring new processes or behaviours (Meyer, 2001).
Using a case study approach, the authors have presented an example of how data visualisation was incorporated into a regularly scheduled library update to academics, which had previously been text-based.
4. Communicating LLS engagement with Griffith Sciences
Griffith University is comprised of four main academic groups: Arts, Education and Law; Griffith Business School; Griffith Health; and Griffith Sciences. As part of its engagement strategy, Library and Learning Services (LLS) regularly updates each of the Group Boards on a range of topics which are deemed to be of potential interest to that Group Board. Reports are tailored to suit the disciplines represented in each Group.
In supporting learning and teaching, LLS offers services and instructional programs in information literacy and academic skills. Many of these are delivered through face-to-face workshops and individual consultations (face to face, online, or email). Since Semester 1 2009, LLS has been collecting workshop and consultation data which details client engagement with its services.
Until recently, some LLS reports to the Group Boards have used a combination of narrative and graphs to convey information, particularly in regard to the data mentioned above. However, several key events helped to trigger a re-think. First, one of the Library Services Managers led a project, which focused on “Visualising Students’ Feedback”. The lead author of this paper joined the project team in 2014 and was instrumental in creating some of the key data visualisation components, several of which subsequently helped to inform the Library’s 2015 Strategic Plan.
Secondly, in 2015, Library Service Managers presented on the University’s learning, teaching, and research culture at a post-conference session run in conjunction with the Eighth Evidence Based Library and Information Practice (EBLIP8) Conference. The lead author produced the infographics with Piktochart (piktochart.com) for that session. Piktochart had been recommended by a colleague as a web-based tool that was user friendly. After exploring its potential, an individual layout was designed; functions provided by the tool were applied, such as developing a graph and inserting icons. The data to be visualised was made available via Microsoft Excel.
Subsequently a decision was taken by the Library Services Manager, Sciences, to incorporate infographics in her report to that particular academic group. Once again the lead author was tasked
7
with developing the relevant infographics. She accessed the relevant data, which, while stored in Microsoft Excel, had to be cleaned before further use. She then followed the same process as for EBLIP8.
The specific purpose of the visual presentation was to present efficiently and clearly the engagement of LLS with students in Griffith Sciences. Data was derived from the analysis of
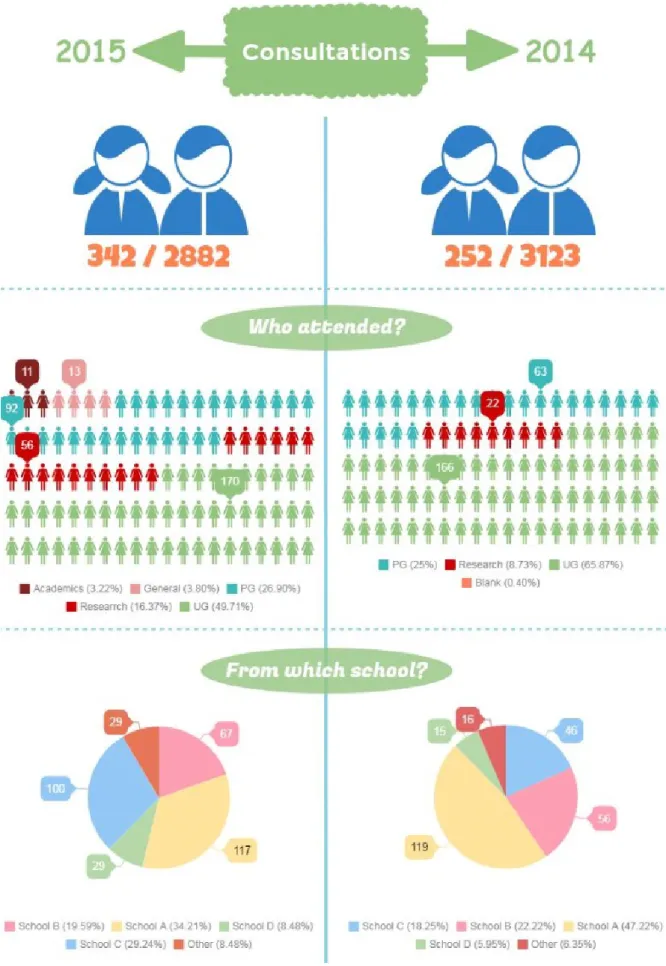
workshop and consultation attendance, which LLS had provided for Semester 1, 2014 and Semester 1, 2015. As shown in Figure 1, one of the infographics included data demonstrating the proportion of Griffith Sciences’ students attending consultations compared with the total number of consultations delivered to all Griffith students.
8
9
Another visual presentation (Figure 2) showed a snapshot of Griffith Sciences’ students attending selected LLS workshops. The infographics were included in an Information Services report for the Griffith Science Group Board as well as for one of the Schools within that Group.
10
Figure 2. Number of Griffith Sciences students attending library workshops
The visualised information presented in the report gave a clear indication of the proportion of students who had used selected LLS services in each of the four Schools within Griffith Sciences. Furthermore, all data used demonstrated the same message: the number of students attending consultations and the number of workshops delivered in Semester 1 2015 were higher than in 2014. The visuals also clearly illustrated that the number of students participating in LLS consultations and workshops from one School (B) was much smaller than the number of participants from one of the other Sciences Schools (A).
5. Discussion
When these infographics were incorporated into a subsequent Information Services Report for School B in Griffith Sciences, the Head of School immediately commented on the relatively low number of students from his School, who were attending workshops, compared with students from other Schools within that same Group.
Given the emphasis at the University on both student success and student retention, Heads of Schools are key stakeholders in helping the University to improve student outcomes. Therefore, any data which signals underrepresentation by their students in core academic support initiatives could logically be expected to trigger alarm bells on their part. Therefore, it would appear that the
visualised information contributed to the Head of School being able to quickly process complex data and to see relevant connections to his specific context.
Furthermore, the infographic presented a personalised comparison. According to Arcia et al.
(2016), when viewers see themselves and/or their community as a part of the visualised
information, infographics will engage them in a more effective way. Therefore, the authors believe that the personalised visualisation contributed to a concern about the relatively low number of students from the School using LLS services.
Following the School meeting, in late 2015 LLS staff met with the Head of School (HOS) and the School’s Learning & Teaching staff to discuss ways in which to increase engagement with the School. At this meeting, the HOS outlined his vision as to how closer integration with LLS could be achieved, focusing especially on those core skills in which students had not always demonstrated the desired levels of competency. At the same time, the HOS observed that academics within the School had not always availed themselves of opportunities to partner with librarians to help students achieve success.
As a result of this initial meeting, the HOS convened a much larger meeting between his School and LLS staff. There was general agreement that students needed to improve a range of skills to underpin not only their academic success but also their employment outcomes. Notwithstanding the positive outcome of increased communication between the School and LLS, the process of changing culture and behaviour can best be categorised as “slow”. An analysis of data from 2016 has shown a decrease in the number of School B’s students attending the Library’s training sessions. However, several key factors may have contributed to this: (1) a number of academics who were using the Library’s services left the University and their replacements were not yet aware of Library offerings; and (2) the University was about to undergo a highly disruptive transition from an academic calendar based on semesters to one based on trimesters. Notwithstanding, both the HOS and LLS staff remain committed to increasing student participation.
Additionally, in 2016 the Pro Vice Chancellor (Information Services), in whose division LLS was then an organisational unit, was presented with an example of the infographics-based reports being
11
produced by several staff within LLS. She subsequently commissioned a small LLS project team to produce several similar reports for presentation to the University’s senior management (Yamaguchi and Howarth, 2016).
A number of key questions have underpinned the LLS approach to the creation of infographics designed to demonstrate impact:
• Who is the target audience? • What is the key message?
• What is the (primary) expected outcome?
• What is the “hook” that will appeal to this (specific) audience? • Is the data / information targeted and specific?
• Are there too many messages / too much data for easy comprehension?
6. Conclusion
Given increased emphasis by universities on student retention and academic success, librarians have an opportunity to partner with key stakeholders, particularly academics, to help improve student outcomes. The key to such a partnership lies in the library’s ability to engage faculty in a way that demonstrates its ability to assist in achieving strategic institutional goals.
This paper has focused on preliminary efforts by Griffith University’s Library and Learning Services to use data visualisation to demonstrate more effectively its engagement with students to academic staff as well as the benefits that may follow. The small, but important, initial success has reinforced the importance of communicating with academics in ways that are not only relevant to them but also ideally lead to a “call to action”, where required.
7. Acknowledgement
This paper is a substantially revised and expanded version of a paper co-presented by one of the authors at the ALIA National 2016 Conference, Adelaide, 29 August – 1 September.
References
Anthony, K. (2010), “Reconnecting the disconnects: library outreach to faculty as addressed in the literature”, College & Undergraduate Libraries, Vol. 17 No. 1, pp. 79-92.
Arcia, A., Suero-Tejeda, N., Bales, M.E., Merrill, J.A., Yoon, S., Woollen, J. and Bakken, S. (2016), “Sometimes more is more: iterative participatory design of infographics for engagement of community members with varying levels of health literacy”, Journal of the American Medical Informatics Association, Vol. 23 No. 1, pp. 174-183.
Australia. Department of Education and Training (2017a), The HigherEducation Reform Package,
Canberra, The Department, available at: https://docs.education.gov.au/node/43521 (accessed 13 September 2017).
12
Australia. Department of Education and Training (2017b),Discussion Paper on Improving Retention, Completion and Success in Higher Education, Canberra, The Department, available at:
https://docs.education.gov.au/system/files/doc/other/final_discussion_paper.pdf (accessed at 13 September 2017).
Barnard, A., Nash, R. and O'Brien, M. (2005), “Information literacy: developing lifelong skills through nursing education”, Journal of Nursing Education, Vol. 44 No. 11, pp. 505-510.
Barr, S. (2012), “How should academic libraries communicate their own value?” The Guardian
(Australia edition), 20 August, available at: https://www.theguardian.com/higher-education-network/blog/2012/aug/20/academic-libraries-value-research-teaching (accessed 13 September 2017).
Bean, J.P. (2003), “College student retention”, In Guthrie, J.W. (Ed), Encyclopedia of Education (Vol. 1), Macmillan Reference, New York, pp. 401-407.
Bell, S. (2008), “Keeping them enrolled: how academic libraries contribute to student retention”,
Library Issues: Briefings for Faculty and Administrators, Vol. 29 No. 1, available at: http://www.libraryissues.com/LI290001.asp
Borkin, M.A., Vo, A.A., Bylinskii, Z., Isola, P., Sunkavalli, S., Oliva, A. and Pfister, H. (2013), “What makes a visualization memorable?” IEEE Transactions on Visualization and Computer Graphics, Vol. 19 No. 12, pp. 2306-2315.
Bouquin, D. and Epstein, H.-A.B. (2015), “Teaching data visualization basics to market the value of a hospital library: an infographic as one example”, Journal of Hospital Librarianship, Vol. 15 No. 4, pp. 349-364.
Brown, K. and Malenfant, K.J. (2016), Documented Library Contributions to Student Learning and Success: Building Evidence with Team-Based Assessment in Action Campus Projects, Association of College and Research Libraries, Chicago, available at:
http://www.ala.org/acrl/sites/ala.org.acrl/files/content/issues/value/contributions_y2.pdf
Bryant, J., Matthews, G. and Walton, G. (2009), “Academic libraries and social and learning space: a case study of Loughborough University Library, UK”, Journal of Librarianship and Information Science, Vol. 41 No. 1, pp. 7-18.
Christiansen, L., Stombler, M. and Thaxton, L. (2004), “A report on librarian-faculty relations from a sociological perspective”, Journal of Academic Librarianship, Vol. 30 No. 2, pp. 116-121.
Council of Australian University Librarians. (2014), “Value and impact of university libraries”, available at: http://www.caul.edu.au/caul-programs/best-practice/cqaac-resources/library-value Cox, B. L. and Jantti, M. H. (2012), “Discovering the impact of library use and student performance”,
Educause Review Online, July, available at: http://er.educause.edu/articles/2012/7/discovering-the-impact-of-library-use-and-student-performance (accessed 13 September 2017).
Creaser, C. and Spezi, V. (2012), “Working together: evolving value for academic libraries”, Loughborough University, Loughborough, available at: https://dspace.lboro.ac.uk/dspace-jspui/handle/2134/13476 (accessed 13 September 2017).
Dunlap, J.C. (2016), “Getting graphic about infographics: design lessons learned from popular infographics”, Journal of Visual Literacy, Vol. 35 No. 1, pp. 42-59.
13
Elliott, K.M. (2002), “Key determinants of student satisfaction”, Journal of College Student Retention: Research, Theory & Practice, Vol. 4 No. 3, pp. 271-279.
Fleming-May, R. and Yuro, L. (2009), “From student to scholar: the academic library and social
sciences PhD students’ transformation”, portal: Libraries and the Academy, Vol. 9 No. 2, pp. 199-221. Galbraith, Q., Garrison, M. and Hales, W. (2016), “Perceptions of faculty status among academic librarians”, College & Research Libraries, Vol. 77 No. 5, pp. 582-594.
Haddown, G. (2013), “Academic library use and student retention: a quantitative analysis”, Library & Information Science Research, Vol. 35 No. 2, pp. 127-136
Harvey, A., Szalkowicz, G. and Luckman, M. (2017), “The re-recruitment of students who have withdrawn from Australian higher education”, Centre for Higher Education Equity and Diversity Research, La Trobe University, Melbourne, available at:
http://www.latrobe.edu.au/__data/assets/pdf_file/0011/784028/La-Trobe-NPP-Re-recruitment-Research-Report-24-February-2017.pdf (accessed 13 September 2017).
Hofschire, L. (2016), “Let’s get visual”, American Libraries, Vol. 47 No. 11/12, p. 29, available at: https://americanlibrariesmagazine.org/wp-content/uploads/2016/10/1116-AL-web.pdf (accessed 13 September 2017).
Houts, P.S., Doak, C.C., Doak, L.G. and Loscalzo, M.J. (2006), “The role of pictures in improving health communication: a review of research on attention, comprehension, recall, and adherence”, Patient Education and Counseling, Vol. 61 No. 2, pp. 173-190.
Jobe, R.L., Spencer, M., Hinkle, J.P. and Kaplan, J.A. (2016), “The first year: a cultural shift towards improving student progress”, Higher Learning Research Communications, Vol. 6 No. 1, pp. 10-20. Joint Information Systems Committee. e-Learning and Innovation (2006), Designing Spaces for Effective Learning: A Guide to 21st Century Learning Space Design, JISC, Bristol, UK, available at: https://www.webarchive.org.uk/wayback/archive/20140616001949/http://www.jisc.ac.uk/media/d ocuments/publications/learningspaces.pdf (accessed 13 September 2013).
Knapp, J.A., Rowland, N.J. and Charles, E.P. (2014), “Retaining students by embedding librarians into undergraduate research experiences”, Reference Services Review, Vol. 42 No. 1, pp. 129-147.
Kotter, W.R. (1999), “Bridging the great divide: improving relations between librarians and classroom faculty”, Journal of Academic Librarianship, Vol. 25 No. 4, pp. 294-303.
Krum, R. (2014), Cool Infographics: Effective Communication with Data Visualization and Design, Wiley, Indianapolis, IN.
Kuh, G.D. and Gonyea, R.M. (2003), “The role of the academic library in promoting student engagement in learning”, College & Research Libraries, Vol. 64 No. 4, pp. 256-282.
Lindauer, B.G. (1998), “Defining and measuring the library’s impact on campuswide outcomes”,
College & Research Libraries, Vol. 59 No. 6, pp. 546-570.
Madgett, P.J. and Bélanger, C.H. (2008), “First university experience and student retention factors”,
Canadian Journal of Higher Education, Vol. 38 No. 3, pp. 77-96.
Maher, M. and Macallister, H. (2013), “Retention and attrition of students in higher education: challenges in modern times to what works”, Higher Education Studies, Vol. 3 No. 2, pp. 62-73.
14
Meyer, C.B. (2001), “A case in case study methodology”, Field Methods, Vol. 13 No. 4, pp. 329-352. Meyer, R. and Stuart, C. (2007), “Evaluating physical and virtual space to support teaching and learning”, available at: http://www.arl.org/storage/documents/publications/evaluating-spaces-georgia-tech-mar07.pdf (accessed 13 September 2017).
Mezick, E.M. (2007), “Return on investment: libraries and student retention”, Journal of Academic Librarianship, Vol. 33 No. 5, pp. 561-566.
Miltenoff, P. (2013), “Building the librarian’s curriculum. Issues and possibilities”, Bibliosphere, No. 17, available at: http://bibliosphere.eu/?p=2063 (accessed 20 September 2017).
Mix, V.L. (2013), “Library and university governance: partners in student success”, Reference Services Review, Vol. 41 No. 2, pp. 253-265.
Murray, A. (2015), “Academic libraries and high-impact practices for student retention: library deans' perspectives”, portal: Libraries and the Academy, Vol. 15 No. 3, pp. 471-487.
Oakleaf, M. (2010), Value of Academic Libraries: A Comprehensive Research Review and Report, Association of College and Research Libraries, Chicago, available at:
http://www.ala.org/acrl/sites/ala.org.acrl/files/content/issues/value/val_report.pdf (accessed 13 September 2017).
Obe, A.S. (2013), “Data visualisation and beyond: a multi- disciplinary approach to promote user engagement with official statistics”, Statistical Journal of the IAOS, Vol. 29 No. 3, pp. 173-185. Oberg, L.R., Schleiter, M. K. and Van Houten, M. (1989), “Faculty perceptions of librarians at Albion College: status, role, contribution, and contacts”, College & Research Libraries, Vol. 50 No. 2, pp. 215-230.
Palmer, M., O'Kane, P. and Owens, M. (2009), “Betwixt spaces: student accounts of turning point experiences in the first-year transition”, Studies in Higher Education, Vol. 34 No. 1, pp. 37-54. Qualey, E. (2014), “What can infographics do for you? Using infographics to advocate for and market your library”, AALL Spectrum, Vol. 18 No. 4, pp. 7-8.
Scott, H., Fawkner, S., Oliver, C. and Murray, A. (2016), “Why healthcare professionals should know a little about infographics”, British Journal of Sports Medicine, Vol. 50 No. 18, pp. 1104-1105.
Scutter, S.D., Luzeckyj, A., da Silva, K.B., Palmer, E. and Brinkworth, R. (2011), “What do commencing undergraduate students expect from first year university?” International Journal of the First Year in Higher Education, Vol. 2 No. 1, pp. 8-20.
Segel, E. and Heer, J. (2010), “Narrative visualization: telling stories with data”, IEEE Transactions on Visualization and Computer Graphics, Vol. 16 No. 6, pp. 1139-1148.
Soria, K.M., Fransen, J. and Nackerud, S. (2013), “Library use and undergraduate student outcomes: new evidence for students’ retention and academic success”, portal: Libraries and the Academy, Vol. 13 No. 2, pp. 147-164.
Stone, G. and Ramsden, B. (2013), “Library impact data project: looking for the link between library usage and student attainment”, College & Research Libraries, Vol. 74 No. 6, pp. 546-559.
15
Svanum, S. and Bigatti, S.M. (2009), “Academic course engagement during one semester forecasts college success: engaged students are more likely to earn a degree, do it faster, and do it better”,
Journal of College Student Development, Vol. 50 No. 1, pp. 120-132.
Tenopir, C. (2012), “Beyond usage: measuring library outcomes and value”, Library Management,
Vol. 33 No. 1/2, pp. 5-13.
Thomas, L. (2002), “Student retention in higher education: the role of institutional habitus”, Journal of Education Policy, Vol. 17 No. 4, pp. 423-442.
Tinto, V. (2006), “Research and practice of student retention: What next?” Journal of College Student Retention: Research, Theory & Practice, Vol. 8 No. 1, pp. 1-19.
University of Tennessee Knoxville. Office of the Chancellor (2011), “Journey to the top 25: Action plan - June 2011”, available at: http://top25.utk.edu/wp-content/uploads/sites/11/2014/03/top-25-action-plan-June2011.pdf (accessed 13 September 2017).
Urquhart, C. (2015), “Reflections on the value and impact of library and information services. Part 1”,
Performance Measurement and Metrics, Vol. 16 No. 1, pp. 86-102.
Ware, C. (2004), Information Visualization - Perception for Design, 2nd. ed., Elsevier, Amsterdam. Wilson, K.L., Murphy, K.A., Pearson, A.G., Wallace, B.M., Reher, V.G.S. and Buys, N. (2014), “Understanding the early transition needs of diverse commencing university students in a health faculty: informing effective intervention practices”, Studies in Higher Education, Vol. 41 No. 6, pp. 1023-1040.
Yamaguchi, M. and Howarth, D. (2016), “Communicating academic library impact through visualisation”, paper presented at the ALIA National 2016 Conference, Adelaide, 29 August -1 September, available at: https://nationalconference.alia.org.au/content/communicating-academic-library-impact-through-visualisation (accessed 21 September, 2017).
Yin, R.K. (1984), Case Study Research: Design and Methods, Sage, Newbury Park, CA.
Yuvaraj, M. (2017). “Infographics: tools for designing, visualizing data and storytelling in libraries”,
Library Hi Tech News, Vol. 34 No. 5, pp. 6-9.
Further reading
Haynes, E.B. (1996), “Librarian-faculty partnerships in instruction”, In Godden, I.P. (Ed), Advances in librarianship, Emerald, Bingley, UK, pp. 191-222.