PICS: A Public IaaS Cloud Simulator
In Kee Kim, Wei Wang, and Marty Humphrey
Department of Computer Science University of Virginia
Email:{ik2sb, wwang}@virginia.edu, [email protected]
Abstract—Public clouds become essential for many organiza-tions to run their applicaorganiza-tions because they provide huge financial benefits and great flexibility. However, it is very challenging to accurately evaluate the performance and cost of applications without actual deployment on the clouds. Existing cloud sim-ulators are generally designed from the perspective of cloud service providers, thus they can be under-developed for answer-ing questions for the perspective of cloud users. To solve this prediction and evaluation problem, we created a Public Cloud IaaS Simulator (PICS). PICS enables the cloud user to evaluate the cost and performance of public IaaS clouds along with such dimensions like VM and storage service, resource scaling, job scheduling, and diverse workload patterns. We extensively vali-dated PICS by comparing its results with the data acquired from real public IaaS cloud using real cloud-applications. We show that PICS provides highly accurate simulation results (less than 5% of average errors) under a variety of use cases. Moreover, we evaluated PICS’ sensitivity with imprecise simulation parameters. The results show that PICS still provides very reliable simulation results with imprecise simulation parameters and performance uncertainty.
Index Terms—Cloud Simulator, Cloud Performance Evalua-tion, Public IaaS Clouds, Cloud Applications, Cloud Resource Management.
I. INTRODUCTION
For many organizations today, the issue is notwhetherto use public IaaS cloud computing (e.g. Amazon Web Services [1] or Microsoft Azure [2]) but ratherhow bestto use public IaaS cloud capabilities. The approach taken by many organizations getting started is that a few “super-human” users within the organization deploy a small-scale test cloud-application on the public cloud of choice. This cloud-application usually has two components: a resource manager and user-applications, where the resource manager is responsible for the effective and efficient execution of user-applications, such as web search, SNS, big data analytics, and scientific applications. Then, the next steps are to scale-up the test cloud-application in order to better assess the capabilities and viability in the context of the organization’s particular goals and requirements.
The key limitation these potential cloud users are facing is that there does not appear to be a viable alternative for evaluating the cloud other than to actually use the cloud. This approach is problematic for a number of reasons. First, the time-consuming and sometimes tedious learning of id-iosyncratic cloud APIs can distract from the real issue, which centers around specific application logic and requirements. Second, the evaluation tends to be specific to one cloud and not readily generalizable to other clouds. Third, to evaluate at scale via this approach, the cloud-application typically
requires significant changes to its architecture. Fourth, the evaluation is geared toward the present time, whereas longer-term issues/concerns are often more important than short-longer-term issues of today’s cloud – there is little opportunity to ask what-if questions of performance, reliability or cost.
There are a number of cloud simulators that exist (e.g. CloudSim [11], iCanCloud [18], GreenCloud [15]). They have the potential to aid in this evaluation. However, in general, these simulators are designed to answer questions related to datacenter management (e.g., how many concurrent users can I support if I deploy a private cloud on my existing hardware?) Furthermore, typical tools [1, 2, 7, 8] provided by commercial cloud vendors only address a small part of the concerns, which is an overall cost in the aggregate based on resource utilization (e.g., how much does it cost to run 100 small VMs for one month and to store 10 TB in long-term cloud storage for 1 year?) These existing cloud simulators and vendor tools do not broader, end-to-end concerns such as:
1) What is the average/worst response time for a partic-ular application and a particpartic-ular arrival pattern, when servicing via a specific VM type and a specific set of auto-scaling rules?
2) Which public IaaS cloud provides the best cost effi-ciency for a particular application, given the different VM configurations, storage services and pricing models? 3) Which resource management and job scheduling policy maximize the cost efficiency and minimize the response time for a particular application?
4) Above all, if a simulator can provide answers for above questions, another question the cloud users could have is how reliable are the simulation results? or how accurately can the simulator resemble actual clouds’ behavior?
To enable potential public IaaS cloud users to address these and other challenging concerns without actually deploying the cloud-application, we have create the PICS1, a trace-based public IaaS cloud simulator. PICS provides following capabilities to address the potential cloud user’s concerns:
• Assessing a wide range of properties of cloud services and the cloud-applications, including the cloud cost, job response time, and VM utilization.
• Allowing the simulation users to specify different work-load types, including varying job arrival patterns and SLA requirements (e.g. deadline).
1Source code of PICS is publicly available on the PICS project web site – http://www.cs.virginia.edu/∼ik2sb/PICS [6]
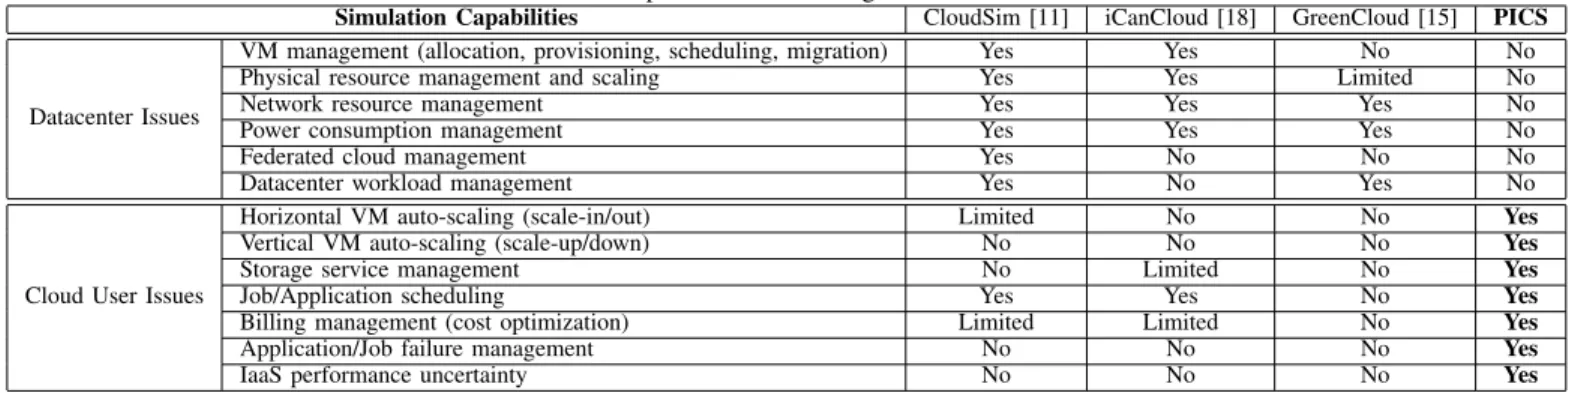
TABLE I: Simulation Capabilities of Existing Cloud Simulator and PICS.
Simulation Capabilities CloudSim [11] iCanCloud [18] GreenCloud [15] PICS
Datacenter Issues
VM management (allocation, provisioning, scheduling, migration) Yes Yes No No
Physical resource management and scaling Yes Yes Limited No
Network resource management Yes Yes Yes No
Power consumption management Yes Yes Yes No
Federated cloud management Yes No No No
Datacenter workload management Yes No Yes No
Cloud User Issues
Horizontal VM auto-scaling (scale-in/out) Limited No No Yes
Vertical VM auto-scaling (scale-up/down) No No No Yes
Storage service management No Limited No Yes
Job/Application scheduling Yes Yes No Yes
Billing management (cost optimization) Limited Limited No Yes
Application/Job failure management No No No Yes
IaaS performance uncertainty No No No Yes
• Simulating of a broad range of resource manage-ment policies: i.e., horizontal/vertical2 auto-scaling, job scheduling and job failure policies.
• Enabling the users to evaluate the performance of differ-ent types of public IaaS cloud configurations such as a variety of resource types (VM and storage), unique billing models, and performance uncertainty [19–21].
We validated the correctness of PICS by focusing on follow-ing capabilities: cloud cost, the number of created VMs, VM utilization, horizontal and vertical scaling of cloud resources, and job deadline satisfaction rate. We compare the simulation results of PICS with the actual measurements from real-world cloud-applications on Amazon Web Services (AWS). The results show that PICS provides very accurate simulation results (less than 5% of average errors) in every validation cases. Furthermore, we conduct a sensitivity test of PICS with±10% and±20% of imprecise simulation parameter by considering of the performance uncertainty of IaaS clouds. The results show that PICS with imprecise simulation parameters still provides very reliable simulation results.
The contributions of this paper are:
1) A public IaaS cloud simulator, PICS, which is versatile and satisfies cloud user’s various needs of cloud applica-tion and cloud service evaluaapplica-tions without actual cloud deployment. PICS is easy-to-configure and fast, allowing large design space exploration in short amount of time. 2) A first simulator that supports both horizontal and verti-cal cloud resource sverti-caling, to the best of our knowledge. 3) A thorough validation of PICS against the results from real public IaaS (AWS), demonstrating that the PICS provides accurate results that faithfully simulates real cloud services.
4) An analysis to examine PICS’ sensitivity to the perfor-mance uncertainty of real cloud services. This analysis shows that PICS can still provide reliable simulation re-sults even when user-provided parameters are imprecise due to the unstable real cloud performance.
The rest of this paper is organized as follows: Section II contains the related work. Section III describes the design and implementation of PICS. Section IV contains validation of PICS. Section V is discussion focusing on sensitivity of simulation parameters and Section VI provides the conclusion.
2Vertical scaling means “scale-up” or “scale-down” operations for the cloud resources. i.e., migrating the user-applications to higher (scale-up) or lower (scale-down) performance instances. [9]
II. RELATEDWORK
CloudSim [11] is a well-known simulation framework for cloud computing and is designed to support various simulation tests across three major cloud service models (e.g. SaaS, PaaS, and IaaS). CloudSim is widely used in cloud com-puting research because of its various capabilities for cloud simulations such as VM allocation and provisioning, energy consumption, network management, and federated clouds. It also has several extensions [10, 12, 14, 22] due to its extensible simulation architecture. These extensions support simulations for large-scale cloud applications according to the geographi-cal distribution of users and datacenters [22], a network-based application model [14], complex scientific workflows [12] and homogeneity in the performance of computational resources and resource failure model during task executions [10].
iCanCloud [18] is a holistic simulation platform for cloud computing and offers various simulation functionalities in-cluding resource provisioning, energy consumption, and user-defined resource broker model. The goal of iCanCloud is to predict tradeoffs between cost and performance of applications executed on virtualized environments. iCanCloud offers an unique feature to configure various storage systems and a pre-defined IaaS model based on Amazon EC2. Moreover, iCanCloud supports large-scale simulation on distributed en-vironments by employing MPI/POSIX-based API.
GreenCloud [15] is a packet-level simulator for data centers focusing on data communication and energy cost in cloud computing. This simulator is implemented based on NS-2 [5] and offers extensive network and communication capabilities (e.g. full implementation of TCP/IP reference model, various workload models) to simulate data center operations. However, due to its narrow focus of simulation for cloud system, it lacks many simulation capabilities in both cloud user- and infrastructure-oriented resource management.
Cloud providers [1, 2] and third-party cloud services [7, 8] provide a tool for calculating the overall cost in the aggregate based on resource utilization. These services are only address-ing a small part of the cloud user’s concern (cloud cost). They do not support any capability to evaluate performance such as response time and detailed VM utilizations. Moreover, they only support resource management policies offered by commercial cloud services (e.g. AWS auto-scaling) to handle the cloud resources, so it is impossible to evaluate the cost and performance of the clouds via particular resource management policies designed for the cloud user’s applications.
As discussed in this section, the capabilities of all existing simulators more focus on datacenter issues such as power consumption and physical resource management. These ca-pabilities are suitable to answer following questions:
• How many concurrent users can I support if I deploy a private cloud on my existing hardware?
• How can I effectively manage my existing hardware resources if I deploy a private clouds on my hardware? However, the cloud users have different perspective on cloud systems. The “super-human” users (mentioned in Section I) is responsible for build cloud applications, which schedule jobs submitted by end users and manage cloud resources (VM, storage, network, etc.) that execute these jobs. For these users, they are more interested in how best to use clouds rather than operating cloud systems. Their major concerns are cost optimization, VM usage, resource scaling, and storage service for their cloud-applications. Due to these disparities between existing cloud simulators and the cloud users, the cloud users have difficulties to have existing simulators to deal with the problem thathow to evaluate the cloud other than to actually use the cloud by focusing on cloud user’s concerns. This limitation motivate us to conduct this research. The purpose of our work is to provide a viable simulation solution for the normal cloud users.
III. SIMULATORDESIGN
A. Simulator Design Overview
Goal: The goal of PICS is to correctly simulate the behav-iors of public clouds from the cloud users’ perspectives as if they deploy a particular cloud-application on public IaaS cloud. From the potential cloud users’ perspective, the cloud cost, the job response time and the resource usages (VM utilization and size) are the most important criteria to evaluate cloud service for their cloud-applications. Key challenges to design PICS are:
• How to correctly model the behavior of public clouds. More specifically, how to handle a variety of resources (e.g. VM, storage, and network).
• How to properly model the behavior of the cloud-application. More specifically, how to handle varying workload patterns and performance uncertainty [19–21]. • How to correctly model the behavior of cloud users’
resource management policy.
For the first challenge, we designed a convenient config-uration interface for the simulation users to define diverse types of cloud resources as an input of the simulator. For the second challenge, we collected data from real public clouds, profile performance uncertainty, and leverage these results to design the simulator. For the last challenge, we provided abundant configuration options to let user define various custom resource management policies.
Input: PICS requires five types of inputs: VM configura-tions, storage and network configuraconfigura-tions, workload informa-tion, job scheduling policies, and cloud resource management policies.
The VM configuration includes detailed specifications of VMs, such as cost (including public cloud’s billing model), machine performance (CPU, RAM), network performance, and the range of startup delays [17] of cloud resources. This configuration is designed to simulate various VM types of current public clouds because public clouds have a diversity of VM types based on performance, cost, and the VM’s purpose.
The storage and network configurationhas detailed informa-tion on storage and network service on public IaaS clouds. We model storage services to reflect current public clouds’ actual characteristics based on Amazon S3 and Azure Storage. To model network service, we collect data from actual network-I/O test by using various types of VM on real cloud services. We then reflect the data to simulator configurations.
The workload information contains detailed configurations on job generation such as job arrival time, job execution time, job deadline, size of network I/O, etc. This input reflects end users requests to a particular cloud-application.
The job scheduling policy defines various cloud user job scheduling policy for end users’ requests. PICS includes three types of job scheduling policies, i.e., EDF (Earliest Deadline First), Round-Robin, and Greedy scheduling mechanisms. In the future, PICS will support more complicated job scheduling policies and APIs. Furthermore, the simulation users can configure recovery policies for job failures, which enable the users to conduct realistic tests for public cloud services.
The cloud resource management policy contains detailed specifications for the cloud resource management. This input supports simulation configurations for maximum number of concurrent VMs, and horizontal and vertical scaling policies. Moreover, the simulator users can configure various ways to monitor and analyze an end user’s job request patterns such as linear and time-series methods. The simulator users are able to leverage this mechanism to design and test their own resource management mechanisms.
Output: PICS provides three types of output: cost, resource usage, and job processing results.
Cost results provide overall cost for total cloud usage, cost trace at fine grained time interval, and usage cost per cloud resource type. Overall cost means how much cost the simulation users are expected to spend on servicing a particular cloud-application under a particular job arrival pattern. Cost trace provides fluctuation and accumulation of usage cost at fine grained time interval. For example, expected usage cost for time at t is $100 and $200 for time at t+ 1. The usage cost per cloud resource type provides a detailed cost based on resource types such as how much cost they spent on each type of resources (e.g. VM, storage, network).
Resource usage results provide detailed information on resource usage such as how many VMs created, how much storage space spent, and how many network data sent and received. Moreover, these results offer fine-grained traces for both horizontal and vertical scaling. These traces help users determine the number and types of VMs running at timetand t+ 1. The users also check when (time) and how (scaling-up/down) the vertical scaling decisions are made.
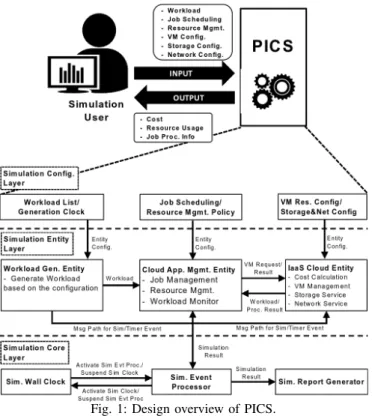
Fig. 1: Design overview of PICS.
Job processing results provide specific information on job processing, such as the job arrival/start/finish time, as well as whether the job deadlines are satisfied (if specified). These results are basic metrics to evaluate the user job scheduling and resource management policies. Moreover, these results include the analysis of job arrival patterns (min, max, and average of job arrival time, as well as predictions for the next job arrivals) using linear and time-series methods.
B. Simulator Internals
PICS is composed of three hierarchical layers: simulation configuration layer, simulation entity layer, and simulation core layer as shown in Fig. 1. The simulation configuration layer is responsible for accepting the user inputs which are passed on to the simulation entity layer. The simulation entity layer contains the simulation logic and is driven by the events generated from the simulation core layer. The simulation core layer is also responsible for producing simulation reports. Because the simulation configuration layer has already been covered by the previous section, we focus on the two remain layers here.
1) Simulation Core Layer: The simulation core layer con-sists of Simulation Wall Clock, Simulation Event Processor and Simulation Report Generator.
Simulation Wall Clockis working as a heart for PICS by managing simulation clock. (Basic time unit is a second.) To manage the simulation clock, Simulation Wall Clock collab-orates with Simulation Event Processor. When the simulation clock is updated, this component sends a clock update event to Simulation Event Processor to notify an update of clock.
Simulation Event Processorhandles every event generated in a simulation. After receiving the clock update event from Simulation Wall Clock, this component passes on this event
to simulation entities, which advance their simulation of the behaviors of public cloud services and cloud-application to the new clock cycle. This component also manages simulation timer events. Simulation entities use these events to register timers within Simulation Event Processor. This component is responsible for notifying the corresponding simulation entity when a timer expires. Moreover, this component handles all simulation command events, all invoked events between simulation entities, in order to validate the authentication of the command events. Because this component can monitor all events in the simulation, this plays a main role to generate real-time traces for the simulation.
Simulation Report Generator is used to generate output reports for the simulation results such as simulation trace and overall reports. Reporting simulation results at fine-grained time interval is an important capability for simulators. Sim-ulation Report Generator is responsible for generating real-time traces called simulation trace reports. These reports contain simulation results at user-defined time interval for cost, resource scaling, and job processing information.
2) Simulation Entity Layer: Simulation entity layer are composed of three entities, which are Workload Generator Entity, Cloud Application Management Entity, and IaaS Cloud Entity. These entities reflect three main components of cloud-applications and public clouds.
Workload Generator Entitygenerates jobs and sends them to the Cloud Application Management Entity to process, based on the workload file from the simulation user. The workload file includes job arrival time, job execution time, job deadlines, I/O data specification, and data transfer specification to support various types of possible end user’s job requests.
Cloud Application Management Entity is designed to resemble the cloud-application’s behaviors. There are sub-components in this entity: job management module, resource management module and workload monitoring module.
The job management module is designed to simulate job management policies of a cloud-application. This module conducts three operations for the simulation; job scheduling, job response time estimation, and job failure management. Job scheduling is used to perform job scheduling policies of the cloud users and assign an arrived job from Workload Generator Entity to a selected VM from IaaS Cloud Entity. Job response time estimation predicts the job response time, which is defined as the clock time when a particular job finishes. The prediction of job response time is based on job execution time and the current load of available cloud resources, and is used for the job scheduling. Job failure management is used for job failure simulation in the case of application failure or cloud infrastructure problem (e.g. VM down). Job failure management supports four types of recovery policies for job failure simulations.
The resource management module is designed to simulate the resource management policies of a cloud-application. It handles three types of cloud resources of public IaaS clouds, i.e., VM, storage and network. For the VM management, this module enables the simulation users to examine their VM se-lection mechanisms (e.g. cost, performance,
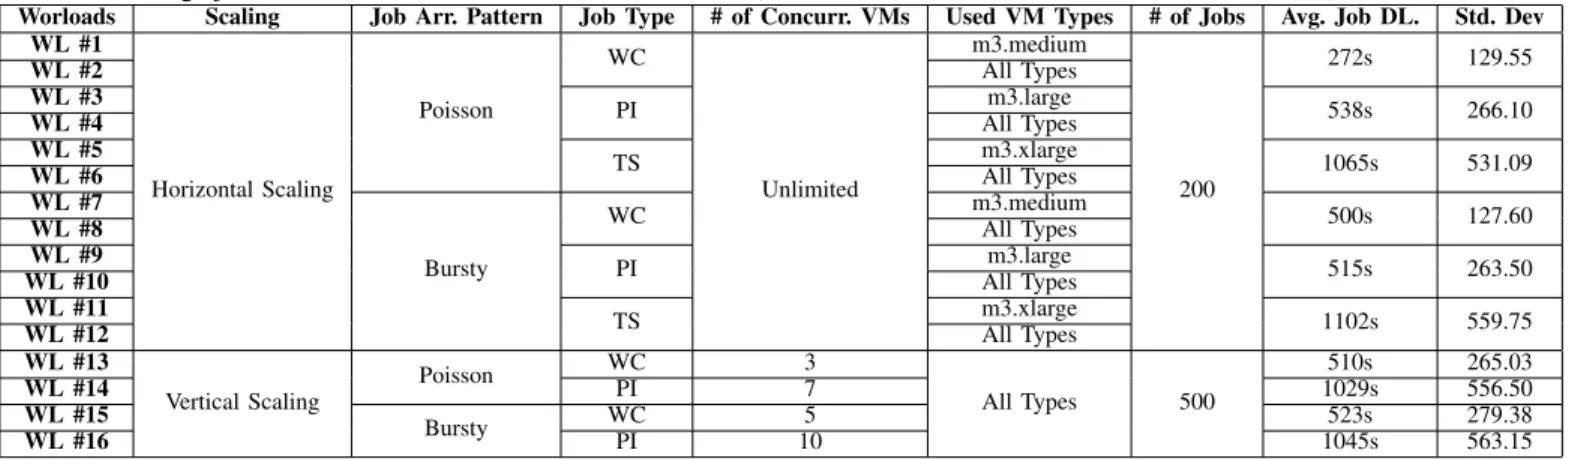
cost/performance-TABLE II: Validation Workloads for PICS. Poisson pattern has 30s of average job arrival rate and 29.63 of standard deviation. Bursty pattern has 15s of average job arrival rate and 11.50 of standard deviation. (WC: Word Count, PI: PI Calculation, TS: TeraSort)
Worloads Scaling Job Arr. Pattern Job Type # of Concurr. VMs Used VM Types # of Jobs Avg. Job DL. Std. Dev WL #1 Horizontal Scaling Poisson WC Unlimited m3.medium 200 272s 129.55 WL #2 All Types WL #3 PI m3.large 538s 266.10 WL #4 All Types WL #5 TS m3.xlarge 1065s 531.09 WL #6 All Types WL #7 Bursty WC m3.medium 500s 127.60 WL #8 All Types WL #9 PI m3.large 515s 263.50 WL #10 All Types WL #11 TS m3.xlarge 1102s 559.75 WL #12 All Types WL #13 Vertical Scaling Poisson WC 3 All Types 500 510s 265.03 WL #14 PI 7 1029s 556.50 WL #15 Bursty WC 5 523s 279.38 WL #16 PI 10 1045s 563.15
balanced) and VM scaling mechanisms (e.g. horizontal, verti-cal sverti-caling). For storage and network resources, this module can simulate File Read/Write operations to cloud storage and data transmissions by collaborating with IaaS Cloud Entity.
The workload monitoring module is designed to analyze workload arrival patterns from Workload Generator Entity. The simulation users can leverage this module to improve their policies for job scheduling and resource management for variable workload patterns.
IaaS Cloud Entity is used to simulate the public cloud’s behavior. It has sub-modules to simulate public clouds, which include cost calculation, VM management, storage service and network service module.
The cost calculation module calculates all cloud cost used by Cloud Application Management Entity. It generates the cost traces based on user-defined time interval and creates the final results when the simulation is completed.
The VM repository modulemanages the configurations of all VM types defined by the users and resembles the on-demand VM service of IaaS clouds. This module stores VM infor-mation to correctly measure VM usage cost and simulate job execution on VMs. Moreover, this module generates startup-delay for new VM creations based on user input, and simulates all operations of the VMs. This module also handles workloads on VM such as job execution and failure generation.
Storage service and network service module simulates file I/O and data transmission operations based on their configu-rations and the workload information. It generates the overall and real-time traces of the usage of storage and network services for the workloads.
IV. SIMULATORVALIDATION
A. Experiment Setup
In order to validate the simulation results of PICS, we compared PICS results with a real cloud application on AWS. We design and implement a cloud-application that executes user-applications with three different types of MapReduce [13] jobs and two job arrival patterns. The workflow of the cloud-application goes through the following five key steps: 1) Job execution time prediction via recent execution history, 2) EDF job scheduling, 3) Cost-based VM selection,
4) Deadline-based horizontal and vertical auto-scaling, and 5) Job Execution.
The cloud-application starts with receiving jobs from the end users. It conducts job execution time prediction via recent execution history for incoming jobs. The cloud-application schedules them by the EDF job scheduling and sends them to the work queue in the VMs of choice. For VM selection, this cloud-application usescost-based VM selection that selects the cheapest VM type that meets the deadline for a job. For the VM scaling, the cloud-application makes the scaling decision based on thedeadline-based horizontal and vertical auto-scaling. The cloud-application first determines the fastest possible response time for the new job based on the load of the job queues of active VMs. If the fastest possible response time still misses the job deadline, horizontal or vertical scaling is engaged. In the case of horizontal scaling, a new VM is created for the new job. In the case of vertical scaling, an active VM is “scaled-up” to a higher performance VM for the new job. Note that vertical scaling happens when there is a limit on the number of active VMs which prevents the creation of new VMs. Additionally, after each job finishes, the cloud-application checks active VMs. If the active VMs provide more than enough computation power to satisfy deadline requirements, then a “scale-down” happens to improve the cost efficiency. Once the current VM type is determined, the job is assigned to that VM forjob execution. For the validation of PICS, we use three types of MapRe-duce jobs (Word count, PI calculation, and Terasort) [4]. Word count is an I/O- and memory-bound job, and it uses S3 storage to download input dataset and upload the final result. PI calculation is a fully-parallelized CPU-bound job. Terasort is a standard Hadoop benchmark application. These jobs were randomly generated based on two arrival patterns (Poisson and Bursty). Poisson arrival pattern has an average job arrival interval of 30 seconds with a standard deviation of 29.63. Bursty pattern has an average job arrival interval of 15 seconds with a standard deviation of 11.50.
We deployed the cloud-application on AWS. The reasons that we use AWS for the PICS validation are as follows: 1) AWS is widely used public IaaS cloud; 2) according to recent works [16, 19–21], AWS EC2 performance fluctuates a lot and AWS has less predictability (higher variance) than other public
TABLE III: Simulation errors for horizontal scaling cases. Workloads Cost # of VMs VM Util. Job DL.
WL #1 3.1% 3.4% 1.1% 0.6% WL #2 2.4% 1.8% 1.4% 1.1% WL #3 1.8% 2.3% 0.7% 0.6% WL #4 5.2% 4.7% 2.2% 3.2% WL #5 2.2% 7.1% 1.6% 2.1% WL #6 0.8% 2.4% 2.4% 2.6% WL #7 2.6% 3.6% 0.5% 2.5% WL #8 3.6% 0.0% 1.0% 1.1% WL #9 1.5% 1.5% 0.7% 0.6% WL #10 0.9% 1.5% 0.9% 3.9% WL #11 1.0% 0% 2.2% 0.5% WL #12 6.1% 1.4% 1.3% 3.8% Average Error 2.6% 2.4% 1.3% 1.9%
IaaS clouds, therefore AWS is better than other IaaS clouds when evaluating the sensitivity of PICS to the performance uncertainty of public clouds. Our cloud-application uses four types of on-demand EC2 VM instances, which arem3.medium,
m3.large,m3.xlarge, andm3.2xlarge. These four types of EC2 on-demand instances are general purpose VMs and commonly used by the cloud users.
Based on the above experimental configurations, we created 16 validation workloads as shown in Table II. These workloads are categorized based on job arrival patterns (Poisson and bursty), job types, single or multiple VM types, and scaling policies. WL #1 – #6, #13, and #14 are for the tests under Poisson job arrival pattern, and others are for bursty arrival pattern. WL #1, #2, #7, #8 and #13 process word count jobs, WL #3, #4, #9, #10 and #14 handles PI calculation jobs, and WL #5, #6, #11 and #12 deal with Terasort jobs. WL #1, #3, #5, #7, #9, and #11 only use a single VM type (e.g.
m3.medium,m3.large, orm3.xlarge) in order to validate a case when a cloud-application uses a single type of VM. The others use all four types of general purpose EC2 instances. This is to test more complicated use cases for the VM resource management. For scaling validation, WL #1 – #12 are for horizontal scaling and WL #13 – #16 are for vertical scaling use cases. We submitted these 16 workloads to PICS and the cloud-application running on AWS, and measured the cloud cost, the total number of created VMs, VM utilization, and job deadline satisfaction rate. These metrics are expressed as equation – (1), (2), and (3). We then measured the simulation error by equation – (4) Cost=Pn i=1costV Mi (1) V M U tilization= Pn i=1T imeJ obExec.,V Mi Pn i=1T imeT otalRun.,V Mi (2)
J ob DL Satisf action Rate=NDeadlineSatisf iedJ obs
NAllJ obs (3) Simulation Error= Actual−Simulation Actual ×100% (4)
B. Horizonal Scaling Cases
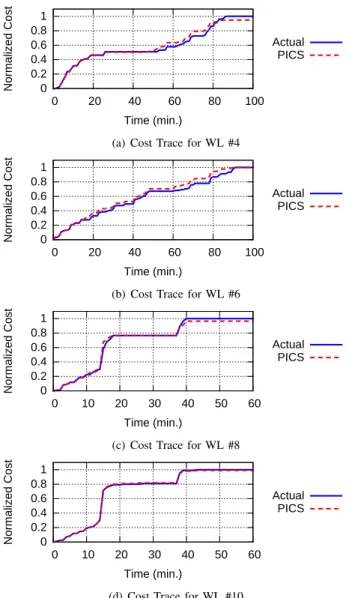
We use 12 workloads (WL #1 – #12) for the validation of horizontal scaling cases. The “Cost” column of Table III shows PICS simulation error of the overall cloud cost over the actual measurements on AWS. The average error of the cloud cost from PICS is only 2.6% compared to the actual results. The highest error is only 6.1% (WL #12). A more important metric is the cost trace because it shows how accurately PICS simulates the behavior of the cloud-application and public
0 0.2 0.4 0.6 0.8 1 0 20 40 60 80 100 Normalized Cost Time (min.) Actual PICS
(a) Cost Trace for WL #4
0 0.2 0.4 0.6 0.8 1 0 20 40 60 80 100 Normalized Cost Time (min.) Actual PICS
(b) Cost Trace for WL #6
0 0.2 0.4 0.6 0.8 1 0 10 20 30 40 50 60 Normalized Cost Time (min.) Actual PICS
(c) Cost Trace for WL #8
0 0.2 0.4 0.6 0.8 1 0 10 20 30 40 50 60 Normalized Cost Time (min.) Actual PICS
(d) Cost Trace for WL #10
Fig. 2: Cost trace for horizontal scaling cases.
IaaS cloud at fine-grained intervals. To show these traces, we select four complicated workloads, which are WL #4, #6, #8, #10. Fig. 2 shows these four cost traces. The other workloads have similar results. As shown in Fig. 2, PICS is able to accurately calculate the cloud cost at each time interval, demonstrating that PICS correctly resembles the behavior of the cloud-application and public IaaS cloud for each step of execution.
The simulation error of created VM numbers over the actual measurements are shown in the “# of VMs” column of Table III. PICS can highly accurately calculate the number of created VMs with an average error of 2.4%. The highest error is only 7.1% (WL #5). For the workloads that use multiple types of VMs, a precise simulation of the number of VMs for each VM type is also critical to the cloud users to determine if PICS can accurately resemble the cloud-application’s resource management policies (VM selection and scaling) and public cloud’s behaviors. Fig. 3 shows the result of the number of created VMs for each VM type for four workloads (WL #4, #6, #10, #12). The other workloads have similar results. As Fig. 3 shows, PICS can also accurately simulate the VM numbers for
0 0.2 0.4 0.6 0.8 1 WL#4 WL#6 WL#10 WL#12 Norm. VM Numbers Workloads M L XL 2XL
Fig. 3: The VMs numbers per VM type, normalized over the actual measurement (M: m3.medium, L: m3.large, X: m3.xlarge, XL: m3.xlarge) 0 0.2 0.4 0.6 0.8 1 WL#4 WL#6 WL#10 WL#12 Norm. VM Util. Workloads M L XL 2XL
Fig. 4: The VM utilizations per VM type, normalized over the actual measurement (M: m3.medium, L: m3.large, X: m3.xlarge, XL: m3.xlarge)
each type of VMs. For the horizontal scaling cases, the cloud-applicatoin created an average of 42.5 VMs and the range of the created number of actual VMs is from 15 (WL #5) to 70 (WL #12).
Similarly, the overall simulation error of VM utilization are shown in the “VM Util.” column of Table III, while the detailed per-VM type utilization results are shown in Fig. 4. Average error of overall VM utilization results between the actual measurements and the simulations is only 1.3%. For the detailed results, PICS is able to accurately simulate the utilization for each VM type with 0.5 – 2.4% of simulation error for most cases. The worst case is m3.large instance of WL #4 and the simulation error is only 5.8%.
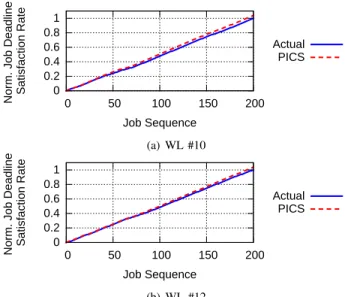
In addition, we conducted a validation focusing on job deadline satisfaction rate. Deadline satisfaction rate is an important metric for a application to ensure the cloud-application’s job scheduling and resource management policy meets certain temporal requirements, such as those found in SLA. We measured the job deadline satisfaction rates of PICS, and compared them with the results of the actual cloud-application on AWS. Note that the deadlines in our workload are generated randomly. The overall results are shown in the “Job DL.” column of Table III. The average error of PICS is only 1.9%. The worst case error is about 4% (WL #10, #12). More importantly, we measured the traces for job deadline satisfaction because we want to determine if PICS can precisely simulate whether a particular job satisfies its deadline or not. Fig. 5 shows the job traces for two worst workloads (WL #10, #12). Fig. 5 shows that, even for the worst cases, PICS accurately simulates the behavior of AWS at every phase of the execution.
We also measured the VM scaling of the actual cloud-application on AWS and PICS, over the whole course of the execution. Due to space limitation, Fig. 6 shows the scaling traces for only four workloads (WL #4, #8, #10, #12). The other workloads have similar behaviors. As shown in Fig. 6, traces from PICS and the actual cloud-application closely
0 0.2 0.4 0.6 0.8 1 0 50 100 150 200 Norm. Job Deadline Satisfaction Rate Job Sequence Actual PICS (a) WL #10 0 0.2 0.4 0.6 0.8 1 0 50 100 150 200 Norm. Job Deadline Satisfaction Rate Job Sequence Actual PICS (b) WL #12
Fig. 5: Job deadline satisfaction traces for horizontal scaling cases.
0 0.2 0.4 0.6 0.8 1 0 20 40 60 80 100 120 140 Norm. VM N umber Time (min.) Actual PICS
(a) VM scaling trace for WL #4
0 0.2 0.4 0.6 0.8 1 0 20 40 60 80 100 120 140 Norm. VM N umber Time (min.) Actual PICS
(b) VM scaling trace for WL #8
0 0.2 0.4 0.6 0.8 1 0 20 40 60 80 100 Norm. VM N umber Time (min.) Actual PICS
(c) VM scaling trace for WL #10
0 0.2 0.4 0.6 0.8 1 0 20 40 60 80 100 Norm. VM N umber Time (min.) Actual PICS
(d) VM scaling trace for WL #12 Fig. 6: Horizontal VM scaling traces.
TABLE IV: Simulation errors for vertical scaling cases. Workloads Cost # of VMs VM Util. Job DL.
WL #13 6.1% 7.1% 4.3% 0.8% WL #14 3.1% 1.9% 2.4% 4.6% WL #15 3.2% 3.4% 1.7% 1.9% WL #16 9.7% 1.9% 3.3% 3.2% Average Error 5.5% 3.6% 2.9% 2.6% 0 0.2 0.4 0.6 0.8 1 0 50 100 150 200 250 Normalized Cost Time (min.) Actual PICS
(a) VM Cost Trace for WL #13
0 0.2 0.4 0.6 0.8 1 0 20 40 60 80 100 120 140 160 180 Normalized Cost Time (min.) Actual PICS
(b) VM Cost Trace for WL #16 Fig. 7: Cost traces for vertical scaling cases.
match each other, which means PICS accurately simulates horizontal scaling at every phase of the execution. For the VM scaling traces, the average number of running VMs in parallel (by the cloud-application) is 39 and the cloud-application runs from 12 (WL #5) to 70 VMs (WL #12) in parallel.
C. Vertical Scaling Cases
Due to the importance of vertical scaling in the near future, PICS also supports vertical scaling simulation. We validate the results involving vertical scaling using four workloads (WL #13 – #16). Note that for these experiments, both horizontal and vertical scaling are enabled, similar to real-life usages of cloud services. Table IV shows the overall simulation errors for vertical scaling cases. The results show that PICS can accurately simulate the overall results for vertical scaling workloads: for the cloud cost, the average error is only 5.5% (“Cost” column); for the number of created VMs, the average error is only 3.6% (“# of VMs” column); for the VM utilization, the average error is only 2.9% (“VM Util.” column); for deadline satisfaction, the average error is only 2.6% (“Job DL.” column).
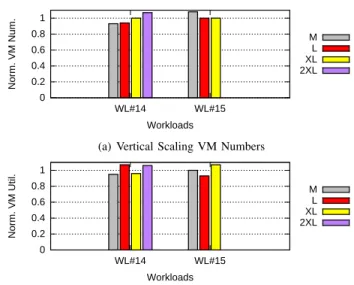
To demonstrate the accuracy of PICS simulation at fine-grained time intervals and resource types, we present the detailed results for these measurements, which are the cost traces, the number of created VMs per VM type, the VM utilizations for each VM type, and the deadline satisfaction traces. Fig. 7 shows the cost traces for WL #13 and #16, which are two worst cases for the vertical scaling validations. Even for these two worse cases, the cost trace results from PICS closely resemble with the actual measurements. Fig. 8(a) shows the normalized results for the number of created VM for other two workloads (WL #14, #15). The results show that PICS has only 8.3% simulation error in the worst case
0 0.2 0.4 0.6 0.8 1 WL#14 WL#15 Norm. VM Num. Workloads M L XL 2XL
(a) Vertical Scaling VM Numbers
0 0.2 0.4 0.6 0.8 1 WL#14 WL#15 Norm. VM Util. Workloads M L XL 2XL
(b) Vertical Scaling VM Utilization
Fig. 8: The VM numbers (a) and utilizations (b) per VM type, nor-malized over the actual measurement (M: m3.medium, L: m3.large, X: m3.xlarge, XL: m3.xlarge)
(m3.medium instance of WL #15). Fig. 8(b) represents the utilization for each VM type. In the worst cases (m3.large
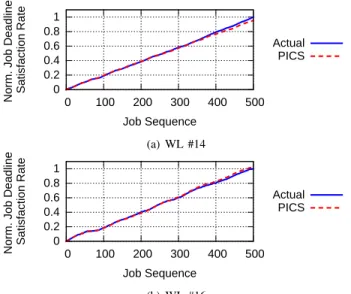
of WL #14), PICS has 7.3% simulation error. Fig. 9 gives the job deadline satisfaction rate traces for the two worse cases workloads (WL #14 and #16). Both the PICS and real measurement trace curves in Fig. 9 closely match each other. Based on the results in Fig. 7 to 9, we can conclude that PICS can also accurately simulate the detailed results of the cloud cost, the VM creation, the VM utilization and the deadline satisfaction rate for each VM type and at fine-grained time intervals.
For the last validation of the vertical scaling cases, we measured the number of vertical scaling decisions for the four workloads. These results are used to show how PICS accurately simulates the vertical scaling operations. The results are shown in Fig. 10. For the total number of vertical scaling decisions, PICS has only 3.5% average error. Average error for scaling-up is 6.7% and average error for scaling down decision is 6.3%. PICS also has less than 10% of simulation errors in every scaling decision for all four workloads. These results imply that PICS can precisely simulate the vertical scaling operations of the cloud-application on real public cloud. For the best of our knowledge, PICS is the first cloud simulator that supports the vertical resource scaling simulation.
V. DISCUSSION
The previous section demonstrates that PICS accurately simulates the behavior of cloud-application and public IaaS. However, the accuracy of PICS depends on the accuracy of user-provided parameters and configurations. Although users can provide accurate values for most parameters and config-urations with ease, one parameter – the job execution time – may be difficult to acquire precisely. The difficulty comes from the performance uncertainty of real public clouds [19–21]. In our experiments, we used the average execution time from 800 samples (i.e., 800 executions on AWS) for each job type and
0 0.2 0.4 0.6 0.8 1 0 100 200 300 400 500 Norm. Job Deadline Satisfaction Rate Job Sequence Actual PICS (a) WL #14 0 0.2 0.4 0.6 0.8 1 0 100 200 300 400 500 Norm. Job Deadline Satisfaction Rate Job Sequence Actual PICS (b) WL #16
Fig. 9: Job deadline satisfaction traces for vertical scaling cases
0 2 4 6 8 10 WL#13 WL#14 WL#15 WL#15 V ertical Scaling Simulation Error(%) Workloads Total Scale-Up Scale-Down
Fig. 10: Simulation errors for the numbers of vertical scaling deci-sions
VM type. However, in real practice, it may not be feasible for the users to acquire such high number of samples. That is, the users may provide inaccurate job execution time to the simulator. In this section, we analyze the impact of imprecise job execution time on simulation accuracy. More specifically, we seek the answers to the following questions:
1) How much error should we expect from the use-provided parameter of job execution time?
2) What is the accuracy of PICS if the parameter of job execution time has certain errors?
To answer the first question, we extensively analyzed our job execution samples on AWS. The analysis shows that the majority of the samples have execution times within 10% of the average execution time (for one job type running on one VM type). On average, 88% of samples have at most 10% errors. Moreover, the maximum difference between a sample and the average execution time is 22%. These findings corroborate the results from previous work [16]. In short, user-provided job execution times are expected to have less than 10% error in most cases, while maximum errors not exceeding 22%.
TABLE V: Simulation Errors when the job execution time parameter has±10%and±20%errors.
Err. in Params Cost # of VMs VM Util. Job DL.
-20% 16.2% 13.5% 0.9% 5.96% -10% 7.5% 6.3% 0.9% 4.25% +10% 4.6% 4.7% 0.2% 3.31% +20% 13.8% 11.7% 1.9% 2.01% 0 0.2 0.4 0.6 0.8 1 1.2 0 20 40 60 80 100 Normalized Cost Time (min.) +20% +10% Actual -10% -20%
(a) WL #6 with imprecise parameter
0 0.2 0.4 0.6 0.8 1 1.2 0 10 20 30 40 50 60 Normalized Cost Time (min.) +20% +10% Actual -10% -20%
(b) WL #10 with imprecise parameter
Fig. 11: Cost traces of simulations with ±10% and ±20% of imprecise job execution time parameter.
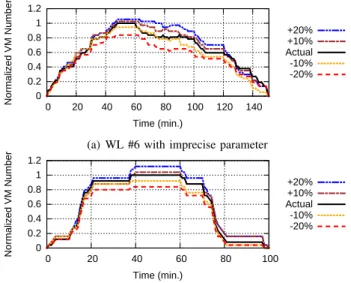
To answer the second question, we simulated the 16 work-loads again using job execution times with±10%and±20% errors. These errors represent the aforementioned expected and maximum errors from user inputs. TABLE V shows the average errors for the 16 workloads with imprecise job execution time parameter in PICS. Fig 11 and Fig 12 show the cost and horizontal scaling traces of selected two workloads with imprecise parameters. (The other workloads have similar results.) These table and figures show that the errors of PICS are considerably smaller than the errors in the job execution time parameter, and PICS retains high accuracy even when user provides imprecise job execution time parameter.
We observed that PICS has lower errors than the parameter of job execution time for two reasons:The first reason is that the running times of low-load VMs are less susceptible to input errors. Because of we used large workloads with varied job arrival times, many VMs have only a small number of jobs to execute. These VMs are usually created during periods with low job arriving rates. The running times of these low-load VMs have large fluctuations due to real cloud’s unstable performance. Because of this fluctuation, the running time of many low-load VMs is close to the simulation based on the imprecise job execution time. Moreover, the execution time of a low-load VM is also considerably affected by the VM start-up time, which further reduces the impact of the imprecise parameter. The second reason is the horizontal “scale-in” policy of our resource manager. Our resource manager keeps VMs alive for some time in the anticipation of new jobs. Thus, the total running time of a VM is longer than the total execution time of its jobs, which reduces the impact of imprecise parameter of the job execution time.
In summary, due to the performance uncertainty in real clouds, user-provided job execution time usually has less than 10% errors, with a maximum error of 22%. With these potential input errors, the PICS simulator can provide reliable results to help users to assess their cloud application and services.
0 0.2 0.4 0.6 0.8 1 1.2 0 20 40 60 80 100 120 140 Normalized VM Number Time (min.) +20% +10% Actual -10% -20%
(a) WL #6 with imprecise parameter
0 0.2 0.4 0.6 0.8 1 1.2 0 20 40 60 80 100 Normalized VM Number Time (min.) +20% +10% Actual -10% -20%
(b) WL #11 with imprecise parameter
Fig. 12: Horizontal VM Scaling Traces of simulations with ±10% and ±20%of imprecise job execution time parameter.
VI. CONCLUSION
In order to answer for potential cloud users’ questions about
evaluating the public clouds without actually deploying the cloud-application, we have created PICS, a public IaaS cloud simulator. PICS provides the capabilities for accurately evalu-ating the cloud cost, resource usages (VM scaling, utilization, and the number of VMs), and job deadline satisfaction rate. In this paper, we describe the configurations and architecture of PICS, and validate the accuracy of PICS by comparing it with actual measurements from a real cloud-application on real public IaaS cloud. The validation results show that PICS very accurately simulates the behaviors of the cloud-application and public IaaS clouds (with less than 5% of average errors). Moreover, we show the sensitivity of PICS with an imprecise simulation parameter (job execution time with ±10% and
±20% errors). The results show PICS still provides very reliable simulation results with the imprecise parameter. These results demonstrated that PICS is both versatile and reliable for cloud user to evaluate the public clouds without actually deploying the cloud-application.
In the near future, we will have more comprehensive valida-tions of PICS with three different direcvalida-tions. The first direction is to show the correctness of PICS with cloud-applications on other public cloud services such as Microsoft Azure [2] and Google Compute Engine [3]. Validating PICS on the different cloud providers is particularly important to demonstrate the simulation correctness and generalizability of PICS, because these cloud providers have different performance of VMs and cloud services (e.g. storage and network) as well as differ-ent cost models for cloud usages (e.g. minute-based billing model). The second direction is validating PICS with other cloud-applications and resource management policies. We will use n-tier web and scientific/big-data analytics applications with various management configurations because these are the common cloud-application deployment models for industry and research community. Furthermore, we will validate PICS based on the other metrics such as storage and network I/O
usage.
VII. ACKNOWLEDGMENT
The authors would like to thank the anonymous reviewers for their valuable comments and suggestions to improve the quality of the paper.
REFERENCES
[1] Amazon Web Services. http://aws.amazon.com. [2] Microsoft Azure. http://azure.microsoft.com.
[3] Compute Engine - Google Cloud Platform.
https://cloud.google.com/compute/. [4] Apache Hadoop. http://hadoop.apache.org.
[5] The Network Simulator – ns-2. http://www.isi.edu/nsnam/ns. [6] PICS Project Web Site. http://goo.gl/jnR22T.
[7] RightScale. http://www.rightscale.com. [8] SCALR. http://www.scalr.com.
[9] R. Appuswamy and et al. Scale-up vs Scale-out for Hadoop: Time to rethink? InACM Sym. on Cloud Computing (SoCC), 2013.
[10] M. Bux and U. Leser. DynamicCloudSim: Simulating Hetero-geneity in Computational Clouds. InACM SIGMOD Workshop on Scalable Workflow Execution Engines and Technologies (SWEET), 2013.
[11] R. N. Calheiros and et al. Cloudsim: A toolkit for modeling and simulation of cloud computing environments and evaluation of resource provisioning algorithm. Software: Practice and Experience, 41(1):23–50, 2011.
[12] W. Chen and E. Deelman. WorkflowSim: A Toolkit for Simulating Scientific Workflows in Distributed Environments. InIEEE Int’l Conf. on eScience (eScience), 2012.
[13] J. Dean and S. Ghemawat. MapReduce: Simplified Data Processing on Large Clusters. InUSENIX Sym. on Operating Systems Design & Implementation (OSDI), 2004.
[14] S. K. Garg and R. Buyya. NetworkCloudSim: Modelling Parallel Applications in Cloud Simulations. InIEEE Int’l. Conf. on Utility and Cloud Computing (UCC), 2011.
[15] D. Kliazovich and et al. GreenCloud: a packet-level simulator of energy-aware cloud computing data centers. Journal of Supercomputing, 62(3):1263–1283, 2012.
[16] P. Leitner and J. Cito. Patterns in the Chaos – a Study of Performance Variation and Predictability in Public Iaas Clouds. CoRR, abs/1411.2429, 2014.
[17] M. Mao and M. Humphrey. A Performance Study on the VM Startup Time in the Cloud. InIEEE international Conference on Cloud Computing (CLOUD), 2012.
[18] A. Nunez and et al. iCanCloud: A Flexible and Scalable Cloud Infrastructure Simulator. Journal of Grid Computing, 10(1): 185–209, 2012.
[19] Z. Ou and et al. Exploiting Hardware Heterogeneity within the Same Instance Type of Amazon EC2. InUSENIX Workshop on Hop Topics in Cloud Computing (HotCloud), 2012.
[20] J. Schad and et al. Runtime Measurements in the Cloud: Observing, Analyzing, and Reducing Variance. Proc. of the VLDB Endowment, 3(1–2):460–471, 2010.
[21] M. Schwarzkopf and et al. The Seven Deadly Sins of Cloud Computing Research. InUSENIX Workshop on Hop Topics in Cloud Computing (HotCloud), 2012.
[22] B. Wickremasinghe and et al. CloudAnalyst: A Cloudsim-based Visual Modeller for Analysing Cloud Computing Environments and Applications. InIEEE Int’l. Conf. on Advanced Information Networking and Applications (AINA), 2010.