The following full text is a publisher's version.
For additional information about this publication click this link.
http://hdl.handle.net/2066/161466
Please be advised that this information was generated on 2017-12-06 and may be subject to
change.
AND FUNCTION FOR SP
ACE IN THE BRAI
N
To
bias Navarro Schröde
r
INVITATION
On Monday December 19th, 2016
At 14:30pm precisely
I will defend my thesis entitled
GRIDS
and
GRADIENTS
Structure and function
for space in the brain
In public at the aula
of the Radboud University
Comeniuslaan 2, Nijmegen
You are cordially invited
to join this ceremony and
the reception afterwards
Tobias Navarro Schröder
Paranymphs:
Laura Iaciofano
[email protected]
David Neville
[email protected]
STRUCTURE AND FUNCTION FOR SPACE IN THE BRAIN
Doctoral Thesis
Tobias Navarro Schröder
Research Council (ERC-StG RECONTEXT 261177) awarded to Dr. Christian Doeller. ISBN: 978-94-6284-084-3
Printed by Ridderprint B.V. | www.ridderprint.nl
Cover design and layout by Jardine Media | www.jardinemedia.com Design of grid pattern by Oliver Navarro Schröder | www.olivernavarro.de
STRUCTURE AND FUNCTION FOR SPACE IN THE BRAIN
PROEFSCHRIFT
ter verkrijging van de graad van doctor aan de Radboud Universiteit Nijmegen
op gezag van de rector magnificus prof. dr. J.H.J.M. van Krieken, volgens besluit van het college van decanen
in het openbaar te verdedigen op maandag 19 december 2016 om 14.30 uur precies
door
Tobias Navarro Schröder
geboren op 31 juli 1983 te Ostercappeln (Duitsland)
COPROMOTOR: Prof. dr. C.F. Doeller
MANUSCRIPTCOMMISSIE: Prof. dr. T. Çelikel
Dr. C. Barry
(University College London, Verenigd Koninkrijk) Prof. dr. R.P.C. Kessels
Chapter 1 | General introduction and outline of the thesis 7 Chapter 2 | Functional topography of the human entorhinal cortex 21 Chapter 3 | Trigonometric computations in entorhinal cortex support wayfinding 49 Chapter 4 | Laminar triple dissociation for spatial cognition in entorhinal cortex 79
Chapter 5 | General discussion 95
References 107 Nederlandse samenvatting 121 Acknowledgements 127 List of publications 131 Curriculum Vitae 133 Underlying datasets:
• FMRI study on spatial and non-spatial processing (7 Tesla, N = 21): Chapter 2.
• FMRI study on spatial navigation at submillimetre resolution (7 Tesla, N = 26): Chapter 2 to chapter 4. • FMRI study on resting-state activity (3 Tesla, N = 60; The Human Connectome Project): chapter 2. • FMRI study on spatial navigation (3 Tesla, N = 25): Chapter 3.
• Computational modelling study on optimal path angles for triangulation: Chapter 3 • Behavioural study on human distance estimation (N = 20): Chapter 3.
General introduction and
outline of the thesis
1
CHAPTER
INTRODUCTION
Without looking up from this thesis, it is most likely an easy feat for you to recall the location of a characteristic landmark in your environment relative to your own, such as the door you last passed through. This inconspicuous ability of ours actually reflects some amazing evolutionary achievements. Without having to look we can maintain a spatial representation of our environment for long periods of time and we can mentally travel back to re-visit previous locations, such as the door we last past through. Even if you were to close your eyes, and walk a few meters in an arbitrary direction, your estimate of the direction and the distance to the door would likely be reasonably accurate (Loomis et al., 1993). Similarly, in larger sparse environments people can directly return to a start location after a long, erratic outwards journey without direct vision, as Darwin already noted in 1873 (Darwin, 1873). Based on studies in rats and in humans, in the 1930s Tolman suggested, that some animals, such as mammals possess a ‘cognitive map’ (Tolman, 1948) of the spatial layout of the environment. He put forward the idea that this internal map could be used for sophisticated navigation. For example, to find the optimal path through an environment, to plan detours around obstacles and to take novel shortcuts where possible. During his time, however, behaviourism provided the dominant framework to explain learning and memory, which was seen as the result of direct associations between stimuli (such as the view of a spatial scene or a landmark) and responses (e.g. turn left at the bakery and walk ten steps). Stimulus-response matching or rule-based mechanisms can indeed explain various simple forms of navigation behaviour. However, Tolman’s suggestion went much further, since it proposed a mental process of an internalised Euclidean map that represented the spatial layout of the surrounding and could be used for planning and execution of navigation and wayfinding. Due to a lack of technological means at his time the suggested cognitive map constituted essentially unobservable processes in the ‘black box’ of the brain. His hypothesis, therefore, lay dormant for a number of decades.
Opening the ‘black box’
It was not until 1978 that O’Keefe and Nadel revived the cognitive map hypothesis in an influential book proposing not only that many animals indeed possess such a spatial representation, but that it can be localised to a specialised brain region called the hippocampus, located deep in the brain’s temporal lobes (O’Keefe & Nadel, 1978). This brain region, named for the resemblance of its shape to that of a sea horse (Per Andersen, Morris, Amaral, Bliss, & O’Keefe, 2007), was considered to play a fundamental role in long-term associative memory. This idea was strongly influenced by a case report of the effects of surgical removal of both hippocampi and neighbouring regions in patient ‘H.M.’ (Scoville & Milner, 1957). This resulted in severe anterograde amnesia (the patient could no longer form new episodic memories) and a partial retrograde amnesia (the patient
1
could no longer recall some memories of events that occurred before the surgery). These drastic impairments seen in the case of patient H.M. helped to establish a link between the hippocampus and memory. One insight was that perceptual-, cognitive- and motor skills are preserved in amnesia (N. J. Cohen & Squire, 1980; Squire & Wixted, 2011), which was the basis for the proposal of two distinct neural systems for memory, one supporting declarative knowledge and the other procedural knowledge. Declarative knowledge refers to memories that can be explicitly verbalized, such as memory for facts or experienced events. Hippocampal damage strongly affects recently acquired declarative memory, which led to the standard model of systems consolidation stating that over time structural changes in the neocortex render these memories independent of the hippocampus (Frankland & Bontempi, 2005; Squire., R. Larry & Alvarez., 1995). Procedural knowledge refers to memories for acquired skills, such as playing a musical instrument (Squire & Wixted, 2011), which appear to rely on different brain structures than the hippocampal formation.
Traces of the cognitive map
To directly study the function of neuronal activity in the hippocampus new techniques were developed, which involved electrical recordings in freely behaving rats. These showed that electrical signals differed depending on the behaviour of the animal, e.g. sitting still compared to moving (Vanderwolf, 1969). John O’Keefe and his student Dostrovsky perfected this method and related the activity of single cells to the behaviour of a freely moving animal, which led to the discovery of so-called ‘place cells’ in the hippocampus (O’Keefe & Dostrovsky, 1971). These cells fired whenever the animal would pass a certain part of its environment, apparently independent of movement direction or the motivation to reach that location. In 1978 O’Keefe and Nadel aggregated these empirical findings into a theoretical framework, suggesting that a representation of the environment in the hippocampus can be used to calculate efficient paths, building on the behavioural work from Tolman. However, their proposal went beyond Tolman’s suggestion. They proposed that the hippocampus provides not only a framework for navigation, but is also the core of a spatial scaffold within which elements and events of one’s experience are located and interrelated. As such, it might be essential for the formation of episodic, autobiographical memory that defines a fundamental aspect of human lives.
The grid: microstructure of a spatial map
But what enables the location-specific responses of place cells? Edvard and May-Britt Moser showed that place cells still fired at specific locations even after severing important intra-hippocampal connections between subregion CA3 and CA1 (Brun et al., 2002). The internal hippocampal circuitry could thus not be uniquely responsible to compute this spatial signal. Coming back to the initial example, to determine the location of the door you last passed through requires both a direction and a distance estimate. In terms of anatomy, place cells in the hippocampus are located at the top of a cortical hierarchy (Felleman & Van Essen, 1991), far removed from sensory organs, and they can be modulated by widely different inputs such as odor, vision or haptic information (Knierim, 2015), suggesting their activity reflects the integration of heterogeneous processes. Further electrophysiological research in freely moving rodents discovered the existence of head-direction cells in the postsubiculum (Ranck, 1984) that fired whenever the animal’s head pointed in a certain direction, independent of location, thereby signaling absolute direction akin to a compass. Later, they were found in various other regions such as the thalamus and the entorhinal cortex (Taube, 2007). The entorhinal cortex has a unique anatomical position that constitutes the main interface for connections from the cortex to the hippocampus and back (Canto, Wouterlood, & Witter, 2008; Figure 1). In search for the origin of the spatial activity of place cells in the hippocampus, Edvard and May-Britt Moser studied activity in the main input region to the hippocampus – the superficial layers of the medial entorhinal cortex of rats (Venkhatesh, 2015). This led to the discovery of grid cells in 2005 (Hafting, Fyhn, Molden, Moser, & Moser, 2005), which fire in a remarkable tiling pattern, at the vertices of roughly equilateral triangles. Their activity pattern has been suggested to reflect a metric system for space (Buzsáki & Moser, 2013; Hafting et al., 2005) and to play a role in the ability to return back to a start location after a complex outwards path and without vision, termed ‘path integration’ (McNaughton, Battaglia, Jensen, Moser, & Moser, 2006). In 2014, John O’Keefe and Edvard and May-Britt Moser jointly received the Nobel Prize in physiology and medicine for their seminal discoveries (The Nobel Committee for Physiology or Medicine, 2014). This gave recognition to the enormous potential that their achievements opened up for understanding cognition from a system perspective that integrates the diverse levels of description of molecules and cells, circuits, the organism and its behaviour in the world.
More knowledge, more questions
However, there remains a vast gap between the astounding insights from many studies in rodents and our understanding of the human brain and its physiology. The evolutionary invention of spatial knowledge may have served as a prototype for more complex kinds of knowledge, shaping our ability to organise and remember our experiences (Jeffery, 2003),
1
but we are still far away from an understanding of the architecture of the cognitive map in terms of structure (e.g. anatomical circuitry) and function (e.g. geometrical computations) in any species. This may ultimately open a door to understand the nature of other kinds of knowledge and help to create technologies for autonomous wayfinding.
In this thesis, I will try to close the gap between research on the architecture of spatial cognition and memory in humans and in other animals by studying structure-function relationships at the interface between the hippocampus and the neocortex - the entorhinal cortex - during navigation in humans. To this end I employ methodological approaches, such as functional magnetic resonance imaging (fMRI), virtual reality navigation, behavioural testing and computational modelling. Crucially, these methods unfold a larger potential to generate new insights if used in combination with each other and when they are integrated with findings from the diverse studies on the anatomical organization and electrophysiological functions of the circuitry for spatial behaviour and memory in the medial temporal lobes across species. Below I will elaborate on the methodological approaches used in this thesis.
Structure and function in cognitive neuroscience.
The general approach of this thesis pertains to the field of cognitive neuroscience, which is derived from the Greek word gnόsis meaning knowledge (Franchi, 2011) and neuron meaning ‘sinew, tendon’ (Pearsall & Hanks, 1998). As such, cognitive neuroscience inherently addresses the interrelationship between the fast dynamics of functional behaviour or mental faculties and their more slowly changing biological structures. An important contribution to the structural foundations of cognitive neuroscience were made by Korbinian Brodmann at the beginning of the twentieth century. Equipped with a microscope and dyes to stain tissue and highlight the morphology and arrangement of different types of cells, he realised that different patches of the mammalian neocortex could be distinguished solely based on their cytoarchitecture, e.g. the size, shape and arrangement of cells and the relative thickness and composition of the six neocortical layers (Brodmann, 1909). With this method, he could map out brain regions based on structure that were differentially involved in function and behaviour, as became clearer later on, such as the sensory and motor cortices. In addition, famous case studies of patients with (structural) lesions limited to certain parts of the brain showed that the subsequent functional deficits were often also limited to certain abilities, such as the formation of autobiographical or declarative (verbal) memories in the case of patient H.M. This localisation of brain function played an important role in cognitive neuroscience, but has some significant limitations for supporting a deeper understanding of brain functioning. A purely modular view of brain function gives no credit to the fact that most functions employ wide arrays of brain regions, for example there is
no ‘single location of memory’ (Lashley, 1950) and even sensory processing appears to be sparse and distributed (Lin, Bygrave, de Calignon, Lee, & Miesenböck, 2014). Therefore, more recent approaches focus on network dynamics and structures, at different levels of description and in combination with computational models to gain understanding of the causal mechanisms that can explain how cognitive abilities can arise (Poldrack & Farah, 2015).
Anatomy of the hippocampal formation
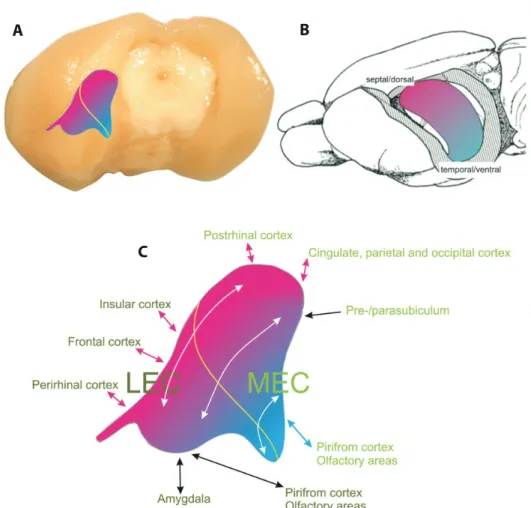
The entorhinal cortex together with the rest of the hippocampal formation (i.e. the hippocampus proper with the dentate gyrus, the cornu Ammonis areas and the subiculum) have a well organised intrinsic and extrinsic pattern of connectivity that is relatively well preserved across species (Canto et al., 2008). Figure 1 illustrates the location of the two main subregions of the rat entorhinal cortex (MEC and LEC) and their very different cortical connectivity profiles.
Diverse neocortical regions have anatomical connections that converge on the hippocampal formation, the apex of a cortical hierarchy (Felleman & Van Essen, 1991). At the level of the EC the two main subregions differ not only in their connectivity profiles and cytoarchitecture, but also show different functional signatures. For example, the LEC harbours cells that can respond to the identity of single objects (Deshmukh & Knierim, 2011; Knierim, Neunuebel, & Deshmukh, 2014; Tsao, Moser, & Moser, 2013), whereas the MEC harbors cells that signal general aspects of space, such as head direction cells for a compass-like signal and grid cells for a map-like signal (Hafting et al., 2005; Sargolini et al., 2006). However, the object responses in LEC can also be linked to a given spatial location (Tsao et al., 2013) and the spatial responses in the MEC can be linked to a single landmark (Hafting et al., 2005), highlighting the interrelatedness of their respective functions. A structural characteristic of the entorhinal cortex is an apparently modular organisation with cell-dense patches or islands that forms bumps on the cortical surface, the so-called ‘verrucae’ that are visible by eye on gross dissections of human brains (Augustinack et al., 2011; Klingler, 1948). A similar organisation has been described in rats (Burgalossi et al., 2011). One hypothesis suggested ‘isomorphic mapping’ between the structural array of entorhinal islands and the functional array of the spatial activity of grid cells (Brecht et al., 2014), however the actual mechanisms remain unknown. Both intrinsic and extrinsic connectivity is likely to play a role for the activity of grid cells.
1
A
B
C
FIGURE 1 | Schematic representation of the structure of the entorhinal cortex and hippocampus (shown on a rat brain).
A Posterolateral view of the left entorhinal cortex. The yellow line indicates the border between the
medial and the lateral subdivision. B Schematic representation of the hippocampus in dorsoventral extent. The pink-to-blue colour gradient shows the longitudinal organisation of entorhinal-hippocampal connectivity that are related to the same colours in A and C, which show medial-to-lateral organisation in the entorhinal cortex. C Schematic illustration of the main connections of the entorhinal cortex with the neocortex. Note that 1) the two subdivisions, the medial medial and the lateral entorhinal cortex (MEC and LEC, respectively) differ in their connectivity patterns and 2) they are not simply divided medially and laterally as their name suggests, but rather also posterior-dorsally and anterior-ventrally. White arrows indicate bands of intrinsic connectivity along the mediolateral axis. The main connectivity patterns highlight the crucial role of the entorhinal cortex in mediating interactions between both anterior and posterior regions of the neocortex with the hippocampal formation. (Adapted from Witter, 2011; Creative Common license).
EC
Neocortex
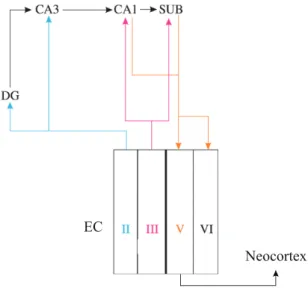
FIGURE 2 | Simplified connectivity between the entorhinal cortex and the hippocampus.
In transversal cross-sections, the hippocampal circuitry is characterised by projections from entorhinal layer II and III to the hippocampus. Projections from EC layer II to DG constitute the entry point of the classical ‘trisynaptic pathway’ that subsequently includes projections from DG to CA3 and from CA3 to CA1. This has become known as the indirect pathway to CA1, whereas projections from EC layer III to CA1 provide the direct pathway. Both CA1 and the subiculum send back projections to the deep layers of the EC, which in turn project back to the neocortex. CA cornu ammonis. SUB subiculum. EC entorhinal cortex. Roman numbers denote cortical layers. Note that the circuit consists of multiple, parallel loops. Based on Witter, Canto, Couey, Koganezawa, & O’Reilly, 2014.
Within the hippocampal formation there are parallel loops of connectivity, some of which are shown in Figure 2 (simplified illustration based on Witter, Canto, Couey, Koganezawa, & O’Reilly, 2014). Particular differences can be noted with respect to cortical laminae. Entorhinal layer II cells mainly project to the dentate gyrus and hippocampal field CA3, and neurons in layer III largely target field CA1 and the subiculum. Hippocampal output reaches the entorhinal cortex mainly through the deep layers V and VI, which also constitute the origin of widespread reciprocal projections to the rest of the brain. As such the entorhinal cortex forms the main gatekeeper between neocortex and hippocampus and will be the focus of this thesis. Despite a large number of studies on structure and function, the mechanistic role of the entorhinal cortex in spatial navigation and memory remains poorly understood. It appears to specifically support translation of sensory information into higher order representations, such as conscious memory (Eichenbaum, Yonelinas, & Ranganath, 2007).
1
Important insights into the anatomy and the neurophysiology of the hippocampal formation relied on novel techniques that used invasive, in-vivo electrical recordings or post-mortem axonal tracings in non-human animals. These approaches have two disadvantages. Firstly, they sample only a very limited part of the brain, and secondly, they involve harming the animals. To study structure and function of memory and space in the human brain warrants non-invasive measurement techniques that sample large parts of the brain at the best possible resolution. An ideal method is functional magnetic resonance imaging that with recently developed setups of high-field scanners together with parallel imaging procedures allows whole-brain measurements at sub-millimetre resolution.
Functional magnetic resonance imaging
Functional magnetic resonance imaging (fMRI) is a technique that can measure brain activity by detecting changes related to the flow of blood (Huettel, Song, & McCarthy, 2009). Cerebral blood flow is coupled to the activity of neurons, so that a brain area that increases its activity will show increased blood flow after a short delay of a few seconds (Leithner & Royl, 2014). A major advantage of fMRI is, that it allows studying both brain structure and brain function, while being a non-invasive method that does not require participants to get injections or undergo surgery. Participants are placed in a large magnet with a strong magnetic field (commonly 1.5 or 3 Tesla). Protons in the body of the participants have their own small magnetic field associated with their spin or rotation and in the presence of the external magnetic field this will align parallel or antiparallel with the direction of the external field with almost equal probability. However, a minute fraction of protons ‘prefers’ to be aligned parallel, which creates an overall bias in parallel and antiparallel orientations that results in a measureable magnetisation difference. This effect depends on the strength of the external magnetic field. Before meaningful images can be measured, radio waves are being used to ‘push’ the spin of protons in an orthogonal direction. In the process of returning to their original orientation, they emit a ‘resonance’ signal. The changes in magnetisation along the longitudinal direction (parallel with the main magnetic field) and the transverse orientation can give complementary information and the former is often preferred for structural imaging while the latter is particularly important for the generation of the functional blood-oxygen-level dependent (BOLD) signal that is most commonly used in fMRI studies (Huettel et al., 2009). The BOLD signal has its basis in the different magnetisation properties of hemoglobin in the oxygenated and deoxygenated state (Chou, 2008). Increases in neuronal activity levels of a brain region can lead to a vascular phenomenon called the hemodynamic response, which results in relatively more oxyhemoglobin than deoxyhemoglobin (i.e. oxygenated and deoxygenated hemoglobin, respectively. Chou, 2008). FMRI can indirectly probe neuronal activity due to this coupling between neuronal activity and vascular responses. Magnetic gradients along different
spatial dimensions are being used to localise the signal. Furthermore, to accurately map structure and function at a fine-grained level, it is important to effectively discriminate the signal from nearby locations. However, smaller image elements - the cube-like voxels - sample fewer cells and fewer vessels. This leads to a decrease in sensitivity and signal-to-noise ratio. One way to compensate is to increase the strength of the external magnetic field. In this thesis I used fMRI at 3 Tesla with 2 mm3 voxel resolution, as well as fMRI at
7 Tesla with sub-millimetre resolution to study the fine-grained relationships between structure and function of space and memory in the entorhinal cortex, down to the level of cortical laminar segments. Participants have to be stationary during an fMRI experiment, therefore, in order to investigate spatial navigation and memory I let participants freely navigate virtual-reality environments during fMRI scanning, as described below.
Virtual reality
Investigating spatial navigation behaviour and its processing in the brain on a mechanistic level requires a high degree of control over environmental factors such as landmarks and the geometry of boundaries and it must allow for simultaneous measurements of brain activity. Virtual reality (VR) is therefore a method of choice, since the head of participants can remain still while they use controllers to navigate freely through the virtual environment. In addition, the experimenter has full control over factors, such as the structure and geometry of the environment and how the participants can move through it. One disadvantage is, that vestibular and proprioceptive processing will differ compared to actual navigation, due to the lack of locomotion. However, single-cell recordings in head-fixed rats performing VR navigation on a ball that tracks their movement responses show that place and grid cells can still be identified purely based on the virtual movement paths of the animals (Domnisoru, Kinkhabwala, & Tank, 2013; Harvey, Collman, Dombeck, & Tank, 2009). This suggests that vestibular input is not required to study navigation in the hippocampal formation with VR, and is in line with the view of the hippocampal formation as a multimodal system that can flexibly utilise the available sensory information to guide behaviour.
To address novel questions on the fine-grained differences in function of entorhinal subregions and entorhinal laminar segments during navigation necessitates not only the combination of high-resolution fMRI at 7 Tesla and free navigation in virtual reality, but also novel analysis methods. In search of the human homologues of the rodent MEC and LEC I employed ConGrads (Haak, Jbabdi, & Beckmann, 2014), which allows for tracing the dominant modes of functional connectivity change within a pre-specified region of the brain in a fully data-driven manner. To investigate human grid-cell representations I used a recently developed fMRI proxy measure of grid-cell population activity (Doeller,
1
Barry, & Burgess, 2010). Finally, I implemented this approach in a genetic imaging study to combine fMRI, virtual reality, genetic screening and grid-cell proxy measures for the investigation of the effects of a genetic predisposition for Alzheimer’s disease on spatial processing (Kunz et al., 2015).
THESIS OUTLINE
The amazing ability of animals to effectively navigate their environments, e.g. to take shortcuts, return to a start location without direct vision or to plan efficient routes to a goal location, have been investigated from behavioural (Kelly, McNamara, Bodenheimer, Carr, & Rieser, 2008), biological (Hafting et al., 2005), cognitive (Mittelstaedt, 1962) and engineering (Milford, Wiles, & Wyeth, 2010) perspectives. At the same time, anatomists have been navigating the brain structures of the hippocampal formation that subserve spatial navigation and memory (Witter et al., 2014).
The aim of my doctoral thesis is to study structure-function relationships in the brain, in particular in the hippocampal formation, in relationship to spatial navigation and memory.
Chapter 2 and chapter 4 address the relationship between structure and function from the perspective of the brain, the entorhinal cortex in particular, itself. Chapter 2 describes a study on gradients of functional connectivity along the entorhinal cortex, while chapter 4 focuses on functional differences in the perpendicular direction of laminar segments in the depth of the cortex. In contrast, chapter 3 takes another approach starting with the question how the structure and geometry of the spatial environments that participants navigate through affects the functional processing within the entorhinal cortex. Finally, a complementary view on structure-function relationships was given in a study I contributed to, on the functional effects of genetic predisposition for Alzheimer’s disease (i.e. a disease that affects structural integrity) on entorhinal grid-cell like representations (Kunz et al., 2015).
Chapter 2
The early brain parcellation maps from Brodmann distinguished two subdivisions of the entorhinal area (Brodmann area 28 and 34; Brodmann, 1909). Later on, in rodents two major subdivisions of the entorhinal cortex have been distinguished and it is well understood that the rodent lateral and medial entorhinal cortex (LEC and MEC, respectively) exhibit different structural connectivity patterns and play different functional roles (Eichenbaum & Lipton, 2008; Hafting et al., 2005; Knierim et al., 2014). The EC is also among the first brain areas affected by Alzheimer’s disease. Recent studies localised the area affected by preclinical symptoms in LEC in both humans and mice (Khan et al., 2013), implying homology between those regions. A similar assumption was made in neuroimaging studies on different forms of memory (Reagh & Yassa, 2014; Schultz, Sommer, & Peters, 2012). However, this assumption is controversial and remains hitherto untested, because the characteristic connectivity fingerprints of the rodent MEC and LEC map on the anteroposterior axis in primates, rather than the mediolateral axis (Suzuki & Amaral, 1994).
1
The results of the study described in chapter 2 provide evidence for a functional division along the anteroposterior entorhinal axis, in contrast to findings within the current literature. This study involved three independent fMRI datasets - two acquired at 7 Tesla and another large, publicly available dataset of the Human Connectome Project acquired at 3 Tesla.
Chapter 3
Our ability to self-localise and to map and navigate the world is a fundamental aspect of life and separate studies have focused on behavioural (Kelly et al., 2008), biological (Hafting et al., 2005) or cognitive (Mittelstaedt, 1962) aspects of navigation, but an overarching framework and an understanding of the underlying mechanisms is still lacking (Vickerstaff & Cheung, 2010). Grid cells have been suggested to play an important role in navigation (Burgess, Barry, & O’Keefe, 2007; McNaughton et al., 2006), but their precise function remains poorly understood, despite a large number of studies. Chapter
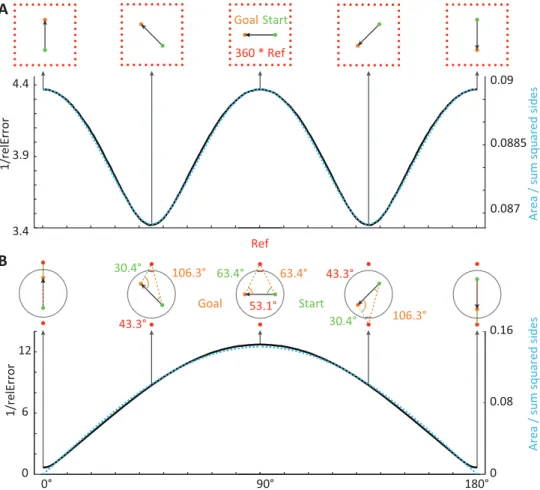
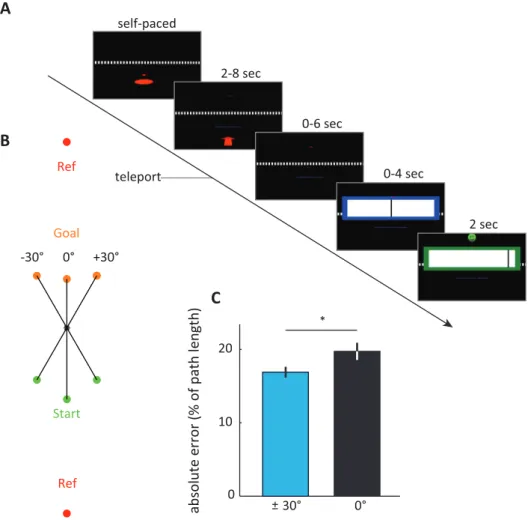
3 addresses the functional role of grid cells using three separate lines of evidence. First,
I employ computational modelling of geometric computations (Euclidean triangulation, in particular) in the presence of noise, or random fluctuations, to simulate how the brain would perform these computations during navigation and how the structure of the spatial environment affects these functions. Second, I describe two fMRI studies with participants freely navigating different virtual environments, that were analysed using a recently developed fMRI proxy measure of grid-cell population activity in the human brain (Doeller et al., 2010). Third, I describe a behavioural study to test the prediction, derived from the results of the computational modelling and the fMRI studies, that human distance estimation is more precise along directions preferred by the entorhinal grid-system. With this combination of computational modelling, virtual reality, fMRI and behavioural testing in humans I sought to test a putative link between the entorhinal grid-cell system and trigonometric computations from Euclidean mathematics, triangulation in particular - the core mapping technique used in cartography since centuries. The results provide converging evidence for a functional role of the grid-cell system in wayfinding and spatial cognition across species that could explain the impact of environmental geometry (Krupic, Bauza, Burton, Barry, & O’Keefe, 2015; T. Stensola, Stensola, Moser, & Moser, 2015) on the grid-system and address debates on models of spatial cognition and the mechanistic basis and functional role of grid cells.
Chapter 4
A hallmark of the organisation of vertebrate brains is the presence of a cortex with a laminated structure (Northcutt, 2002). The functional relevance of this ubiquitous phenomenon is still poorly understood. Single-unit recording studies of the multilayered entorhinal network in freely-moving rodents show that spatially tuned cells, such as grid
cells have a distinct laminar distribution and are most ubiquitous in the middle and upper layer (layer III and layer II). In addition, the connectivity with the hippocampus and the rest of the cortex differs significantly between layers (see Figure 2). The work described in chapter 4 investigated spatial processing in the multilayered entorhinal network in humans by taking advantage of sub-millimetre fMRI at 7 Tesla and virtual reality navigation. With three different approaches I found distinct laminar processing for 1) functional connectivity with visual regions during movement, 2) the distribution of grid-cell representations and 3) correlations with behaviour. This triple dissociation of findings is in line with invasive tracing studies in non-human animals, grid-cell distributions in rats and studies on temporal association memory in mice, respectively.
Chapter 5
Finally, in chapter 5 I summarise the empirical findings of my doctoral studies and discuss them in the context of a perspective of structure-function relationships that may underlie the architectures for spatial memory and behaviour and conclude with an outlook on future directions for studies on structure-function relationships in the brain and cognition.
Functional topography of the
human entorhinal cortex
2
CHAPTER
ABSTRACT
Despite extensive research on the role of the rodent medial and lateral entorhinal cortex (MEC/LEC) in spatial navigation, memory and related disease, their human homologues remain elusive. Here, we combine high-field functional magnetic resonance imaging at 7 T with novel data-driven and model-based analyses to identify corresponding subregions in humans based on the well-known global connectivity fingerprints in rodents and sensitivity to spatial and non-spatial information. We provide evidence for a functional division primarily along the anteroposterior axis. Localising the human homologue of the rodent MEC and LEC has important implications for translating studies on the hippocampo-entorhinal memory system from rodents to humans.
2
INTRODUCTION
The entorhinal cortex (EC) – defining the interface between the hippocampus and the neocortex (Muñoz & Insausti, 2005) - plays a pivotal role in the integration of different sensory inputs into higher order mnemonic representations (Eichenbaum et al., 2007; Moser & Moser, 2013). In rodents - and on the basis of cytoarchitectonics - the EC is typically (Canto et al., 2008; Kerr, Agster, Furtak, & Burwell, 2007; van Strien, Cappaert, & Witter, 2009) subdivided into two major subregions, the medial- and the lateral entorhinal cortex (MEC and LEC, respectively). The MEC receives inputs about spatial information from parahippocampal cortex (PHC) and the LEC receives item-related information from perirhinal cortex (PRC) (Deshmukh & Knierim, 2011; Knierim et al., 2014; Ranganath & Ritchey, 2012; van Strien et al., 2009). Similar functional roles of the PHC and PRC have been described in humans (Davachi, Mitchell, & Wagner, 2003; Duarte, Henson, & Graham, 2011; Eichenbaum et al., 2007; Ekstrom & Bookheimer, 2007; R. Epstein & Kanwisher, 1998; Litman, Awipi, & Davachi, 2009; Martin, McLean, O’Neil, & Köhler, 2013; Staresina, Duncan, & Davachi, 2011; Vilberg & Davachi, 2013) and relate to distinct visual processing streams (Kravitz, Saleem, Baker, & Mishkin, 2011). The differential input pattern into the rodent LEC and MEC also dovetails with a cell-type specific functional specialisation (Eichenbaum & Lipton, 2008). The MEC contains a high proportion of head-direction and grid cells, whose activity is modulated by running direction and spatial location, respectively (Hafting et al., 2005; Sargolini et al., 2006). In contrast, cells in the LEC respond to individual objects in the environment rather than to specific locations (Deshmukh & Knierim, 2011; Knierim et al., 2014; Tsao et al., 2013).
Despite a wealth of data and marked differences in structure and function of the rodent MEC and LEC evidence for their human homologue remains elusive. This hampers translational studies, which is particularly relevant in the case of Alzheimer’s disease (AD) with AD pathology starting in the entorhinal cortex (Braak & Braak, 1992). Within the EC, the vulnerability to AD-related pathology is not homogeneously distributed and differs between medial and lateral strips in humans, which has been related to similar findings in the rodent MEC and LEC, respectively (Khan et al., 2013). However, the localization of the human homologue of the rodent MEC and LEC remains unclear. A source of considerable confusion is the fact that ‘MEC’ and ‘LEC’ are referring to cytoarchitectonically defined areas and not to anatomical locations. Hence, they do not circumscribe strips of medial and lateral entorhinal cortex. Rather, the MEC is located medially in the septal (posterior) part of the EC and the LEC is located laterally in the temporal (anterior) part of the EC in rodents (van Strien et al., 2009). Furthermore, tracing studies on PHC and PRC pathways in non-human primates suggest a dominant septo-temporal division (Insausti & Amaral, 2008; Suzuki & Amaral, 1994), as do single-unit recordings that show activity consistent
with the rodent LEC in the temporal (anterior) EC in primates (Killian, Jutras, & Buffalo, 2012). In contrast, neuroimaging studies on memory in healthy participants (Reagh & Yassa, 2014; Schultz et al., 2012)and participants with preclinical AD (Khan et al., 2013) suggest that the rodent MEC and LEC map on medial and lateral strips of EC in humans.
To resolve this discrepancy in the literature, one needs to investigate the relatively small EC (25 - 30 mm2 in humans; Krimer, Hyde, Herman, & Saunders, 1997) with high anatomical
precision. An earlier study investigated entorhinal connectivity with high-resolution functional magnetic resonance imaging (fMRI), but averaged signal changes over the entire region (Lacy & Stark, 2012). To achieve higher resolution imaging, here we leveraged high-field, sub-millimetre fMRI at 7T and sought to identify the human homologue of the rodent MEC and LEC by informing our analysis by well-known functional and structural properties of the EC. Specifically, it has been shown that MEC and LEC exhibit differential connectivity with cortical regions (Kerr et al., 2007; van Strien et al., 2009; Witter, Groenewegen, Lopes da Silva, & Lohman, 1989). The differential fingerprints of anatomical connectivity should lead to differences in functional connectivity identifiable with fMRI (Buckner, Krienen, & Yeo, 2013; Johansen-Berg et al., 2004; Wang et al., 2014). To test patterns of functional connectivity, we measured whole-brain activity while participants performed a virtual reality task with spatial and non-spatial components and validated the results in publicly available resting-state data from the WU-Minn Human Connectome Project (Smith et al., 2013; Van Essen et al., 2013; HCP - www.humanconnectome.org). In addition, differential sensitivity to spatial and non-spatial stimuli could provide converging evidence to identify the human homologue of the rodent MEC and LEC, which we tested in a third, independent dataset. A complementary approach to the global network perspective presented here is given by Maass et al. (Maass, Berron, Libby, Ranganath, & Düzel, 2015) who scrutinized the fine-grained connectivity pattern of medial temporal regions with the EC.
RESULTS
A recent model on cortical memory networks (Ranganath & Ritchey, 2012) posits that an anterior-temporal (AT) system converges on the PRC and a posterior-medial (PM) system on the PHC. Based on studies in rodents, the two networks are hypothesised to connect to either the LEC or the MEC, respectively (Kerr et al., 2007; van Strien et al., 2009; Witter et al., 1989). Studies in non-human primates predict that the entorhinal projections of the two systems show a strong anteroposterior division (Suzuki & Amaral, 1994). In order to test this prediction and to elucidate the role of the EC, we first applied a model-based approach on fMRI data acquired while participants were performing a virtual-reality navigation task to directly mimic studies in rodents (see Methods for details). This task targeted all entorhinal
2
systems, because it involved both navigation-related spatial components and processing of non-spatial stimuli.
We created spherical regions-of-interest (ROIs) with 4 mm radius around coordinates pertaining to either of the networks (Libby, Ekstrom, Ragland, & Ranganath, 2012; Ranganath & Ritchey, 2012) (see Table 1), as well as ROIs for both the medial and lateral half, and anterior and posterior half of the EC to ensure comparable number of voxels per parcel and therefore comparable signal-to-noise ratio (SNR) properties. Then we computed seed-based connectivity from the two neocortical networks to either sets of EC ROIs, see Figure 1. We found a main effect of network on entorhinal connectivity (repeated-measures ANOVA:, F(1,21)=10.0, p=0.005). Post-hoc t-tests revealed that the LEC connected stronger to the AT compared to the PM network (T(21)=2.6, p=0.015; MEC: T(21)=-0.2 p=0.83). However, in contrast to previous suggestions, we additionally observed a connectivity difference along the anteroposterior axis (repeated-measures ANOVA: main effect of network, F(1,21)=13.2, p=0.001) and post-hoc t-tests showed that the anterior EC connected more with the AT compared to the PM network (T(21)=2.7: p=0.01; posterior EC: T(21)=-0.49, p=0.63).
TABLE 1 | Selection of regions associated with the posterior-medial (PM) and the anterior-temporal (AT) system (Libby et al., 2012).
Left hemisphere Right hemisphere x y z x y z PM System
Medial posterior occipital cortex (BA 18) 14 -72 8 Occipital pole (BA 17) -16 -96 22
Parahippocampal cortex -12 -42 -8 22 -32 -8
Posterior cingulate cortex (BA 29) -4 -46 4 10 -44 10
Posterior hippocampus -20 -30 -2 18 -36 0
Posterior thalamus -20 -34 0 22 -30 6
Retrosplenial cortex (BA 30) -16 -52 -4 22 -46 0
AT System
Dorsolateral prefrontal cortex (BA 9) -24 60 24 18 58 24 Dorsomedial prefrontal cortex (BA 8) -2 -60 34
Frontal polar cortex (BA 10) 40 60 -2
Lateral precentral gyrus (BA 6) 54 4 10
Medial prefrontal cortex (BA 8) -2 60 34
Orbitofrontal cortex (BA 11/47) -6 16 -22 8 22 -20
Postcentral gyrus (BA 4) 62 -10 16
Posterior superior temporal gyrus (BA 22) -62 -34 14
Rostrolateral prefrontal cortex (BA 10) 38 60 -12
Temporal polar cortex (BA 38) 34 22 -36
Ventrolateral prefrontal cortex (BA 44/45) -56 6 18
The coordinates of the PM system reflect peak voxel coordinates of a seedbased connectivity contrast of right parahippocampal cortex > right perirhinal cortex connectivity reported by Libby et al. (Libby et al., 2012). The coordinates of the AT system reflect peak voxel coordinates of a seed-based connectivity contrast of right perirhinal cortex > right parahippocampal cortex connectivity. Coordinates are in MNI space.
2
−0.3 0 0.3 Connecvity Anterior EC Posterior EC 3 -5 T -3 T 7 PM system AT system Lateral EC Medial EC −0.3 0 0.3 A B C D m A CFIGURE 1 | Subdivisions of entorhinal cortex and connectivity to anterior-temporal and posterior-medial cortical networks.
A Schematic of the anterior-temporal (AT) and posterior-medial (PM) system. Spherical ROIs
were centred on MNI coordinates associated with either of the two systems (Libby et al., 2012), normalised to the group-specific template of the navigation study and then masked to include only gray matter voxels. The AT system included medial-prefrontal and orbitofrontal regions, whereas the PM system included occipital and posterior-parietal regions, see Table 1 for all selected regions.
B Right parasagittal slice showing voxel-wise seed-based connectivity of the PM system restricted
to the EC. Note the posterior-medial peak. C Right parasagittal slice showing voxel-wise seed-based connectivity of the AT system restricted to the EC. Note a peak in the anterior-lateral EC. D ROI-based connectivity estimates. Left panel: Connectivity strength (partial correlation coefficient) of anterior (left) and posterior EC (right) is plotted separately for the AT system (red) and the PM system (blue). The systems differ in their entorhinal connectivity: the anterior EC connects stronger to the AT compared to the PM network. Right panel: Connectivity strength with lateral (left) and posterior EC (right) is plotted separately for the AT system (red) and the PM system (blue). Lateral EC connected stronger to the AT compared to the PM network. Error bars show S.E.M. over subjects. See Supplementary Figure 1 for additional slices.
In a second step, we wanted to overcome potential limitations of the seed-based analysis. For example, the selected volume and location of neocortical seed regions could introduce biases (e.g. spatial proximity of the seeds) and imperfect normalisation procedures could affect the results particularly in the frontal lobes where projections from both the rodent LEC and MEC are neighbouring (Kerr et al., 2007). In addition, manual subdivision of the EC along cardinal axes likely misrepresents cytoarchitectonic boundaries. Therefore, we adopted a complementary approach to trace the dominant modes of functional connectivity change within the EC in a fully data-driven manner (Haak et al., 2014) (see Methods). In brief, for every voxel in the EC, we determined its functional connectivity fingerprint with respect to the rest of cortex and used these fingerprints to compute the pair-wise similarities among all voxels within the ROI. The ensuing (voxels-by-voxels) similarity matrix was then fed to the Laplacian Eigenmaps (LE) algorithm (Belkin & Niyogi, 2003), which has previously also been successfully applied to trace changes in white-matter tractography (Cerliani et al., 2012; Johansen-Berg et al., 2004) and resting-state fMRI connectivity (Haak et al., 2014). The LE algorithm projects the high-dimensional, voxel-wise connectivity data onto a series of one-dimensional vectors, with the requirement that the similarities among the connectivity fingerprints are maximally preserved (in the vein of e.g. multidimensional scaling). These vectors represent multiple, spatially overlapping maps (as revealed by colour-coding the EC voxels according to the vectors’ values) and are sorted according to how well they preserve the similarities among the original, high-dimensional connectivity fingerprints. Thus, the first vector represents the dominant mode of connectivity change in the EC, the second represents the second-dominant mode, etcetera.
Applied to the fMRI data acquired while subjects performed the virtual-reality task, we observed that the dominant mode of functional connectivity change extended along the long-axis of the EC, from the septal to the temporal end (i.e. approximately the posterior and anterior end, respectively; Figure 2 and Supplementary Figure 2), while the orientation of the second was largely perpendicular (Figure 3 and Supplementary Figure 6). Both modes of connectivity change could also be reliably detected using an independent resting-state fMRI dataset (60 subjects of the WU-Minn Human Connectome Project; see Methods), suggesting that the organization of EC functional connectivity is largely task-independent (Figure 4). The first and second-dominant modes of functional connectivity change were highly reproducible across resting-state sessions (Pearson’s R = 0.99, p < 0.001 and Pearson’s R = 0.98, p < 0.001, for the dominant and second-dominant modes, respectively).
2
−0.15 0 0.15
Objects > Scenes (beta esmate
) A B Cluster Connecvity change 4 0 T 0 T 2 Cluster A Cluster B A B C D max min
Scenes > Objects Objects > Scenes
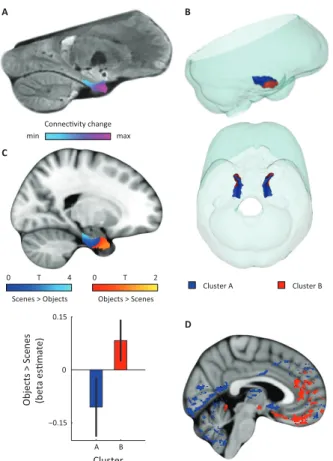
FIGURE 2 | Dominant mode of functional connectivity change within entorhinal cortex and sensitivity to spatial and non-spatial information.
A Dominant mode of functional connectivity change at the group-level (Spearman’s R = 0.53).
Similar colours indicate similar connectivity with the rest of the brain. B 3D rendering of the two clusters derived from the dominant mode of functional connectivity change (displayed in red and blue) and the outlines of the group-specific template. Upper panel: right side view. Lower panel: top view (see Supplementary Figure 2 for coronal views of the two clusters). C Upper panel: Map shows results of a non-parametric randomisation test of the spatial and non-spatial stimulation experiment restricted to the EC for display purposes (see Supplementary Figure 3 for whole-brain maps). The ‘scenes > objects’ contrast is displayed in blue to light-blue, the ‘scenes < objects’ contrast in red to yellow. Note that voxels in septal EC (sEC) are sensitive to scenes, whereas voxels in temporal EC (tEC) are sensitive to objects. Lower panel: The clusters from panel B exhibit antagonistic responses to spatial and non-spatial stimuli. Beta estimates for the contrast ‘scenes > objects’ (averaged across participants) are shown for clusters A and B. T(20) =4.9, p=0.0001. Error
bars show S.E.M. over participants. D Whole-volume functional connectivity with clusters A and B. Regions connecting more with cluster A (p < 0.05, FWE corrected), such as occipital and posterior-parietal cortex that form part of the PM system are shown in blue. Regions connecting more with cluster B (p < 0.05, FWE corrected), such as medial-prefrontal and orbitofrontal cortex which form part of the AT system are displayed in red.
Cluster A Cluster B
C A
A
Objects > Scenes (beta esmate
) −0.15 0 0.15 B B D Connecvity change max min
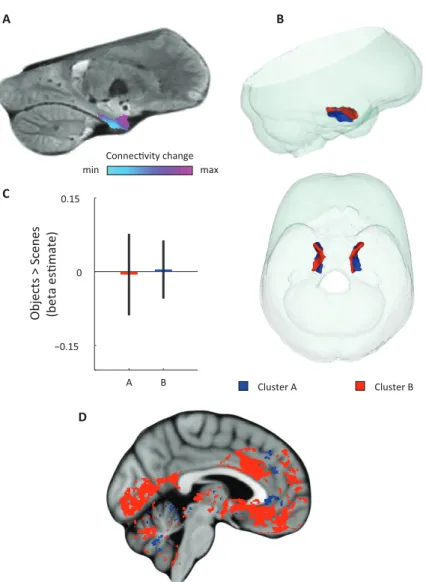
FIGURE 3 | Second-dominant mode of functional connectivity change within EC and sensitivity to spatial and non-spatial information.
A Second-dominant mode of functional connectivity change at the group-level (Spearman’s R =
0.28). Similar colours indicate similar connectivity with the rest of the brain. B 3D rendering of the two clusters derived from the second-dominant mode of functional connectivity change (displayed in red and blue) and the outlines of the group-specific template. Upper panel: right side view. Lower panel: top view (see Supplementary Figure 6 for coronal views of the two clusters). C The clusters shown in panel B exhibit no antagonistic responses to spatial and non-spatial stimuli. Beta estimates for the contrast ‘scenes > objects’ (averaged across participants) are shown for cluster A and B (T(20) = −0.26, p = 0.8). Error bars show S.E.M. over participants. D Regions connecting more with cluster A (p < 0.05, FWE corrected) are shown in blue. Regions connecting more with cluster B (p < 0.05, FWE corrected) are shown in red. Cluster A connected more with most of the neocortex.
2
max min Connecvity changeB
C
D
A
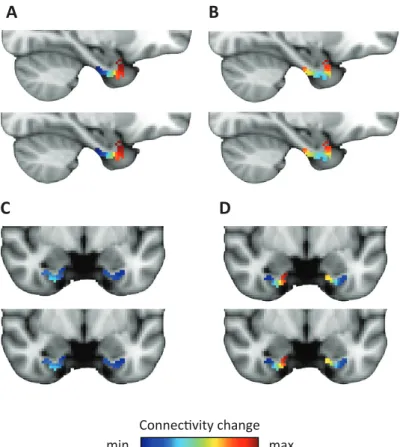
FIGURE 4 | Dominant and second-dominant modes of functional connectivity change on the basis of resting-state functional magnetic resonance imaging.
Results of analysis of the first 60 participants of the WU-Minn Human Connectome Project (HCP), acquired on two different days (Smith et al., 2013). Top row: day one. Bottom row: day two. A, C The dominant mode of functional connectivity change follows an anteroposterior trajectory. B, D The second-dominant mode of functional connectivity change follows a mediolateral trajectory. Both modes were highly reproducible across different scanning days (dominant mode: Pearson’s R = 0.99 p < 0.001, second-dominant mode: R = 0.98; p < 0.001). Topology preservation—dominant mode, day one: Spearman’s R = 0.62; day two: R = 0.61; second-dominant mode, day one: R = 0.44; day two: R = 0.46.
Furthermore, in order to identify the potential human homologues of the rodent LEC and MEC, we clustered the vectors representing the dominant and second-dominant modes of functional connectivity change (separately) through a median-split approach (see Methods). Hence, each cluster comprises 50 % of voxels in the EC. 3D-rendering of the two clusters derived from the dominant mode of connectivity change revealed a consistent topology across hemispheres (Figure 2B, Movie 1). One division contained the posterior
EC (Supplementary Figure 2 - displayed in blue). The other division included most of the anterior EC (Supplementary Figure 2 - displayed in red). In addition to the dominant anterior-posterior distinction, the posterior cluster was located more medially (and to some extent more dorsally) and the anterior cluster was located more laterally (and to some extent more ventrally). Hereafter, we refer to the clusters as posterior-medial EC (‘pmEC’) and anterior-lateral EC (‘alEC’), respectively, consistent with Maass et al. (Maass et al., 2015). Clusters derived from the second-dominant mode were less consistent across hemispheres, but showed an approximately orthogonal orientation relative to the first (Supplementary Figure 6).
If the two clusters (i.e. EC halves) derived from the dominant mode of functional connectivity change correspond to the homologues of the rodent LEC and MEC, their whole-brain connectivity profiles should correspond to the known connectivity profiles in rodents and resemble the AT and PM system proposed by Ranganath and colleagues (Ranganath & Ritchey, 2012). To test this hypothesis, we computed whole-volume connectivity maps of the two clusters. Group-level contrasts showed peaks in the medial-prefrontal and orbitofrontal cortex for the alEC, regions associated with the AT system. In contrast, occipital and posterior-parietal cortex was dominated by connectivity with the pmEC, areas associated with the PM system (Ranganath & Ritchey, 2012). In addition, the pmEC showed increased connectivity with frontal regions (see Figure 2D). These findings are in line with the patterns of reciprocal connections of the rodent LEC and MEC, respectively (Kerr et al., 2007). Notably, this was not the case for the connectivity maps of the two clusters derived from the second-dominant mode of connectivity change (Figure 3D) that were widely dominated by only one of the clusters.
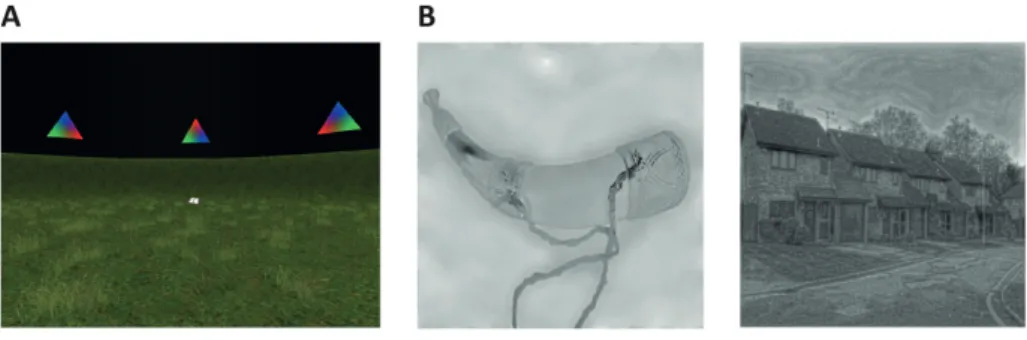
FIGURE 5 | Cognitive tasks.
A Navigation experiment. First person view of the virtual arena that participants navigated freely
to perform the object-location memory task. B Animacy-judgement experiment. Left: An example stimulus of a ‘non-spatial’ object. Right: An example stimulus of a ‘spatial’ scene.
2
Furthermore, we examined both spatial and temporal signal-to-noise ratio (SNR) of the alEC and the pmEC (Supplementary Figure 4). Temporal SNR did not differ between alEC and pmEC (T(21)=0.2, p=0.83) but spatial SNR did (T(21)= 9.7, p<0.001). This was associated with higher signal in the pmEC compared to the alEC (mean signal: alEC=4.97; mean signal pmEC=7.76; T(21)= 38, p<0.001) in the absence of differences in spatial standard deviation (T(21)= 1.5, p=0.144). Note, that mean signal was subtracted from time-series prior to all connectivity analyses (see Methods), which makes it unlikely that signal intensity differences affected the connectivity results.
We used an ICA-based method for data cleaning (see Methods) that has been shown to efficiently remove residual effects of head motion. However, we additionally repeated the data-driven connectivity analysis after excluding time periods with large head movements (motion scrubbing Power, Barnes, Snyder, Schlaggar, & Petersen, 2012; Power, Schlaggar, & Petersen, 2015). Motion scrubbing had only minimal effects on the results. Pearson correlation coefficients of the pre- and post scrubbing results were close to 1 and highly significant (gradient one: left R = 0.9964, right R = 0.9958; gradient two: left = 0.9348, right = 0.8816; all p values < 0.001).
We also tested if the alEC and pmEC exhibited stronger connectivity with their potential homologue region in the contralateral hemisphere compared to each other. Here we observed that homologous connectivity indeed exceeded non-homologous connectivity (Supplementary Figure 5). Importantly, this was also the case if non-homologous connectivity was assessed within the same hemisphere, between adjacent parts of the EC (T(21)= 4.05, p=0.0006).
Finally, studies on rodent electrophysiology (Deshmukh & Knierim, 2011; Knierim et al., 2014) predict that the LEC and its human homologue should respond preferentially to non-spatial stimuli, whereas the MEC and its human homologue should be involved in processing spatial information. We tested this prediction by conducting a second fMRI study at 7T in which an independent group of participants was presented with spatial (pictures of scenes) and non-spatial stimuli (pictures of objects), see Methods for details. We contrasted fMRI responses to spatial and non-spatial stimuli. Here, we observed higher responses to spatial than non-spatial stimuli in the posterior EC, while the inverse contrast (objects versus scenes) showed higher responses in the anterior EC (Figure 2C). ROI analyses using the clusters derived from the dominant mode of connectivity change revealed that the anterior-lateral cluster showed higher sensitivity to non-spatial stimuli compared to the posterior-medial cluster (T(20)=4.9, p=0.0001, Figure 2C). This dissociation was not present for the clusters that were derived from the second-dominant mode of connectivity change within the EC (T(20)=-0.26, p=0.8; Figure 3C).
In sum, our results suggest that the human homologue of the rodent MEC maps predominantly on the human posterior parts of the EC, while the homologue of the rodent LEC maps predominantly on the anterior parts of the EC.
DISCUSSION
The entorhinal cortex, in concert with the hippocampus, plays a crucial role in memory and learning (Eichenbaum et al., 2007) and is the core of the brain’s navigational system (Moser & Moser, 2013). While the shape and location of the EC differs between rodents and primates (Witter et al., 1989), the anatomical organisation and connectivity patterns are largely conserved across species (Canto et al., 2008). However, translational studies on EC subregions faced the problem of identifying homologous regions across species. For example, recent neuroimaging studies on mnemonic processing (Reagh & Yassa, 2014; Schultz et al., 2012) and Alzheimer’s pathology (Khan et al., 2013) directly related medial and lateral strips of EC in humans to the rodent MEC and LEC. However, the anatomical locations of these cytoarchitectonically defined regions in rodents differ along more than only the mediolateral axis. More specifically, the LEC is situated more anterior-ventrally, whereas the MEC is situated more posterior-dorsally in rodents (van Strien et al., 2009). Therefore, it is unlikely that medial and lateral strips of EC in humans correspond to the rodent MEC and LEC, respectively. Furthermore, in primates the characteristic projections from the PRC and PHC strongly map onto the anteroposterior axis (Suzuki & Amaral, 1994).Here, we leveraged the distinct connectivity fingerprints and functional roles (such as complementary computation of scene and object information) of the rodent LEC and MEC to find their human homologues with fMRI with three complementary methods and three independent datasets. Both model-based and data-driven connectivity analyses, as well as sensitivity to non-spatial versus spatial stimuli provide evidence for an anterior-lateral and a posterior-medial localisation of the homologues of the rodent LEC and MEC, respectively. Maass and colleagues confirmed these findings in a study with two high-resolution, high-field fMRI datasets by focusing on local connectivity between regions of the medial temporal lobes. They found preferential connectivity of PRC and proximal subiculum to anterior-lateral parts of the EC, whereas posterior-medial parts of the EC were more connected to PHC and distal subiculum. This corresponds well with our findings (Supplementary Figure 2). In line with the present study, Maass and colleagues (Maass et al., 2015) report local connectivity fingerprints of the human anterior-lateral and posterior-medial EC that mimicked those of the rodent LEC and MEC, respectively.
2
In addition to the change in functional connectivity from posterior-medial to anterior-lateral, our data-driven connectivity analysis also revealed a second organisation structure approximately perpendicular to the first (Supplementary Figure 6), which might reflect bands of intra-entorhinal projections that are known to cross the LEC/MEC boundary in a roughly orthogonal orientation in rodents (Canto et al., 2008) and in primates (Chrobak & Amaral, 2007).
The selective sensitivity to spatial and non-spatial information, or ‘context versus content’ more broadly (Knierim et al., 2014), points towards fundamental difference in computations of the LEC and MEC. How to characterise those differences most accurately remains an open question (Knierim et al., 2014), but our results can help to inform future studies on the role of the human alEC and pmEC in higher-level cognition. Notably, the present findings confirm three out of four complementary criteria for the definition of cortical areas that have traditionally been advocated (Van Essen, 1985), namely topographic organization, connectivity and functional properties (the fourth one being cyto- and myeloarchitectonic organization).
Previous neuroimaging studies in humans reported differences between medial and lateral aspects of entorhinal cortex that mimicked differences between the rodent MEC and LEC and assumed that both subregions are present on coronal slices of the EC (Khan et al., 2013; Reagh & Yassa, 2014; Schultz et al., 2012), i.e. that the MEC and LEC correspond to medial and lateral strips of the EC. In light of our findings, these reports could be explained by a partial overlap of the medial and lateral divisions with the pmEC and the alEC, respectively. For example, we noticed a mediolateral difference of responses to spatial and non-spatial stimuli on some coronal slices (Supplementary Figure 3B). However, our results suggest that coronal slices through the most posterior EC exclusively harbor the human homologue of the rodent MEC. Similarly, anterior slices appear to contain mostly the homologue of the rodent LEC. Hence, improved mapping of homologous regions between rodents and humans should lead to increased effect sizes and more accurate interpretations.
In summary, the present findings can help to inform future translational research on the role of entorhinal subregions in fields ranging from clinical neuroscience, such as on the early progression of Alzheimer’s disease, to cognitive neuroscience, e.g. nature and mechanisms of different forms of memory and their integration into higher order representations (Eichenbaum & Lipton, 2008).
SUPPLEMENTARY FIGURES
3 -5 T -3 T 7 PM system AT system A B m A CSUPPLEMENTARY FIGURE 1 | Results of the model-based connectivity analyses (additional slices).
A Schematic of the anterior-temporal (AT) and posterior-medial (PM) system. B Top row: left
parasagittal slice showing connectivity with the PM network. Bottom rows: coronal slices showing connectivity with the PM network. C Top row: left parasagittal slice showing connectivity with the PM network. Bottom rows: coronal slices showing connectivity with the PM network.
2
A
Cluster A Cluster B
P
SUPPLEMENTARY FIGURE 2 | Coronal views of the two clusters derived from the dominant mode of functional connectivity change.
Top: sagittal slice. Dashed lines indicate position of the coronal slices shown below. Bottom: The posterior slice (left) exclusively contains cluster A. In the middle slice cluster A is located dorsomedially, proximal to the hippocampus and cluster B is located ventrolaterally, distal to the hippocampus. The anterior slice (right) contains mostly cluster B. A = anterior; P = posterior.
6
2 T 2 T 5
A
B
Scenes > Objects Objects > Scenes
SUPPLEMENTARY FIGURE 3 | Whole-brain modulation by spatial and non-spatial stimuli. A Left parasagittal slice showing peak effects of two contrasts on the data from the spatial and
non-spatial stimulation experiment. The ‘scenes > objects’ contrast is displayed in blue-lightblue, the ‘scenes < objects’ contrast in red-yellow. Note that voxels in the posterior EC are sensitive to scenes, whereas voxels in the anterior EC are sensitive to objects. B Coronal slice anterior-posterior location indicated by dashed line in A. Note the medial peak in the medial temporal lobe for the ‘scenes > objects’ contrast and the lateral peak for the ‘scenes < objects’ contrast. Images are thresholded at T > 2 for display purposes.
2
0 2 4 mean spaal SN R alEC pmEC * 0 10 20 30 mean temporal SNR alEC pmEC A BSUPPLEMENTARY FIGURE 4 | Signal-to-noise ratios (SNRs) in the alEC and pmEC.
A Bar plots of the ratio between the mean signal intensity and signal standard deviation across
voxels. The SNR across voxels was higher in the pmEC than the alEC (T(21) = 15.2721, p < 0.001). This was associated with a larger signal in the pmEC (mean signal alEC = 4.97; mean signal pmEC = 7.76; T(21) = 38, p < 0.001) in the absence of differences in spatial standard deviation (T(21) = 1.5, p = 0.144). Note, that mean signal was subtracted from time-series prior to all connectivity analyses (see ‘Materials and methods’), which makes it unlikely that signal intensity differences affected the connectivity results. B Bar plots of the ratio between the mean signal intensity and the signal standard deviation across time. Temporal SNR (tSNR) did not differ between alEC and pmEC (T(21) = 0.2, p = 0.83). Error bars show S.E.M. over participants.
alECl alECr pmECl pmECr pmECl alECr −0.5 0 0.5 1 Connecvity hom non-hom + ipsi non-hom + contra * *
B
A
−0.2 0 0.2 0.4 0.6 0.8 1 ConnecvitySUPPLEMENTARY FIGURE 5 | Homologous and non-homologous connectivity of the alEC and the pmEC.
A Connectivity between subregions identified using the data-driven connectivity analysis.
Connectivity reflects partial Pearson correlation coefficients after Fisher Z transformation. Laterality is indicated by the last letter: left = ‘l’, right = ‘r’. B Connectivity for three conditions. ‘non-hom’ refers to non-homologous connectivity, ‘contra’ refers to contralateral connectivity and ‘hom’ refers to homologous connectivity. Note that homologous connectivity (across hemispheres) exceeded connectivity with the neighbouring non-homologous region in the same hemisphere (T(21) = 4.05, p = 0.0006). Connectivity between non-homologous regions was strongest within hemispheres (T(21) = 3.66, p = 0.0015). Error bars show S.E.M. over participants. *p < 0.05.
2
A
Cluster A Cluster B
P
SUPPLEMENTARY FIGURE 6 | Coronal views of the two clusters derived from the second-dominant mode of functional connectivity change.
Top: sagittal slice. Dashed lines indicate position of the coronal slices shown below. Bottom: All three coronal slices contain both clusters. Cluster A is located ventrally, distal to the hippocampus and cluster B dorsally, proximal to the hippocampus. A = anterior; P = posterior.
MOVIE 1 | Connectopic clusters
(accessible under http://elifesciences.org/content/4/e06738/media-1). 3D rendering of the two clusters derived using the dominant mode of functional connectivity change. Cluster A is shown in red and cluster B in blue.