Stormwater
Infrastructure
Asset Management Plan
Version 0‐1 October 2012Document Control
Document ID: draft 2012 stormwater infrastructure asset management plan.doc
Rev No Date Revision Details Author Reviewer Approver
1 13th of June 2012 Draft (TRIM File: 12/141667) DVB MKG, RJH, JCO ‐ 2 15th of October 2012 Draft Copy for Asset Management Committee Approval (TRIM File: 12/141667) DVB JCO ‐ 2 22nd of October 2012 Final (TRIM File: 12/141667) DVB Asset Management Committee Council
© Copyright 2012 – All rights reserved.
The Institute of Public Works Engineering Australia.
TABLE OF CONTENTS
1. EXECUTIVE SUMMARY ...4
Context ...4
What does it Cost? ...4
What we will do ...4
What we cannot do ...5
Managing the Risks ...5
Confidence Levels...5
The Next Steps ...5
2. INTRODUCTION...7
2.1 Background ...7
2.2 Goals and Objectives of Asset Management...9
2.3 Plan Framework ... 10
2.4 Core and Advanced Asset Management ...12
2.5 Community Consultation ...12
3. LEVELS OF SERVICE ... 12
3.1 Customer Research and Expectations... 12
3.2 Strategic and Corporate Goals ... 12
3.3 Legislative Requirements...13
3.4 Current Levels of Service... 14
3.5 Desired Levels of Service... 20
4. FUTURE DEMAND ... 20
4.1 Demand Drivers... 20
4.2 Demand Forecast... 20
4.3 Demand Impact on Assets ...20
4.4 Demand Management Plan ...25
4.5 Asset Programs to meet Demand ...26
5. LIFECYCLE MANAGEMENT PLAN ... 27
5.1 Background Data ...27
5.2 Infrastructure Risk Management Plan ... 33
5.3 Routine Operations and Maintenance Plan ... 35
5.4 Renewal/Replacement Plan...37
5.5 Creation/Acquisition/Upgrade Plan ... 40
5.6 Disposal Plan ...42
6. FINANCIAL SUMMARY ... 43
6.1 Financial Statements and Projections...43
6.2 Funding Strategy ... 49
6.3 Valuation Forecasts ...50
6.4 Key Assumptions made in Financial Forecasts ...52
6.5 Forecast Reliability and Confidence... 53
7. PLAN IMPROVEMENT AND MONITORING... 55
7.1 Status of Asset Management Practices...55
7.2 Improvement Program ...56
7.3 Monitoring and Review Procedures ... 58
7.4 Performance Measures...59
8. REFERENCES ... 60
9. APPENDICES ... 61
Appendix A Maintenance Response Levels of Service... 62
Appendix B Projected 10 year Capital Renewal and Replacement Works Program...63
Appendix C Projected Upgrade/Exp/New 10 year Capital Works Program...73
Appendix D Budgeted Expenditure in LTFP...77
Appendix D1 CCS Detailed Breakdown of Stormwater Infrastructure LTFP ...78
Appendix E Abbreviations ...79
1.
EXECUTIVE SUMMARY
Context
The City of Charles Sturt embraces some of Adelaide’s
oldest suburban developments with many housing and
business facilities dating back many years. Over time
and under current and previous Council guidance the
area has grown to include many diverse services
utilising a mixture of infrastructure and soft assets. For many years the City has grown both in size and demand
with the coming years being no different in reflecting
the State’s 30 year plan for growth. Asset age and
therefore intervening investment to ensure maintained
condition and service continues to provide Council and
its staff with a complicated challenge. Asset
Management Plans provide an important scene setting
as the City of Charles Sturt continues to balance
investment in both growth and maintenance.
This plan contributes to achieving the appropriate
balance of social, cultural, environmental and economic
services, the keys to sustainability. Whilst assets are
about the physical, at the forefront to this planning is
our community – the current and future users of the
assets.
Stormwater infrastructure provides the community with
infrastructure to transfer stormwater to receiving
bodies such as River Torrens, West Lakes and the Gulf,
to minimise suburban flooding and in some cases to
encourage the capture of stormwater for re‐use.
The Stormwater Infrastructure Service
The stormwater infrastructure network comprises:
Pipes – 369 km
Culverts – 43 km
Rising Mains – 2.7 km
Open Channels (lined) – 5.4 km
Pneumatic Cores – 12.2 km
Drainage Cells – 1 km
Side Entry Pits – 7,910 pits
Junction Boxes – 4,341 pits
Grated Inlet Pits – 1,141 pits
Headwalls – 43 Headwalls
Debris Collectors – 15 collectors
Gross Pollutant Traps and Outlet Structures – 51
traps and outlet structures
These infrastructure assets have an estimated current
replacement value of $304 Million.
What
does
it
Cost?
The projected outlays necessary to provide the services
covered by this Asset Management Plan (AM Plan)
includes operations, maintenance, renewal and upgrade
of existing assets over the 10 year planning period is
$120,685,000 or $12,069,000 on average per year.
Council’s estimated available funding for this period is
$120,685,000 or $12,069,000 on average per year
which is 100% of the cost to provide the service. This is a funding shortfall of $0 on average per year. Projected
expenditure required to provide services in the AM Plan
compared with planned expenditure currently included
in the Long Term Financial Plan are shown in the graph
Above: The purpose of the black Expenditure Year 1 line
is to compare both methods of funding (budgeted and
projected expenditure). Additionally, the line provides
an opportunity to compare year 1 expenditure to the
next 10 years of expenditure.
What
we
will
do
Council plans to provide stormwater infrastructure
services for the following:
Operation, maintenance, renewal and upgrade of
stormwater drain and pits to meet service levels set by Council in annual budgets.
Develop Stormwater Management Plans of critical
catchments to identify flood prone areas and
determine strategy to mitigate the areas.
Commence Water Proofing the West ‐ Stage Two.
This is subject to contributory funding from the
Implement a Stormwater Quality Improvement
Program to improve the quality of stormwater run
off.
Continue to implement the Box Culvert
Replacement Program targeting box culverts in
poor condition and that pose a risk to public safety.
What
we
cannot
do
Council does not have enough funding to provide all
services at the desired service levels or provide new
services. Works and services that cannot be provided
under present funding levels are:
Provision of flood protection to all properties in
significant rain events (greater than 1 in 5 year ARI).
Monitoring of the quality and treatment of all
storm water being discharged to current EPA Water
Quality Standards.
Managing
the
Risks
There are risks associated with providing the service
and not being able to complete all identified activities
and projects. We have identified major risks as:
Failure of box culverts resulting in property
damage, road collapse and potential injury.
Flooding and property damage (public and private)
in moderate rainfall event due to inadequate
capacity of drains.
Insufficient resources (funding, equipment, crews)
to replace/renew asset in accordance to
useful/serviceable life and maintaining existing
controls.
Lack of knowledge of the condition of assets
resulting in poor decision making.
We will endeavour to manage these risks within
available funding by:
Conducting camera inspection of every box culvert,
every 8 to 10 years or on an ‘as needs’ basis. There
has been a Box Culvert Replacement Capital Works
Program since 2003/04. The program is prioritised
in the high risk exposure areas.
Continuing to carry out flood plain mapping to
identify flooding issues. The local knowledge of the
drainage works team enables a proactive approach
to combat issues of flooding and inundation.
Council staff monitors high risk areas in rainfall
events. Additionally, there is an increased level of
service for areas at high risk of flooding and
inundation. There is also provision of sand bags to
private properties on an exception basis.
Completing the Stormwater Management Plan
(SMP) for critical catchments. This will enable
Council to identify appropriate treatment works to
include in the Long Term Financial Plan.
Additionally, improve the collection of condition
data on stormwater assets. The Council can then
quantify the issues, identify resource requirements
and time frames. This will enable the
establishment of acceptable service levels for
stormwater infrastructure.
Improve the process for capturing and analysing
condition data. Hence, this will allow the
prioritisation of the stormwater works program
based on risk
Confidence
Levels
This AM Plan is based on a reliable level of confidence
information. Table 6.5 describes reliable as data based
on sound records, procedures, investigations and
analysis documented properly but has minor
shortcomings. For example some of the data is old,
some documentation is missing and/or reliance is
placed on unconfirmed reports or some extrapolation.
Dataset is complete and estimated to be accurate ±
10%.
As data accuracy is critical to the long term accuracy of
an AM Plan and financial forecasting, Council is
committed to the continuous improvement of asset
registers, asset handover and data collection
procedures.
The
Next
Steps
The actions resulting from this Asset Management Plan
are:
Prioritise and allocate resources for flood
mitigation based on recommendations of
Stormwater Management Plans.
Continue to replace box culverts in poor condition.
Use an integrated approach to infrastructure
construction by allocating resources for Water
Sensitive Urban Design (WSUD) projects and
drainage works associated with road and other
works.
Improve the quality of stormwater being
discharged using Gross Pollutant Traps (GPT) and
WSUD infrastructure.
Questions
you
may
have
What is this plan about?
This Asset Management Plan covers the infrastructure
assets that serve the City of Charles Sturt community’s
stormwater infrastructure requirements. These assets
include pipes, box culverts, drainage cells, rising mains,
open channels, pneumatic cores, side entry pits,
junction boxes, grated inlet pits, pit head walls, debris
collectors, gross pollutant traps, outlet structures,
soakage pits and trash racks throughout the Council
area that protect the public and property from suffering
What is an Asset Management Plan?
Asset management planning is a comprehensive
process to ensure delivery of services from
infrastructure is provided in a financially sustainable
manner.
The Asset Management Plan details information about
infrastructure assets including actions required to
provide an agreed level of service in the most cost
effective manner. The plan defines the services to be
provided, how the services are provided and what funds
are required to provide the services.
What options do we have?
Resolving the funding shortfall involves several steps:
1. Improving asset knowledge so that data accurately
records the asset inventory, how assets are
performing and when assets are not able to provide
the required service levels.
2. Improving our efficiency in operating, maintaining,
renewing and replacing existing assets to optimise
life cycle costs.
3. Identifying and managing risks associated with
providing services from infrastructure.
4. Making trade‐offs between service levels and costs
to ensure that the community receives the best
return from infrastructure.
5. Identifying assets surplus to needs for disposal to
make saving in future operations and maintenance
costs.
6. Consulting with the community to ensure that
stormwater infrastructure services and costs meet
community needs and are affordable.
7. Developing partnership with other bodies, where
available to provide services.
8. Seeking additional funding from governments and
other bodies to better reflect a ‘whole of
government’ funding approach to infrastructure
services.
What happens if we don’t manage a shortfall?
It is likely that Council will have to reduce service levels
in some areas, unless new sources of revenue are
found. For stormwater infrastructure, the service level
reduction may include flooding/inundation of high risk
areas.
What can we do?
Council can develop options, costs and priorities for
future stormwater infrastructure services, consult with
the community to plan future services to match the
community service needs with ability to pay for services
2.
INTRODUCTION
2.1 Background
This Asset Management Plan is to demonstrate responsive management of assets (and services provided from assets),
compliance with regulatory requirements, and to communicate funding needed to provide the required levels of service
over a 20 year planning period.
The Asset Management Plan follows the format for AM Plans recommended in Section 4.2.6 of the International
Infrastructure Management Manual1.
The Asset Management Plan is to be read with Council’s Asset Management Policy, Asset Management Strategy and the
following associated planning documents:
City of Charles Sturt Community Plan 2027 – Shaping the Western Suburbs
City of Charles Sturt – Corporate Plan 2008‐2012
City of Charles Sturt Towards One Planet Living: Greening the Western Suburbs 2008‐2013
City of Charles Sturt Engineering & Open Space Guidelines
City of Charles Sturt Environmental Sustainability Policy
City of Charles Sturt Asset Accounting Policy
City of Charles Sturt Asset Management Policy
City of Charles Sturt Asset Fund Policy
Port Road Stormwater Management Plan
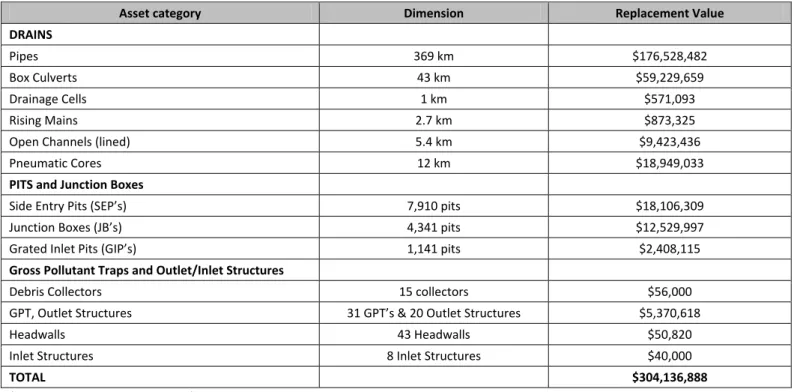
The infrastructure assets covered by this Asset Management Plan are shown in Table 2.1. These assets are used by
Council to provide appropriate stormwater drainage infrastructure services to its community. The figures are effective
from October 1st 2012.
Table 2.1: Assets covered by this Plan
Asset category Dimension Replacement Value
DRAINS Pipes 369 km $176,528,482 Box Culverts 43 km $59,229,659 Drainage Cells 1 km $571,093 Rising Mains 2.7 km $873,325 Open Channels (lined) 5.4 km $9,423,436 Pneumatic Cores 12 km $18,949,033
PITS and Junction Boxes
Side Entry Pits (SEP’s) 7,910 pits $18,106,309
Junction Boxes (JB’s) 4,341 pits $12,529,997
Grated Inlet Pits (GIP’s) 1,141 pits $2,408,115
Gross Pollutant Traps and Outlet/Inlet Structures
Debris Collectors 15 collectors $56,000 GPT, Outlet Structures 31 GPT’s & 20 Outlet Structures $5,370,618 Headwalls 43 Headwalls $50,820 Inlet Structures 8 Inlet Structures $40,000 TOTAL $304,136,888 (Tonkin Consulting 2011, p.16) 1
Assets Excluded in the Plan:
The following stormwater assets are excluded from this plan;
1. Stormwater Pump Stations and associated infrastructure: Stormwater Pump Stations are a critical part of stormwater
infrastructure. Council has undertaken major upgrades to pump stations over the last 7 years. It is anticipated that the
works at Frogmore Road pump station in 2013 and Beach Street pump station in 2014 will be finalised by 2015. The next
version of the Stormwater Infrastructure Asset Management Plan will be consolidated to include the pump stations
excluding any buildings, sheds and outhouses (building assets).
2. Recycled Water Lilac Infrastructure: Recycled water infrastructure is a new type of asset class the City of Charles Sturt
is inheriting from Water Proofing the West, St Clair Woodville and St Clair Cheltenham Developments. These assets are
considered to be a work in progress and are not included in the current asset inventory. However the capital costs
associated with new assets being created as part of Water Proofing the West Project are included in the financial
projections.
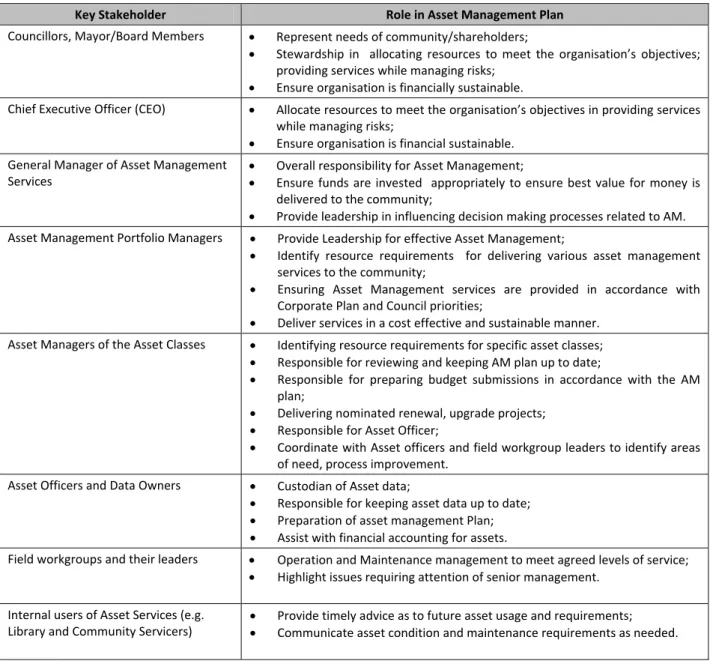
Key stakeholders in the preparation and implementation of this Asset Management Plan are: Shown in Table 2.1.1.
Table 2.1.1: Key Stakeholders in the AM Plan
Key Stakeholder Role in Asset Management Plan
Councillors, Mayor/Board Members Represent needs of community/shareholders;
Stewardship in allocating resources to meet the organisation’s objectives; providing services while managing risks; Ensure organisation is financially sustainable. Chief Executive Officer (CEO) Allocate resources to meet the organisation’s objectives in providing services while managing risks; Ensure organisation is financial sustainable. General Manager of Asset Management Services Overall responsibility for Asset Management;
Ensure funds are invested appropriately to ensure best value for money is delivered to the community;
Provide leadership in influencing decision making processes related to AM. Asset Management Portfolio Managers Provide Leadership for effective Asset Management;
Identify resource requirements for delivering various asset management services to the community;
Ensuring Asset Management services are provided in accordance with Corporate Plan and Council priorities;
Deliver services in a cost effective and sustainable manner. Asset Managers of the Asset Classes Identifying resource requirements for specific asset classes;
Responsible for reviewing and keeping AM plan up to date;
Responsible for preparing budget submissions in accordance with the AM plan; Delivering nominated renewal, upgrade projects; Responsible for Asset Officer; Coordinate with Asset officers and field workgroup leaders to identify areas of need, process improvement. Asset Officers and Data Owners Custodian of Asset data; Responsible for keeping asset data up to date; Preparation of asset management Plan; Assist with financial accounting for assets. Field workgroups and their leaders Operation and Maintenance management to meet agreed levels of service; Highlight issues requiring attention of senior management. Internal users of Asset Services (e.g. Library and Community Servicers) Provide timely advice as to future asset usage and requirements; Communicate asset condition and maintenance requirements as needed.
Key Stakeholder Role in Asset Management Plan The community (residents, businesses, property owners) Be aware of service levels and costs; Participate in consultation processes; Provide feedback on services. State and Federal Government Provide Leadership in promoting Best Practice Asset Management; Facilitate Training and Education Re: Current AM Plan; Recognising the importance of LG Assets to community and provide funding and other assistance to sustain.
Council’s organisational structure for service delivery from infrastructure assets is detailed below,
2.2 Goals and Objectives of Asset Management
The Council exists to provide services to its community. Some of these services are provided by infrastructure assets.
Council has acquired infrastructure assets by ‘purchase’, by contract, construction by Council staff and by donation of
assets constructed by developers and others to meet increased levels of service.
Council’s goal in managing infrastructure assets is to meet the defined level of service (as amended from time to time) in
the most sustainable (including cost effective) manner for present and future consumers. The key elements of
infrastructure asset management are:
Providing a defined level of service and monitoring performance.
Managing the impact of growth through demand management and infrastructure investment.
Taking a lifecycle approach to developing cost‐effective management strategies for the long‐term that meet the
Identifying, assessing and appropriately controlling risks.
Having a long‐term financial plan which identifies required, affordable expenditure and how it will be financed.2
Sustainability ‐ “meeting the needs of the present without compromising the ability of future generation to
meet their own needs.” (World Commission on Environment and Development. (1987). Our Common Future.
The Bruntland Commission, UNESCO).
2.3 Plan Framework
Key elements of the plan are:
Levels of service – specifies the services and levels of service to be provided by Council. Future demand – how this will impact on future service delivery and how this is to be met.
Life cycle management – how Council will manage its existing and future assets to provide defined levels of
service.
Financial summary – what funds are required to provide the defined services.
Asset management practices.
Monitoring – how the plan will be monitored to ensure it is meeting Council’s objectives.
Asset Management Improvement Plan.
A road map for preparing an Asset Management Plan is on the next page.
2
Road Map for preparing an Asset Management Plan Source: IPWEA, 2006, IIMM, Fig 1.5.1, p 1.11. IS THE PLAN AFFORDABLE? CORPORATE PLANNING
Confirm strategic objectives and establish AM policies, strategies & goals.
Define responsibilities & ownership. Decide core or advanced AM Pan. Gain organisation commitment.
REVIEW/COLLATE ASSET INFORMATION Existing information sources
Identify & describe assets. Data collection
Condition assessments Performance monitoring Valuation Data
ESTABLISH LEVELS OF SERVICE Establish strategic linkages Define & adopt statements Establish measures & targets Consultation
LIFECYCLE MANAGEMENT STRATEGIES Develop lifecycle strategies
Describe service delivery strategy Risk management strategies Demand forecasting and management
Optimised decision making (renewals, new works, disposals)
Optimise maintenance strategies
FINANCIAL FORECASTS Lifecycle analysis Financial forecast summary Valuation Depreciation Funding
IMPROVEMENT PLAN Assess current/desired practices Develop improvement plan
ITERATION
Reconsider service statements Options for funding
Consult with Council Consult with Community
DEFINE SCOPE & STRUCTURE OF PLAN IN F O RMA T ION MA NAGEME NT , and DATA IMPROVEM ENT AM PLAN REVIEW AND AUDIT IMPLEMENT IMPROVEMENT STRATEGY ANNUAL PLAN / BUSINESS PLAN IN F O RMA T ION MA NAGEME NT , and DATA IMPROVEM ENT
2.4 Core and Advanced Asset Management
This Asset Management Plan is prepared as a ‘core’ Asset Management Plan over a 20 year planning period in
accordance with the International Infrastructure Management Manual3. It is prepared to meet minimum legislative and
organisational requirements for sustainable service delivery and long term financial planning and reporting. Core asset
management is a ‘top down’ approach where analysis is applied at the ‘system’ or ‘network’ level.
Future revisions of this Asset Management Plan will move towards ‘advanced’ asset management using a ‘bottom up’
approach for gathering asset information for individual assets to support the optimisation of activities and programs to
meet agreed service levels. The City of Charles Sturt is currently planning the implementation of a centralised Asset
Management Information System that will include consolidated asset registers and a works planning system. It is
envisaged that this system will be a pivotal tool in the journey from core to advanced asset management planning.
2.5 Community Consultation
Future revisions of the Asset Management Plan will incorporate community consultation on service levels and costs of
providing the service. This will assist Council and the community in matching the level of service needed by the
community, service risks and consequences with the community’s ability and willingness to pay for the service.
3.
LEVELS
OF
SERVICE
3.1 Customer Research and Expectations
The organisation has not carried out any targeted research on customer expectations with regards to preparing this plan.
This will be investigated for future updates of the Asset Management Plan.
3.2 Strategic and Corporate Goals
This Asset Management Plan is prepared under the direction of Council’s Community, Sustainability and Corporate Plans.
Relevant Council goals and objectives and how these are addressed in this Asset Management Plan are (see next page):
3
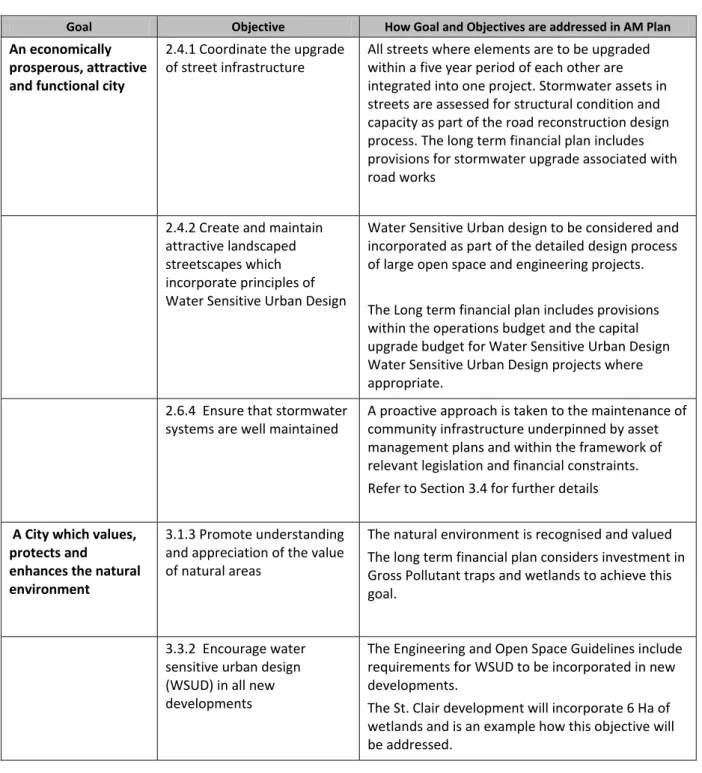
Table 3.2: Council Goals and how these are addressed in this Plan
Goal Objective How Goal and Objectives are addressed in AM Plan
An economically
prosperous, attractive
and functional city
2.4.1 Coordinate the upgrade
of street infrastructure
All streets where elements are to be upgraded
within a five year period of each other are
integrated into one project. Stormwater assets in
streets are assessed for structural condition and
capacity as part of the road reconstruction design
process. The long term financial plan includes
provisions for stormwater upgrade associated with
road works
2.4.2 Create and maintain
attractive landscaped
streetscapes which
incorporate principles of
Water Sensitive Urban Design
Water Sensitive Urban design to be considered and
incorporated as part of the detailed design process
of large open space and engineering projects.
The Long term financial plan includes provisions
within the operations budget and the capital
upgrade budget for Water Sensitive Urban Design
Water Sensitive Urban Design projects where
appropriate.
2.6.4 Ensure that stormwater
systems are well maintained
A proactive approach is taken to the maintenance of
community infrastructure underpinned by asset
management plans and within the framework of
relevant legislation and financial constraints.
Refer to Section 3.4 for further details
A City which values,
protects and
enhances the natural
environment
3.1.3 Promote understanding
and appreciation of the value of natural areas
The natural environment is recognised and valued
The long term financial plan considers investment in
Gross Pollutant traps and wetlands to achieve this
goal.
3.3.2 Encourage water
sensitive urban design
(WSUD) in all new
developments
The Engineering and Open Space Guidelines include
requirements for WSUD to be incorporated in new
developments.
The St. Clair development will incorporate 6 Ha of wetlands and is an example how this objective will
be addressed.
Council will exercise its duty of care to ensure public safety is accordance with the infrastructure risk management plan
prepared in conjunction with this AM Plan. Management of infrastructure risks is covered in Section 5.2.
3.3 Legislative Requirements
Council has to meet many legislative requirements including Australian and State Legislation and State Regulations.
Table 3.3: Legislative Requirements
Legislation Requirement
Local Government Act 1999 Sets out role, purpose, responsibilities and powers of local governments
including the preparation of a long term financial plan supported by asset
management plans for sustainable service delivery. The Act also sets out
the establishment of the Stormwater Management Authority that guides
spending on relevant grant money.
State Records Act 1997 To ensure the City of Charles Sturt records and stores all relevant
information as set out by the State Government of SA.
Environment Protection Act 1993
To ensure that all reasonable and practicable measures are taken to
protect, restore and enhance the quality of the environment having regard
to the principles of ecologically sustainable development.
Occupational Health, Safety and
Welfare Act 1986
To take a constructive role in promoting improvements in occupational
health, safety and welfare practices and assisting in the preservation of public health and safety in all undertakings of Council.
Development Act 1993 An Act to provide for planning and regulate development in the state; to
regulate the use and management of land and building and for other
purposes.
Public And Environmental Health
Act 1987
An Act Dealing With Public And Environmental Health; To Repeal The
Health Act 1935, The Noxious Trades Act 1934 And The Venereal Diseases
Act 1947; And For Other Purposes.
Council will exercise its duty of care to ensure public safety in accordance with the infrastructure risk management plan
linked to this AM Plan. Management of risks is discussed in Section 5.2.
3.4 Current Levels of Service
Council has defined service levels in two terms.
Community Levels of Service measure how the community receives the service and whether the organisation is
providing community value.
Community levels of service measures used in the Asset Management Plan are:
Quality How good is the service?
Function Does it meet users’ needs without compromising the needs of current and future generations?
Capacity/Utilisation Is the service over or under used?
Technical Levels of Service ‐ Supporting the community service levels are operational or technical measures of
performance. These technical measures relate to the allocation of resources to service activities the council undertakes
Technical service measures are linked to annual budgets covering:
Operations – the regular activities to provide services such as opening hours, street sweeping frequency,
mowing frequency, drain cleaning, drain inspection etc.
Maintenance – the activities necessary to retain an asset as near as practicable to an appropriate service
condition (e.g. road patching, footpath repairs, building and structure repairs, pit and drain repair).
Renewal – the activities that return the service capability of an asset up to that which it had originally (e.g.
frequency and cost of road resurfacing and pavement reconstruction, drain replacement and building
component replacement).
Upgrade – the activities to provide an higher level of service (e.g. widening a road, sealing an unsealed road,
replacing a drain with a larger size) or a new service that did not exist previously (e.g. a new library).
Asset managers plan, implement and control technical service levels to influence the customer service levels.4
Council’s current service levels are detailed in Table 3.4 below
4
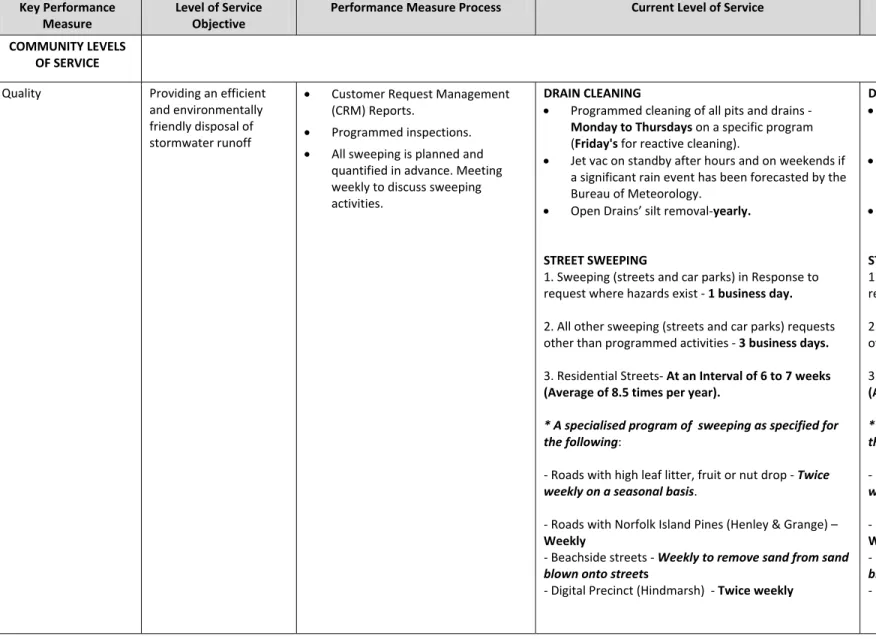
Table 3.4: Current and Desired Service Levels
Key Performance Measure
Level of Service Objective
Performance Measure Process Current Level of Service Desired Level of Service
COMMUNITY LEVELS OF SERVICE
Quality Providing an efficient and environmentally friendly disposal of stormwater runoff
Customer Request Management (CRM) Reports.
Programmed inspections. All sweeping is planned and
quantified in advance. Meeting weekly to discuss sweeping activities.
DRAIN CLEANING
Programmed cleaning of all pits and drains ‐
Monday to Thursdays on a specific program (Friday's for reactive cleaning).
Jet vac on standby after hours and on weekends if a significant rain event has been forecasted by the Bureau of Meteorology.
Open Drains’ silt removal‐yearly.
STREET SWEEPING
1. Sweeping (streets and car parks) in Response to request where hazards exist ‐ 1 business day.
2. All other sweeping (streets and car parks) requests other than programmed activities ‐ 3 business days.
3. Residential Streets‐ At an Interval of 6 to 7 weeks (Average of 8.5 times per year).
* A specialised program of sweeping as specified for
the following:
‐ Roads with high leaf litter, fruit or nut drop ‐ Twice
weekly on a seasonal basis.
‐ Roads with Norfolk Island Pines (Henley & Grange) –
Weekly
‐ Beachside streets ‐ Weekly to remove sand from sand
blown onto streets
‐ Digital Precinct (Hindmarsh) ‐ Twice weekly
DRAIN CLEANING
Programmed cleaning of all pits and drains‐
Monday to Thursdays on a specific program (Friday's for reactive cleaning).
Jet vac on standby after hours and on weekends if a significant rain event has been forecasted by the Bureau of Meteorology.
Open Drains’ silt removal –yearly.
STREET SWEEPING
1. Sweeping (streets and car parks) in response to request where hazards exist ‐ 1 business day.
2. All other sweeping (streets and car parks) requests other than programmed activities ‐ 3 business days.
3. Residential Streets‐ At an Interval of 6 to 7 weeks (Average of 8.5 times per year).
* A specialised program of sweeping as specified for
the following:
‐ Roads with high leaf litter, fruit or nut drop ‐ Twice
weekly on a seasonal basis.
‐ Roads with Norfolk Island Pines (Henley & Grange) –
Weekly
‐ Beachside streets ‐ Weekly to remove sand from sand
blown onto streets
‐ Digital Precinct (Hindmarsh) ‐ Twice weekly
CARPARK SWEEPING
‐ Foreshore Car parks ‐ Weekly ‐ Other car parks ‐ every 6 weeks
‐ A specialised program of sweeping is specified for: Civic Centre, Henley Square & Digital Precinct ‐
Weekly.
‐ Manual Sweeping to compliment mechanical sweeping cycles.
CARPARK SWEEPING
‐Foreshore Car parks ‐ Weekly ‐ Other car parks ‐ every 6 weeks
‐ A specialised program of sweeping is specified for: Civic Centre, Henley Square & Digital Precinct ‐
Weekly.
‐ Manual Sweeping to compliment mechanical sweeping cycles.
Function Providing the community
with safe and effective stormwater
infrastructure network.
The number of Customer Requests (CRM’s) logged.
CRM Analysis Reports Review/update of Stormwater
Infrastructure Asset Management Plans yearly
1. Damaged lids and pits identified in inspections and CRM's.
2. Jet Vac and camera on road carrying out on programmed maintenance schedule with 1 day a week devoted to reactive maintenance.
3. Replacing damaged SEP lids in impact prone areas with heavy duty variants.
1. No potential safety hazards to public as a result of damaged stormwater infrastructure.
2. Jet Vac and camera on road carrying out on programmed maintenance schedule with 1 day a week devoted to reactive maintenance.
3. Proactively identify areas where SEP lids are likely to be or have been damaged frequently and replace with heavy duty variants.
Capacity/Utilisation Ensuring stormwater infrastructure provided can meet the required capacity. This depends on area topography and calculation of Average Rainfall Interval (ARI)
No of CRM’s relating to property/street flooding
1. Consultants undertake analysis of areas to have new stormwater infrastructure and determine the appropriate sizes and quantity/length of pits and drains.
2. Drainage is reviewed in road reconstructions where nil or inadequate drainage was provided. Drainage would be upgraded or installed where it did not exist.
1.Stormwater runoff is contained in the underground system for rain events up to 1 in 5 year ARI (Average recurrence interval) rain event
Stormwater runoff is contained within the road reserve for rain events up to 1:10 year ARI rain event.
2. Drainage is reviewed in road reconstructions where nil or inadequate drainage was provided. Drainage would be upgraded or installed where it did not exist
TECHNICAL LEVELS OF SERVICE Operations & Maintenance 1. Programmed Cleaning Schedule for Jet Vac. Allow one day a week for reactive maintenance. 2. Camera Inspection Van working in collaboration with Jet vac to identify drains to be cleaned. Allow one day a week (Friday) for reactive maintenance.
3. Responding to CRM Requests by the public for damaged SEP lids. 1. No of CRM’s logged.
2. Works Scheduler/Estimator reports on no of camera van inspections out to Council monthly.
3. Works Scheduler/Estimator reports on Engineering Works carried out to Council monthly.
1. 2012 Average (between Jan –May) length of drains cleaned per month is 1684 l/m of drains (120 l/m) per day. This figure includes weekends and staff training days. The total l/m of drains cleaned per day depends on variables such as if the gang experience a lot of tree roots at certain locations where there are a lot of trees.
2. Drain Inspection Van on programmed inspections Mon – Thurs and Friday’s devoted to reactive maintenance.
3. Rapid Response have a response time of 2 working days to make the situation safe and put temporary measures in place (out of the 20 business day turn around time). The remaining working days out of the 20, Engineering & Construction will aim to complete the CRM.
Based on the last four years of data (2008‐2012), approximately 81.3% of CRM's were responded to in the agreed time frame of 20 business days.
1. Target length of drains to be cleaned is between
180l/m to 200l/m per day.
Respond to Stormwater Pit Maintenance 95% of the CRM's in the 20 business day time frame.
2. Drain Inspection Van on programmed inspections Mon – Thurs and Friday’s devoted to reactive maintenance.
3. GPTs and trash racks to be cleaned and maintained such that pollutants reaching the receiving waters is minimised. Cleaning of GPTs to minimise stormwater inundation upstream.
Trash racks in flood risk areas will continue to be emptied after major rain events
4. Empting Trash nets/Racks and GPT’s and maintenance to them to enhance capacity of stormwater network.
4. Works Scheduler/Estimator reports on Engineering Works carried out to Council monthly.
4. High priority GPTs and Trash racks (8 locations in flood risk areas) are emptied after major rain events. Routine inspection of the GPTs is conducted at 8 week intervals, where all GPT’s and Trash Racks are cleaned out.
4. High priority GPTs and Trash racks (8 locations in flood risk areas) are emptied after major rain events. Routine inspection of the GPTs is conducted at 8 week intervals, where all GPT’s and Trash Racks are cleaned out.
Renewal 1. Activities that return the service capability of an asset up to that which it had originally. For example, a renewal or ‘like for like’ replacement of as box culvert in a street.
Currently no performance measures 1. A risk based approach for replacement of assets in poor condition.
Box culvert replacement program since 2004. Box culverts in poor condition are prioritised and replaced to minimise risk of collapse.
A rolling program of road reconstructions is carried out ever year. If there are stormwater drains at a road reconstruction site, they are inspected to determine condition and whether or not they require to be replaced.
1. A condition based renewal program will be optimal.
It is hoped this can be achieved when the entire network has been inspected with the camera and the camera reports are recorded in an analysable format.
The inspections of drainage beneath roads due to be reconstructed will continue to occur. Action will be taken to upgrade/renew drainage, pending the drainage inspection.
Upgrade/New 1. Activities to provide a higher level of service, such as construction of new stormwater infrastructure where there was none before.
Additionally, it may involve removing and disposing a smaller sized Side Entry Pit and installing a larger size to meet the increased demand at the particular location.
Floodplain Modelling & Stormwater Management Plans.
CRM Reports
1. A rolling program of road reconstructions is carried out ever year. The stormwater drains at a road reconstruction site are inspected to determine condition and whether or not they require to be replaced.
Camera van routine inspections crew will forward drains in very poor condition to key staff members to determine course of action to take.
Floodplain Mapping & Stormwater Management Plans (SMP) determine hot spots and provides solutions to problem areas.
1. Providing flood protection to all properties in a 1:100 ARI is the optimal level of service. However this may be economically unrealistic. A more realistic solution will be to complete priority catchments, undertake Stormwater Management plans and undertake works based on a cost benefit analysis.
Camera van crew will continue to forward details of drains in poor condition to council staff to action.
The Floodplain Mapping and Stormwater Management Plans will continue to enhance council’s efforts in identifying problem areas.
3.5 Desired Levels of Service
Indications of desired levels of service are obtained from community consultation/engagement. The asset
management planning process includes the development of 3 scenarios to develop levels of service that are
financially sustainable.
4.
FUTURE
DEMAND
4.1 Demand Drivers
Drivers affecting demand include population change, changes in demographics, seasonal factors, vehicle
ownership rates, consumer preferences and expectations, technological changes, economic factors, agricultural
practices and environmental awareness, etc
4.2 Demand Forecast
The present position and projections for demand drivers that may impact future service delivery and utilisation
of assets were identified and are documented in Table 4.3.
4.3 Demand Impact on Assets
The impact of demand drivers that may affect future service delivery and utilisation of assets are shown in Table
Factors Influencing Demand Present Position Projection Impact on Council Services
Sub‐division expansion
‐ Minimum 300m2 allotments with
reasonable private open space
‐ Minimum 150m2 allotments with little
private open space according to the CCS
Planning Department. This figure is based
on brand new large development such as
St Clair, Brompton & Bowden
‐ Other small residential developments will
still maintain a minimum of 300m2 with
reasonable private open space
‐ Increase in impermeable area
‐ Capacity of existing stormwater system
inadequate to cope with excess runoff ‐ Increased pollutants in receiving
waters
New Residential Developments
(Bowden, Woodville West St Clair &
AAMI Stadium)
‐ Large tracts of open space (except for
Bowden & Woodville West)
‐ Areas will be developed for residential
housing, open space & apartments
‐ Increased impermeable area
‐ Capacity of existing stormwater system
inadequate to cope with increased
runoff
‐ Increased pollutants in receiving
waters
Environmental Awareness ‐ Awareness through education and water
quality improvements as part of capital
projects.
‐ Council will implement Water Sensitive
Urban infrastructure
‐ Managing stormwater to minimize
impacts on coastal and offshore
ecosystems from weeds, sedimentation
and elevated concentrations on nutrients
and contaminants
‐ Improvement in the quality of
stormwater water run off within the
city
Changing rainfall intensities and
frequencies (climate change effects)
‐ Minor stormwater infrastructure
upgrades to protect properties where
possible
‐ Provide sandbags to residents/businesses
for protection
‐ Emptying GPT’s and trash racks before
every major storm event
‐ Increasing number of capital projects
involving renewing and upgrading
stormwater infrastructure pipes, SEP’s
and box culverts
‐ Increasing resources to undertake
stormwater works to meet the
demand and protect private properties
Factors Influencing Demand Present Position Projection Impact on Council Services
Increasing number of larger vehicles
on the road i.e. 4WD’s, buses, road
trains
‐ Repairing damaged stormwater
structures (via CRM or inspections etc). ‐ Undertake Inspections and
renewal/upgrade of Box Culverts within
Council owned areas.
‐ No inspections or renewals/upgrades of
Box Culverts beneath busy DPTI roads
are currently undertaken
‐ Upgrade/replace the SEP lids and other
structures with heavy duty alternatives ‐ Continue to repair/ replace damaged
stormwater infrastructure
‐ Less call outs as a result of installing
heavy duty infrastructure
‐ Will be required to undertake condition
assessment of Box Culverts beneath DPTI
owned roads that pose a high risk to
public safety
‐ Greater likelihood of impacts to SEP’s
and JB’s due to increased vehicles on
the road
‐ Will require funding from Council to
undertake inspections of Box Culverts
in high risk areas including along DPTI
owned roads. Council camera van and
personnel taken away from
programmed maintenance schedule to
carry out work on council owned
drainage in Department for Transport,
Planning & Infrastructure (DPTI) owned
Roads
Water Sensitive Urban Design
(WSUD) initiatives
‐ State government guidelines, currently
discretionally used
‐ Initiatives will be legislated in future
years
‐ Increased expenditure in maintenance
and capital works
Additional maintenance on existing
wet systems
‐ Several wet systems not cleaned or
maintained for several years
‐ Need for arterial drains to be upgraded
to minimize the wet system
‐ Need to develop procedures for regular
maintenance of systems
‐ Need for additional Resources
Increased demand for using open
space for dual purposes (stormwater
retention and recreation)
‐ Current examples of this are in Woodville
West, St Clair, Cooke Reserve, Ray Street
Reserve, Gleneagles Reserve are project
initiatives where stormwater retention
and detention have been used in open
space
‐ Opportunities for stormwater retention
and detention on open space will need to
incorporate creative designs catering for
recreation, sport and stormwater
requirements
‐ The impact on open space services is
currently unknown and will be
evaluated on a case by case basis
Factors Influencing Demand Present Position Projection Impact on Council Services
Increasing community expectations
of higher levels of service‐less
evidence of flooding
‐ Presently under‐resourced
‐ Prioritised Capital Works Program to be
developed
‐ Additional stormwater systems required ‐ Risk of increased cost to Council
Increasing community expectations
availability of services during storms
– e.g. Emergency Services. The
community may expect council to
respond to flooding emergencies
more frequently
‐ Currently the expectation does exist ‐ Funding in Council emergency services
and design will need to be increased to
meet this demand
‐ Funding and design will need to be
increased to meet this demand
Climate change impacting on rainfall
intensities, therefore increasing
probability of residents and local
business suffering personal injury
and/or property damage
‐ Council has a budget for a ‘Floodsafe’
Community Education program in place
in 2012/13
‐ Council currently undertaking a Regional
Climate Change Adaptation Study with
West Torrens & Port Adelaide Enfield
Councils
‐ Council currently developing a Regional
Zone Emergency Management Plan
‐ Effects of climate change potentially
increase rainfall intensities; consequently
increasing probability of residents/local
business suffering frequent personal
injury/property damage funding is
required to educate public on how to
protect themselves and their property ‐ Regional Climate Change Adaptation
Study will identify strategies and actions
to minimise impact of climate change
‐ Additional funding required to fund
‘Floodsafe Community Education
Program
Flooding Hotspots ‐ Council is very aware of these hot spots
from previous major rain events and has
implemented some actions to address
local hotspots where possible and viable
‐ Hot spots in Council area will likely to
increase
‐ Completing floodplain mapping for rest
of catchment areas
‐ Council’s resources will become
stretched and Council’s public image
jeopardised, as a result of responding
increased CRM’s
Factors Influencing Demand Present Position Projection Impact on Council Services
Projected Population Increase in
Council area
‐ Council’s current population is just under
107,000
‐ An increase in residents: ‐ 126,000 residents by 2026 ‐ 150,000 residents by 2036
‐ Council to provide quality services to
growing population
‐ Population growth will increase
number of housing, impervious areas
and subsequent runoff volumes and
demand for additional stormwater
drainage capacity will increase ‐ Council resources will be stretched
Relying less on potable water
supplies (stormwater harvesting)
‐ Undertaking water harvesting initiatives
(Water Proofing the West)
‐ New St Clair development and Woodville
West Rejuvenation provides each
resident/business with recycled water
connection
‐ Bidding for more funding/grants to
create more stormwater harvesting
opportunities around the city
‐ Increased Capital spending by Council
on related projects
‐ Increased income from sale of recycled
stormwater
‐ Increased demand for resources to
maintain harvesting infrastructure
4.4 Demand Management Plan
Demand for new services will be managed through a combination of managing existing assets, upgrading of existing
assets and providing new assets to meet demand and demand management. Demand management practices include
non‐asset solutions, insuring against risks and managing failures.
Non‐asset solutions focus on providing the required service without the need for the Council to own the assets and
management actions including reducing demand for the service, reducing the level of service (allowing some assets to
deteriorate beyond current service levels) or educating customers to accept appropriate asset failures5. Examples of
non‐asset solutions include providing services from existing infrastructure such as aquatic centres and libraries that
may be in another Council area or public toilets provided in commercial premises.
Opportunities identified to date for demand management are shown in Table 4.4. Further opportunities will be
developed in future revisions of this Asset Management Plan.
Table 4.4: Demand Management Plan Summary
Demand Driver Demand Management Plan
Community demand for
flooding mitigation ‐ fundingUndertake required catchment for flood analysis mitigation. and modelling to determine priorities and
‐ The Council’s flood protection standards set out design standards based on
risk.
‐ Stormwater, inlets, outlets, trash racks and Gross Pollutant Traps (GPT’s) are
regularly cleaned, repaired & emptied to ensure flows are not obstructed.
‐ Developers are required to treat and reduce the volume of stormwater
entering the Council drainage system.
‐ Continue to work with private land owners (including Golf courses) to detain
floodwaters and link these initiatives with potential users of the water.
‐ Encourage the use of permeable paving where possible to minimise
stormwater runoff in land development projects, residential buildings and
council projects.
Community demand for
preserving and enhancing
environment through water
harvesting and treatment
‐ Educate and support the community to improve water use practices on their
own properties, including a strong focus on increasing storage and use of
rainwater.
‐ Develop a WSUD guideline to provide further information and guidance to
developers, including those implementing small in‐fill developments.
‐ Increase the total area of vegetated areas managed for their biodiversity
function prior to aquifer injection or discharge into Gulf, St Vincent.
‐ Competitive pricing for supply of recycled stormwater to promote an
alternative water supply.
5
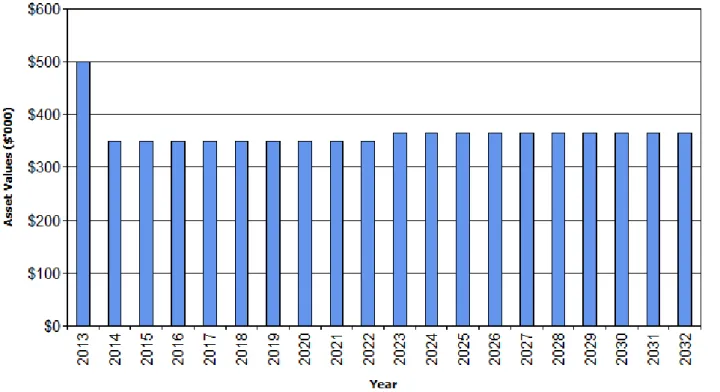
4.5 Asset Programs to meet Demand
The new assets required to meet growth will be acquired free of cost from land developments and /or
constructed/acquired by Council. New assets constructed/acquired by Council are discussed in Section 5.5. The
estimated cumulative value of new contributed and constructed asset values are summarised in Figure 1.
Figure 1: Upgrade and New Assets to meet Demand
Fig 1: Investment in Stormwater Assets is expected to increase from $31.9 million in 2013 to 200 million in 2032. The major
contributors to the increase include $38 Million towards the Water Proofing the West Project Stage 1, which includes the
installation of Lilac Recycled Water Infrastructure in 2013/14. Additionally, investment totalling $27.5 Million has been
allocated to Water Proofing the West Stage 2 between 2013 ‐ 2018 and Stormwater Infrastructure upgrades in the
Trimmer/Meakin Catchment Area between 2015‐2017 where $500K is allocated to undertake the works. At the completion
of the Trimmer/Meakin Catchment, Henley/Fulham Catchments will be constructed between 2021/22 to 2025/26 at a cost of
$22 million over 5 years. From 2026/27 to 2030/32, flooding mitigation works in other catchments will occur at a cost of 25
million over 6 years. Contributed assets are estimated to be at 0.5% of current Asset Value per annum.
The 0.5% growth in contributed was calculated using council’s Geographical Information System (GIS) and using total
number of assets in the new St Clair Development divided by the council’s total stormwater infrastructure inventory. We are
using this figure as a guide for growth of stormwater assets.
Acquiring these new assets will commit Council to fund ongoing operations, maintenance and renewal costs for the
period that the service provided from the assets is required. These future costs are identified and considered in
5.
LIFECYCLE
MANAGEMENT
PLAN
The lifecycle management plan details how Council plans to manage and operate the assets at the agreed levels of
service (defined in Section 3) while optimising life cycle costs.
5.1 Background Data
5.1.1 Physical parameters
The assets covered by this Asset Management Plan are shown in Table 2.1.
Stormwater assets are located throughout the City of Charles Sturt. The assets are situated in areas which are
deemed necessary by Council civil designers and/or consulting engineers. However, during road upgrade works
stormwater assets may be renewed, upgraded or newly installed to cope with increased volume of stormwater runoff
and prevent/reduce the risk of flooding.
The age profile of the assets include in this AM Plan is shown in Figure 2.
Figure 2: Asset Age Profile
Fig.2: A significant number of stormwater pits and drains were constructed between 1966 and 1980 and have a current
age of between 32 and 46 years. Note the West Lakes Development was constructed and handed over in this period.