Thank you for downloading this document from the RMIT Research Repository.
The RMIT Research Repository is an open access database showcasing the research outputs of RMIT University researchers.
RMIT Research Repository: http://researchbank.rmit.edu.au/
Citation:
See this record in the RMIT Research Repository at:
Version:
Copyright Statement: ©
Link to Published Version:
Bai, Y, Wu, S, Retscher, G, Kealy, A, Holden, L, Tomko, M, Borrirak, A, Hu, B, Wu, H and Zhang, K 2014, 'A new method for improving Wi-Fi based indoor positioning accuracy', Journal of Location Based Services, vol. 8, no. 3, pp. 135-147.
https://researchbank.rmit.edu.au/view/rmit:28666
Accepted Manuscript
2014 Taylor & Francis
A New Method for Improving Wi-Fi Based Indoor
Positioning Accuracy
Yuntian Brian Bai1, Suqin Wu1, Guenther Retscher2, Allison Kealy3, Lucas Holden1,
Martin Tomko4, Aekarin Borriak1, Bin Hu1, Hong Ren Wu6, Kefei Zhang1
1 SPACE Centre, Sch. of Mathematical and Geospatial Sciences, RMIT University 2 Dept. of Geodesy and Geoinformation, Vienna University of Technology 3 Dept. of Infrastructure Engineering, University of Melbourne
4 Dept. of Computing and Information Systems, University of Melbourne 6 Sch. of Electrical and Computer Engineering, RMIT University
Abstract. Wi-Fi and smartphone based positioning technologies are play-ing a more and more important role in Location Based Service (LBS) indus-tries due to the rapid development of the smartphone market. However, the low positioning accuracy of these technologies is still an issue for indoor positioning. To address this problem, a new method for improving the in-door positioning accuracy was developed. The new method initially used the Nearest Neighbor (NN) algorithm of the fingerprinting method to iden-tify the initial position estimate of the smartphone user. Then two distance correction values in two roughly perpendicular directions were calculated by the pass loss model based on the two signal strength indicator (RSSI) values observed. The errors from the path loss model were eliminated through differencing two model-derived distances from the same access point. The new method was tested and the results were compared and as-sessed against that of the commercial Ekahau RTLS system and the NN algorithm. The preliminary results showed that the positioning accuracy has been improved consistently after the new method was applied and the root mean square accuracy was improved to 3.4 m from 3.8 m of the NN algorithm.
1. Introduction
With the rapid development of smartphone and Wi-Fi technologies, more and more people are dependent on their phones as the sole source of tele-communication and entertainment. These technologies are also a growing means of connecting with each other instead of using email and other tradi-tional social media. Various sensors, such as global positioning system (GPS) receivers, accelerometers, gyroscopes, digital compasses, cameras, Wi-Fi, and Bluetooth, have been embedded in smartphones for not only communications and entertainment, but also location-based services (LBS). Wi-Fi has become a default feature for all smartphones in recent years. As a result, wireless local area network (WLAN) technology experiences signifi-cant development due to the rapid increasing demand from the smartphone industry. For example, the WLAN world market grew more than 20% in 2012, topping US $4 billion in annual revenue (Machowinski, 2013). Wi-Fi market revenues are forecasted to approach US $12 billion in 2017, a 57% increase over 2012 revenues (Donovan, 2013). Wi-Fi based positioning us-ing smartphones is therefore playus-ing a key role in the commercial market. However, the low positioning accuracy is still an issue for Wi-Fi based posi-tioning due to the signal fluctuation caused by various interferences, how to improve the positioning accuracy of Wi-Fi based systems is the main focus of this research.
2. Typical Indoor Positioning Technologies
A number of typical indoor positioning technologies are overviewed in this section. The advantages and challenges of Wi-Fi and smartphone technolo-gies, and the commonly used measurement and estimation methods are investigated.
1.1 2.1. Why Wi-Fi and Smartphones?
Many positioning technologies or systems can be used for tracking people and asset in an indoor environment. During the past decades, typical indoor positioning technologies such as Wi-Fi, smartphone, Bluetooth, Radio Fre-quency IDentification (RFID), infrared, ultrasonic and inertial navigation system (INS) or inertial measurement unit (IMU) have been investigated by researchers for their potential applications and positioning capabilities. Bluetooth is commonly used for short-range wireless communications and has low power consumption (Zandbergen, 2009). It has become more pop-ular for location tracking after Bluetooth 4.0 was released which has a long-er reading range and a shortlong-er connection time. RFID uses radio waves to transmit a tag identity to its reader so that the carrier of the tag can be
tracked wirelessly (Bai et al., 2012). Infrared is often used for short-range communication between infrared embedded devices; however, infrared cannot penetrate walls, which makes it very difficult to be used between rooms. Ultrasonic can be used to detect objects and measure distances, but the condition of line-of-sight (LoS) is required. INS/IMU is a self-contained navigation technique (Woodman, 2007, Retscher et al., 2012) and usually only provides reliable solutions for a short period of time because its meas-urement errors rapidly enlarge over time and thus it is difficult to separate or mitigate errors from the navigation signals (Hide, 2003).
Compared with these technologies, Wi-Fi has a major advantage of making use of the existing Wi-Fi infrastructure of an enterprise, which leads to cost and time savings. Today, Wi-Fi based real time location system (RTLS) so-lution is one of the two major market shareholders in the global RTLS mar-ket and holds a very promising future (ResearchAndMarmar-kets, 2014).
Smartphones have been used as miniaturised portable computers for years. Various smartphone built-in sensors, which were originally designed for communications and entertainment, have been adopted for LBS. GPS re-ceivers have been well integrated into smartphones and their positioning performance is reliable for outdoor environments. However, it has issues in indoor environments due to the signal attenuation. In this case, Wi-Fi based positioning technology can be an alternative.
Currently, a number of Wi-Fi and smartphone based commercial RTLS sys-tems are available in the market, e.g. Aeroscout, WhereNet, Newbury and Ekahau (Aeroscout, 2013, WhereNet, 2013, Newbury, 2013, Ekahau, 2013). The Ekahau RTLS system can run over existing Wi-Fi infrastructure and uses the fingerprinting algorithm to estimate the location of the peo-ple/object tracked. It has been deployed in many commercial fields and is the only system that has a client software package (Bhaumik, 2010). Thus, Ekahau was tested for comparison with the positioning accuracy of our new method in this research.
1.2 2.2. Main Challenges of Wi-Fi based Indoor Positioning
The main challenge of Wi-Fi and smartphone based positioning is the low positioning accuracy due to the fluctuation of the received signal strength indicator (RSSI) values, which is caused by a range of interferences. Apart from the channel related interferences, the main factors affecting the RSSI values are from the surrounding people and objects, e.g. Wi-Fi signals can be absorbed by water and reflected by metals (Villinger, 2012, Harwood, 2009). A human body, consisting of about 70% water, may in some cases partly or fully block the signals; a metal wall affects the signal propagation more than a wooden wall. The surrounding environmental effect is also the
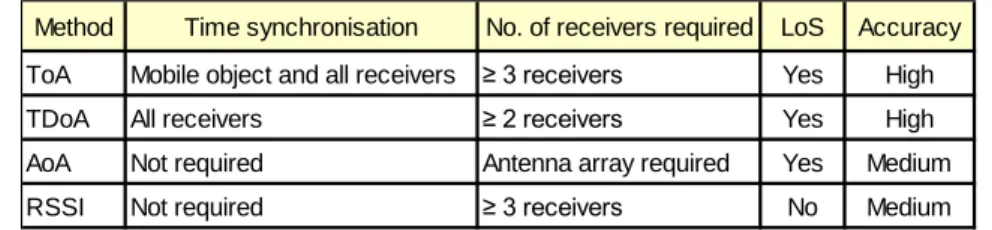
Method Time synchronisation No. of receivers required LoS Accuracy ToA Mobile object and all receivers ≥ 3 receivers Yes High
TDoA All receivers ≥ 2 receivers Yes High
AoA Not required Antenna array required Yes Medium
RSSI Not required ≥ 3 receivers No Medium
most difficult factor to be modeled due to the complexity of the indoor envi-ronment. Another major affecting factor is radio interference from the de-vices nearby, such as microwave ovens, baby monitors or garage door open-ers. Different wireless cards also have different effects on signal strength because different vendors use different hardware (e.g. antennae) and differ-ent methods to measure the radio frequency (RF) energy. In fact, the RSSI values from a wireless access point (AP) may fluctuate all the time. Phones from different manufacturers, the same type of phones but with different versions, and even two phones that are exactly the same model, could all have different RSSI values at a certain time point at the same detecting lo-cation. The fluctuation of the RSSI values could seriously affect the posi-tioning accuracy.
1.3 2.3. Measurements and Estimation Methods
Four types of measurement models are commonly used for indoor position-ing, which are time of arrival (ToA), time difference of arrival (TDoA), angle of arrival (AoA) and RSSI-based models. The RSSI-based model has more popularity than the other three. Their main characteristics are compared in Table 1.
Table 1. Comparison of four measurement models
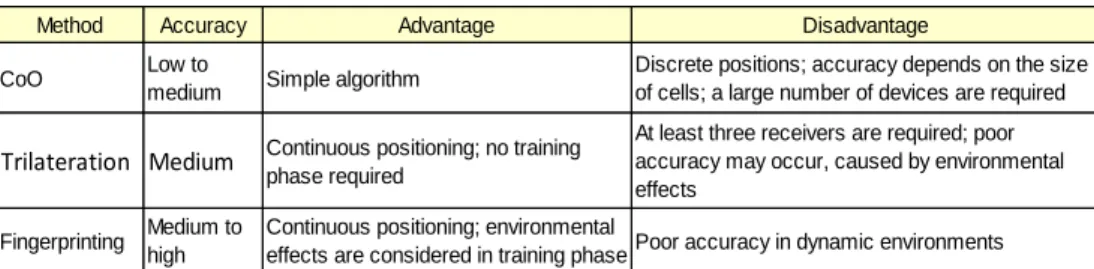
Cell of origin (CoO), trilateration and fingerprinting are the three most commonly used location estimation methods for indoor positioning. Gener-ally, CoO is not used as much as the other two methods due to its lower ac-curacy results. Its acac-curacy depends on the means of implementation. Trilateration usually requires three or more AP connections and the user’s position estimate is derived from multiple distances (i.e. ≥ 3 distances) be-tween the user being tracked and the surrounding APs using the observed RSSI values. The observed RSSI values can be affected by the output power of the transmitter, the sensitivity of the receiver, the antennae gains at both ends of the path, and the path loss of the signal as it travels through the air from the transmitter to the receiver. The distances between the user to the APs can be calculated by the following path loss model (Greg Durgin, 1998, Cisco System, 2008):
Method Accuracy Advantage Disadvantage
CoO Low to
medium Simple algorithm
Discrete positions; accuracy depends on the size of cells; a large number of devices are required
Trilateration Medium Continuous positioning; no training
phase required
At least three receivers are required; poor accuracy may occur, caused by environmental effects
Fingerprinting Medium to high
Continuous positioning; environmental
effects are considered in training phasePoor accuracy in dynamic environments
where
d: distancebetween the transmitter and receiver in meters; RXPWR: transmitter output power in dB;
TXPWR: detected RSSI in dB;
LossTX: sum of all transmitter-side cable and connector losses in dB;
GainTX: transmitter-side antenna gain in dBi;
LossRX: sum of all receiver-side cable and connector losses in dB;
GainRX: receiver-side antenna gain in dBi;
PL1Meter: reference path loss in dB for the desired frequency when the
receiver-to transmitter distance is 1 meter, (Miguel, 2014);
n: path loss exponentfor the environment;
s: standard deviation associated with the degree of shadow fad-ing present in the environment.
However, significant errors may occur during the above distance calculation due to the complexity of the surrounding environment. Therefore, trilatera-tion is more suitable for a large space indoor environment.
The fingerprinting method generally consists of two phases: off-line train-ing phase and localisation phase. The deterministic and probabilistic tech-niques are often used for position estimation in fingerprinting method (Beom-Ju et al., 2010). During the off-line training phase, RSSI values are observed at each of a range of known points, which are also called reference points (RP), from each RP’s surrounding APs. Then these observed datasets are all stored in a database (DB) called fingerprinting DB. While in the lo-calisation phase, a set of user’s RSSI observations from its surrounding APs are observed and compared with the datasets stored in the fingerprinting DB for identification of best matched dataset in the DB. The position of the RP associated with best matched dataset is taken as the location estimate. The comparison of the three methods is displayed in Table 2.
Table 2. Comparison of three most commonly used position estimation methods
3. New Positioning Method
A new Wi-Fi based indoor positioning method was developed in this re-search for improving the positioning accuracy of the fingerprinting
ap-proach based on the nature of the spatial correlation of Wi-Fi signal propa-gation.
1.4 3.1. Idea Development
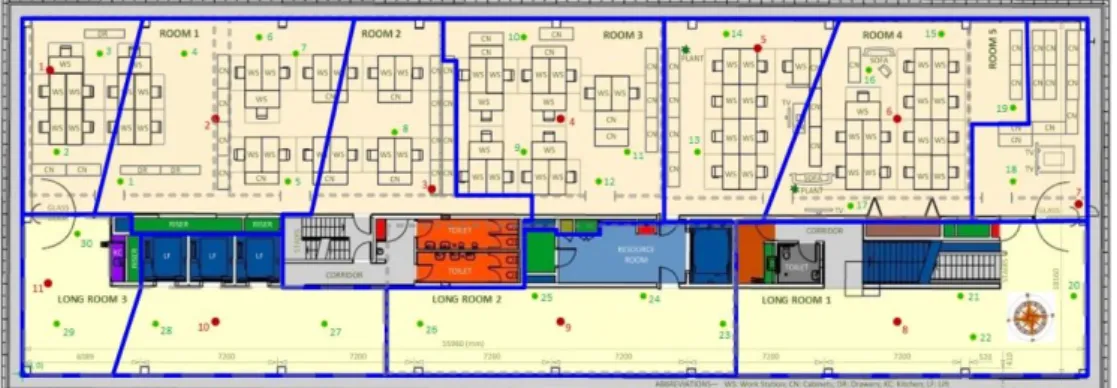
The inspiration idea for the new positioning method was originally from a test result from the single wireless AP-connection location tracking (SWAPLT) test. The test was originally designated to track a user location at a certain time based on a single AP connection. An area of 1000 m2, 11 APs
(red spots), and 30 test points (green spots) were selected for the test (see Figure 1).
Figure 1. Testing environment for the SWAPLT test
Eleven Voronoi Polygons were created first by the ArcMAP software and were then adjusted based on the floor layout and an on-site correction pro-cess. A final unique AP-polygon pair was identified for each AP and all the strongest RSSI values collected within the polygon were considered from its associated AP. These paired relationship data were then stored into a data-base and used for determining which polygon a user was located in at the location tracking stage. The SWAPLT test showed that stronger signals pre-sented more stability and consistency. Therefore, the new method started from identifying a surrounding AP with the strongest RSSI value as the ini-tial AP (named APinit hereafter), which was used for the later calculations of
the new method.
Another characteristic for the new method to be based on is the spatial cor-relation of the Wi-Fi signal propagation, that is, the propotion of the RSSI values observed and their corresponding distances calculated is trustworthy for two points which are close to each other (e.g. < 1.5 m, depending on the RP reslution). It is indicated that the point with a stronger RSSI value observed from an AP is closer to the AP than another point, and vice versa; the two errors in the distances to the AP obtained from the path loss model can be considered as the same.
Other Wi-Fi signal features were also considered during the development of the new method. For example, a weak Wi-Fi signal may present less stabil-ity and reliabilstabil-ity, which should be considered during the positioning pro-cess. Based on the specification of the AP products, signals with the RSSI values greater than -70 dB were presumed for better consistency and posi-tioning operation. Furthermore, an empirical RSSI threshold of -85 dB was adopted for rejection of ineffective RSSI values in the tests for our new method. The -85 dB was also the RSSI threshold adopted in the Ekahau RTLS system.
1.5 3.2. Development of the New Method
In relation to the above principles, the new method started from the Near-est Neighbour (NN) algorithm of the fingerprinting method. In the training phase, at each RP, 5 effective observations including the RSSI value and MAC address from each of selected surrounding APs were collected at a 1-second sampling rate, then the mean of the observed RSSI values ( ̅ ) for each RP was calculated. An example of ̅ at the kth RP can be expressed
as:
̅ ̅̅̅̅̅̅ ̅̅̅̅̅̅
, …, ̅̅̅̅̅̅ (2) The mean of RSSI observations for each RPs were saved to the fingerprint-ing DB. It should be noted that an 8-second data collection period of time was used for 5 effective observations in case that some of the RSSI values were out of the RSSI threshold and more data collection time was needed. During the location detection phase, a RSSI dataset from the smartphone user was observed as Susr = ( , , …, ), then Susr was
compared with the ̅ values stored in the DB using the following equation:
√∑ ̅̅̅̅̅̅
(3) where n is the number of selected surrounding APs at RPk; is the
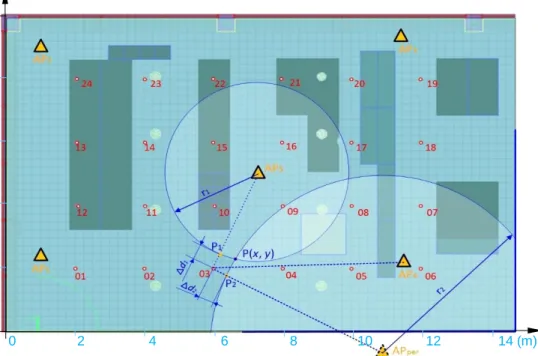
differ-ence between Susr and ̅ . The location of RP with the minimum value, which is also called the best matched RP, was taken as the user’s initial estimate (Pinit) (e.g. RP3 in Figure 2). The AP which had the strongest RSSI
value observed at Pinit was identified as APinit (e.g. AP5 in Figure 2). Let APp
(e.g. AP4 in Figure 2) be the roughly perpendicular AP that satisfies the
fol-lowing conditions: 1) the distance between Pinit and APp < 40 m; 2) 60o≤
APinit-Pinit-APp ≤ 1200 or 240o ≤ APinit-Pinit-APp ≤ 3000; and 3) the RSSI
value received at Pinit from APp ≥ -70 dB. If more than one such AP
candi-dates are available, the AP that has the strongest RSSI value is selected. After the APp is determined, a virtual perpendicular AP (APper) is defined by
APinit-Pinit-APper=2700; 2) | APp-Pinit-APper|≤ 300; and 3) the distance of
Pinit-to-APper =Pinit-to-APp.
The next step was calculating the difference (Δd1) between the distance (̅̅̅)
of Pinit-to-APinit and the distance ( ) of P-to-APinit, and also the difference
(Δd2) between the distance (̅̅̅) of Pinit-to-APper and the distance ( ) of
P-to-APper using Equations 1, and 4 or 5.
̅̅̅ (4)
̅̅̅ (5)
where P(x, y) is the user’s position. Δd1 and Δd2 are called distance
correc-tion value (DCV) in the two typical direccorrec-tions defined as aforemencorrec-tioned and also shown in Figure 2. It is noted that if there is no effective APp
found, then only one correction value (i.e. Δd1) will be applied.
Figure 2. Diagram for the correction in the new method
In the last step, the two corresponding known (true) distances of Pinit
-to-APinit (D1) and Pinit-to-APper (D2) were corrected by adding the DCV values to
obtain the radial parameters r1 and r2using Equations 6 and 7 respectively
(and also see Figure 2, r1is the distance of P1-to-APinit and r2is the distance
of P2-to-APper). Then the two circles with the radii of r1 and r2 expressed by
0 2 4 6 8 10 12 14 (m) 0 2 4 6 8 10 ( m )
Equations 8 and 9 were used to solve for P(x, y) and the intersection point closer to Pinit was regarded as the final estimate of P(x, y).
r1 = D1+ Δd1 (6)
r2 = D2+ Δd2 (7)
r1 = √ (8) r2 = √ (9)
where (xinit, yinit) and (xper, yper) are the coordinates of APinit and APper
re-spectively.
Thefinal result estimation for the method is in fact an error correction pro-cess to the Pinit. The core part of the method is to take fully into account the
difference of the RSSI values and use the observation derived values for the calculation of ̅̅̅ and ̅̅̅, although the true distances D1 and D2 are known.
In this case, the distance errors from the path loss model are eliminated for these two points which are close to each other (e.g. Pinit and P in Figure 2),
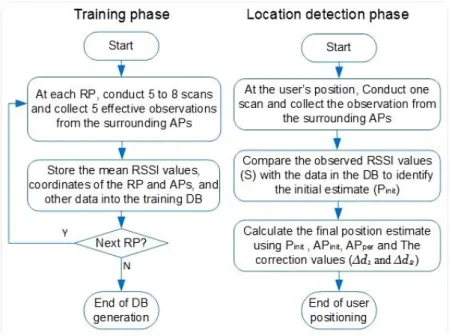
and therefore the DCV can be considered as the true difference based on the difference of the RSSI values observed. The flowchart diagram in Figure 3 describes the overall procedure of the new method.
4. Testing and Result Evaluation
1.6 4.1. Test Environmental Setup
A testing environment was established in the RMIT Indoor Positioning Lab for us to conduct the tests of Ekahau RTLS System, NN algorithm and our new method, as shown in Figure 2. The testing environment was made up like a real world public area such as a shopping mall. Five Linksys WAP54G wireless APs were installed in the area to form a fully controlled WLAN en-vironment. A HP Elite Book 2560P was used as the server machine and a HTC One smartphone as the client-side device. A total of 24 RPs were marked covering most of the testing area at a 2m × 2m grid resolution. These RPs were also used as test points (TP) later on during the location detection phase of the new method.
1.7 4.2. Test of Ekahau RTLS
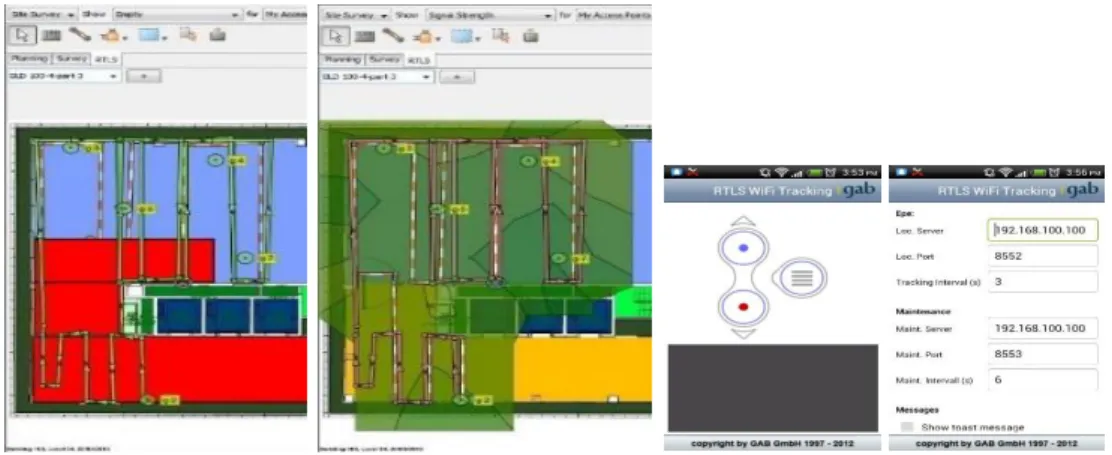
The Ekahau RTLS Controller (ERC) was installed on the HP laptop as a remote server, and the Ekahau Site Survey (ESS) was installed for defining the wireless network plan, conducting a site survey and establishing a fin-gerprinting DB (see Figure 4a). The Ekahau Positioning Client (EPC) virtu-al software was instvirtu-alled on the smartphone as a virtuvirtu-al tag, Figure 4b shows the EPC’s operation and configuration interface.
Figure 4. (a) The walking path for training data collection in the test area; (b) The opera-tion (left) and configuraopera-tion (right) interface of the EPC
During the user position detection phase, the smartphone was placed at each of the 24 TPs, their real time position estimates were displayed on the Ekahau Vision Client Monitor interface. With the assistance of the Ekahau Software Developer's Kit, a java-based application program was developed
RPs in DB AP1 AP2 AP3 AP4 AP5 δ (dB) 02 -41 -53 -73 -44 -43 10.2 03 -45 -53 -69 -42 -41 4.1 04 -48 -55 -68 -43 -40 4.6 08 -55 -57 -55 -40 -42 15.6 17 -67 -58 -43 -49 -43 33.3 22 -65 -47 -47 -54 -45 31.3 ⁞ ⁞ ⁞ ⁞ ⁞ ⁞ Detected at P -47 -52 -67 -40 -39 RP3
The minimum δ is 4.1 dB, RP3 therefore was selected as the initial position Pinit
True distance D (m) Estimated distance (m) Estimated distance d (m) Δd = d - (m) r = D + Δd Final P(x, y) D1 = 3.15 = 1.50 d1 = 1.25 Δd1 = -0.25 r1 = 2.90 D2 = 5.68 = 1.64 d2 = 1.37 Δd2 = -0.28 r2 = 5.40
nearer intersection point of the circles (r1 & r2)
̅ ̅
to record the location estimates from all the TPs. The RMS positioning ac-curacy obtained from the Ekahau RTLS is 3.9 m.
1.8 4.3. Test of the New Method
The same testing environment as for Ekahau was used for this test. The test included two main stages:
1. Fingerprinting DB generation and initial position estimation
At each RP, the observations values from the surrounding 5 APs were col-lected. Probing behavior of the test client should be as close as possible to that of the clients to be tracked. The mean of the 5 effective RSSI observa-tions for each RP were saved to the fingerprinting DB.
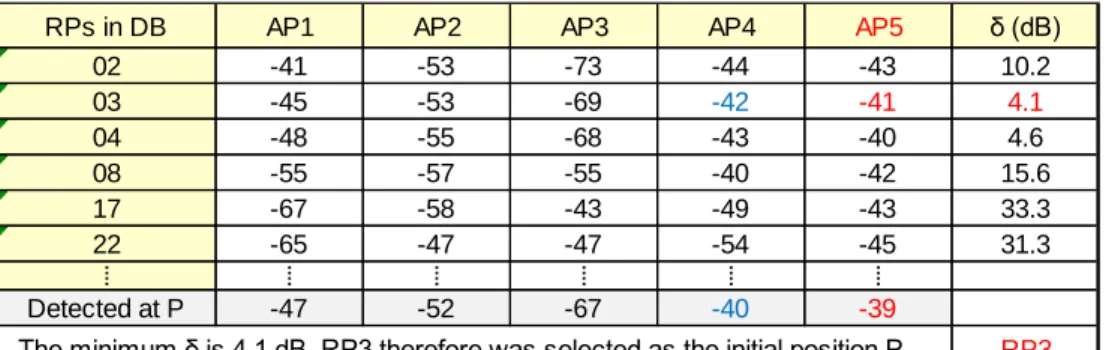
During the user detection phase, a smartphone was placed at a TP (the true position of which was known), and the RSSI values from all the 5 APs were received as S (-47, -52, -67, -40, -39). Then S was compared with those
̅ stored in the DB using Equation 2, and RP3, AP5 and AP4 were
deter-mined as Pinit, APinit and APp respectively (see Table 3 for an example).
Fi-naly APper was defined accordingly.
Table 3. Part of the data used for comparison and Pinit determination
2. Corrections to the initial estimate
Table 4 showed the calculation and result including intermediate values for the correction to Pinit.
Table 4. Positioning determination result
The statistical RMS accurcy ( ) of all the TPs was 3.4 metres, which was calculated by:
√ ∑ ] (10) where m is the total number of TPs tested, (xk, yk) and (xek, yek) are the true
and estimated coordinates at TPk respectively.
1.9 4.4. Results Evaluation
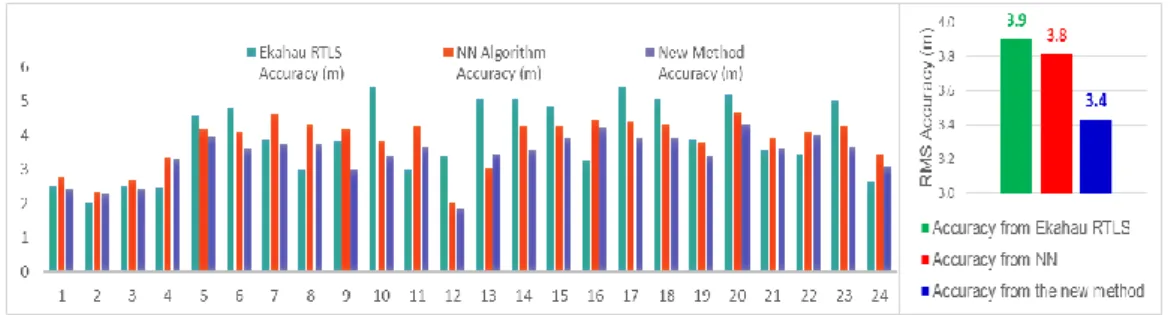
The commercial Ekahau RTLS, the NN algorithm and the new method were tested in the same testing environment. Figure 5 shows the comparison of their test results in terms of positioning accuracy of the same 24 TPs.
The RMS accuracy of the 24 TPs for the three scenarios are 3.9 m, 3.8 m and 3.4 m respectively, i.e., after the new method was employed, the posi-tioning accuracy was improved to 3.4 m from 3.8 m of the NN algorithm.
Figure 5. Comparison of accuracy results from Ekahau RTLS, NN algorithm and the new method
The accuracy of 3.9 m of the Ekahau RTLS result is within the range of 3—5 m as claimed in its product manual. The accuracy of 3.8 m of NN is slightly better, however, it cannot be drawn by this minor difference that NN is better than Ekahau RTLS in general. However, the new positioning method has shown a noticeable and consistent improvement compared with the other two approaches.
5. Conclusion and Future Work
This paper presents a new indoor positioning method based on Wi-Fi and smartphone technologies and the fingerprinting estimation method. The test results have shown that the new method effectively and consistently improved positioning accuracy at a level of nearly half a metre. Moreover, the new method also have advantages such as flexibility and expendability for further development, as well as ease to be integrated with other positioning systems.
Future work will include performance assessment for various grid resolu-tions of RPs, and investigation of the variation of RSSI observaresolu-tions from a particular AP at different time.
6. Acknowledgements
This work was supported in part by the Australian Research Council (LP120200413)
References
AEROSCOUT. 2013. AeroScout's enterprise visibility solutions [Online]. Available:
www.aeroscout.com 20th Jan 2013].
BAI, Y. B., WU, S., WU, H. & ZHANG, K. 2012. Overview of RFID-Based Indoor Positioning Technology. Geospatial Science, RMIT 2012. Melbourne: RMIT University. BEOM-JU, S., KWANG-WON, L., SUN-HO, C., JOO-YEON, K., WOO JIN, L. & HYUNG
SEOK, K. 2010. Indoor WiFi positioning system for Android-based smartphone.
Information and Communication Technology Convergence (ICTC), 2010 International Conference on.
BHAUMIK, R. 2010. Evaluating Wi-Fi Location Estimation Technique for Indoor Navigation.
CISCO SYSTEM, I. 2008. Wi-Fi Location-Based Services 4.1 Design Guide.
DONOVAN, F. 2013. Wi-Fi market revenues to reach $12 billion in 2017 [Online]. FierceMobileIT. Available: http://www.fiercemobileit.com/story/wi-fi-market-revenues-reach-12-billion-2017-says-delloro/2013-07-26 [Accessed 1 April 2014]. EKAHAU. 2013. Available: http://www.ekahau.com/ [Accessed 20th Jan 2013].
GREG DURGIN, T. S. R., HAO XU 1998. Measurements and Models for Radio Path Loss and Penetration Loss In and Around Homes and Trees at 5.85 GHz. IEEE
TRANSACTIONS ON COMMUNICATIONS, 46, 1484-1496.
HARWOOD, M. 2009. Factors Affecting Wireless Signals. In: KANOUSE, P. (ed.)
CompTIA® Network+ Exam Cram. 3rd Edition ed.: Paul Boger.
HIDE, C. 2003. Integration of GPS and Low Cost INS measurements. the degree of Doctor of Philosophy, University of Nottingham.
MACHOWINSKI, M. 2013. New high of $4 billion for wireless LAN market in 2012
[Online]. Infonetics Research. Available:
http://www.infonetics.com/pr/2013/4Q12-Wireless-LAN-Market-Highlights.asp
[Accessed 20 April 2013].
MIGUEL. 2014. Path Loss in free space [Online]. Available:
http://www.qsl.net/pa2ohh/jsffield.htm [Accessed 9 May 2014].
NEWBURY. 2013. Newbury’s enterprise-class location solutions [Online]. Available: WLANs at www.newburynetworks.com [Accessed 20th Jan 2013].
RESEARCHANDMARKETS. 2014. Real-Time Location Systems (RTLS) Market by Product,
Technology, Application, Industry Vertical & Geography 2013 - 2020 [Online].
Research and Markets. Available:
http://www.researchandmarkets.com/publication/mbga76c/realtime_location_sy
stems_rtls_market_by_p [Accessed 23 April 2014.
RETSCHER, G., ZHANG, K. & ZHU, M. 2012. RFID Positioning. In: CHEN, R. (ed.)
Ubiquitous Positioning and Mobile Location-Based Services in Smart Phones. 1st.
VILLINGER, S. 2012. 10 reasons your Wi-Fi speed stinks (and what you can do about it)
[Online]. Available: http://www.itworld.com/networking/276200/10-reasons-your-wi-fi-speed-stinks-and-what-you-can-do-about-it [Accessed 30 May 2014].
WHERENET. 2013. Tracks What the Army Assembles [Online]. Available:
www.sydneywireless.com [Accessed 20th Jan 2013].
WOODMAN, O. J. 2007. An introduction to inertial navigation. University of Cambridge. ZANDBERGEN, P. A. 2009. Accuracy of iPhone Locations: A Comparison of Assisted GPS,