Masters Research Report
Exploring grade 10 learners’ errors and
misconceptions involved in solving probability
problems using different representations
LYDIA MUTARA
Student No: 579347
March, 2015
Protocol No: 2014ECE040M
A research project submitted to the Faculty of Science, University of the Witwatersrand, Johannesburg, in partial fulfilment of the requirements for the degree of Masters in Science Education
i
The Curriculum Assessment Policy Statements (CAPS) re-introduced some mathematics topics such as probability. An immediate effect of this re-introduction is that most teachers and learners were not well equipped to deal with this topic. To at least begin addressing this problem, this research explored the errors and misconceptions that learners have when solving probability problems using different representations. The study draws from Nesher’s (1987) theory of errors and misconceptions as well as Sfard’s (2007) theory of commognition in explaining representations and prevalence of errors in learning mathematics. Twenty two Grade 10 learners wrote probability tasks after which their scripts were analysed for errors. Six of those learners were interviewed on the errors they made in solving probability problems with different representations. The findings reveal five main categories of errors and misconceptions. These are: (1) difficulty with construction of visual representations; (2) improper distinction between simple and compound events; (3) application of inappropriate routines; (4) errors associated with familiarity; and, (5) misinterpreted language. The findings also showed that inappropriate choice of representations was caused by misinterpretation of probability terminology. Concurring with Zahner and Corter (2010) the researcher found that learners made a multitude of errors if they constructed and used their own probability representations. Further, learners committed fewer errors where the task provided representations. Results also show that learners were most confident in using tree diagram representations even though they struggled to construct them from scratch. Most learners avoided Venn diagrams, outcome listings and matrix representations even though they would be the most useful in answering the questions. As a result many errors and misconceptions resulted when learners tried to use these representations. The study recommends that teachers take time to discuss probability terminology and the use of different representations with their learners. This promotes both the conceptual and procedural knowledge of probability. Also, to reduce learners’ errors and misconceptions on the topic, teachers need to scaffold the construction of representations by providing partially constructed representations and gradually encourage learners to construct their own probability representations.
ii
Acknowledgements
I am indebted to my supervisor, Dr Judah. P. Makonye, for his helpful criticisms and suggestions during the study. To the twenty two learners who participated in the study at JBC secondary (not its real name) school, thank you very much for your cooperation. You went to great lengths to accommodate me. Selo Modise, thank you for proof reading my research report. The principal of JBC, your permission to carry out the study in the school made my research a reality.
To my husband and children, thank you for your understanding when I denied you attention. Special thanks go to my parents, Nisbert and Josephine, for always supporting and providing me with wisdom that I desperately needed from time to time. Nisbert Chinaka, my father, you are a great inspiration in my life.
iii
Declaration
I declare that this project is my own work and no part of it has been copied from another source (unless indicated as quote). All phrases, sentences and paragraphs taken directly from other work have been cited and the reference recorded in full in the reference list. The project is being submitted for the Degree of Masters in Science Education with the University of the Witwatersrand, Johannesburg. It has not been submitted before for any degree or examination in any other university.
Signature: ---
iv
TABLE OF CONTENTS
Abstract ……….i
Acknowledgements ... ii
Declaration ... iii
List of Abbreviations ... vii
List of Figures ... viii
List of Tables ... ix
List of Excerpts ... x
List of Vignettes ... xi
CHAPTER 1: An overview of the study ... 1
1.1 Introduction ... 1
1.2 Contextual background of the study ... 1
1.3 Probability as a school mathematics topic ... 2
1.4 What are learners’ errors and misconceptions? ... 4
1.5 The problem statement ... 4
1.6 Aims of the study ... 6
1.8 Rationale and significance ... 7
1.9 Definition of terms used in the study ... 8
1.10 Conclusion ... 9
CHAPTER 2: Theoretical framework and literature review ... 10
2.1 Introduction ... 10
2.2 Theoretical Framework ... 10
2.2.1 Nesher’s (1987) theory of errors and misconceptions ... 10
2.2.2 Discourse and the prevalence of errors (Sfard, 2007) ... 12
2.3 Conceptual framework ... 13
2.3.1 Errors of visual mediators ... 13
2.3.2 Errors of Signifiers ... 14
2.3.3 Errors of Routines ... 14
2.4 Literature Review ... 16
2.4.1 Errors and misconceptions in mathematics education ... 16
2.4.2 Types of learner errors ... 17
2.4.3 Donaldson’s (1963) classification of errors ... 17
2.4.4 Reasons for errors (Radatz, 1979) ... 19
v
2.4.6 Visual representations and problem solving ... 21
2.4.7 Types of external visual representations ... 23
2.5 Conclusion ... 23
CHAPTER 3: Research Methodology ... 24
3.1 Introduction ... 24
3.2 Research design ... 24
3.3 The empirical field ... 25
3.4 Sampling ... 26
3.5 Data collection methods ... 26
3.6 Why a Task Instrument? ... 27
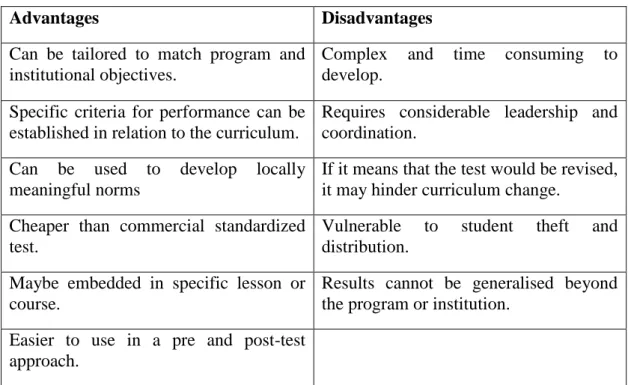
3.7 Advantages and disadvantages of locally developed and curriculum based tasks ... 28
3.8 The Tasks Instrument ... 28
3.9 Semi-structured interviews ... 30
3.10 Validity and Reliability ... 30
3.11 Ethical considerations ... 31
3.13 The Pilot Study ... 31
3.13 Conclusion ... 32
CHAPTER 4: Data analysis ... 33
4.1 Introduction ... 33
4.2 Categories used for data analysis ... 34
4.3 Analysis of the written probability tasks ... 35
4.3.1 Summary of learner performance in the probability tasks ... 35
4.4 Analysis of responses to tasks on Section A ... 37
4.4.1 Item 1 ... 37
4.4.2 Item 2 ... 38
4.4.3 Item 3 ... 39
4.5 Analysis of responses to tasks on Section B ... 40
4.5.1 Item 4 ... 40
4.5.2 Item 5 ... 45
4.5.3 Item 6 ... 50
4.6 Analysis of responses to tasks on Section C ... 53
4.6.1 Item 7 ... 53
4.6.2 Item 8 ... 56
vi
4.7 Discussions ... 62
4.7.1 Types and nature of common errors found in learners’ work ... 63
4.7.2 Emerging patterns ... 66
4.8 Conclusion ... 67
CHAPTER 5: Findings, conclusions and recommendations ... 68
5.1 Findings and conclusions ... 68
5.1.1 The nature of learners’ common errors and misconceptions in this study ... 68
5.2 Limitations of the study ... 70
5.3 Reflections ... 70
5.4 Recommendations ... 70
REFERENCES ... 72
Appendix 1: Probability Tasks ... 79
Appendix 2: Semi Structured interview Protocol ... 86
Appendix 3: GDE Research clearance ... 87
Appendix 4: Information sheet and consent forms ... 89
Permission from the School Principal to carry out research ... 91
Information sheet to the Parents... 92
Information sheet to the Learners ... 94
Parents’ Informed Consent Form for written task ... 96
Parent audio recording consent form ... 98
Learners’ Informed Consent Form for written task ... 99
Learners’ Informed Consent Form for interview ... 100
Learner audio recording consent form ... 101
vii
List of Abbreviations
CAPS ………..Curriculum Assessments Policy Statements DBE……….. Department of Basic Education
FET………Further Education and Training GDE………...Gauteng Department of Education
JBC………... Pseudonym for the school where data was collected for the current study
PCK………...Pedagogical Content Knowledge
TSPCK………..Topic Specific Pedagogical Content Knowledge TIMSS……….. Trends in Mathematics and Science Study RNCS……… Revised National Curriculum Statement
viii
Figure 2.1: The process of error and misconception detection ... 11
Figure 2.2: Classification of learner errors according to Brodie and Berger (2010)... 15
Figure 2.3: Lesh, Landau & Hamilton’s (1983) model of the five types of distinct types of representation system (Adapted from Suh and Moyer, 2007) ... 21
Figure 2.4: The four stages of probability problem solving (Adapted from Zahner & Corter, 2010) .. 22
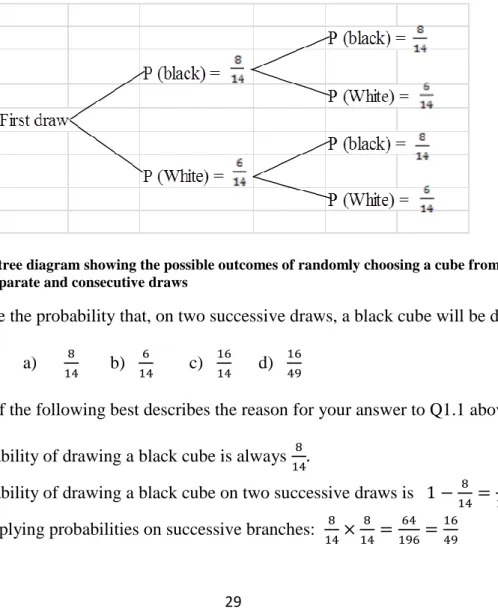
Figure 3.1: The tree diagram showing the possible outcomes of randomly choosing a cube from the box on two separate and consecutive draws ... 29
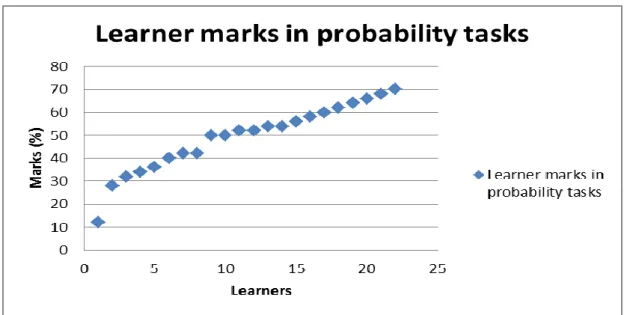
Figure 4.1: Scatter plot showing individual learners’ marks in the probability tasks. ... 36
Figure 4.2: Box and whisker plot of the learners marks in the probability tasks ... 36
Figure 4.3: A least squares line fitted on a scatter plot of the learners’ marks. ... 36
Figure 4.4: Prisca’s tree diagram ... 41
Figure 4.5. The tree diagram showing the possible outcomes of randomly choosing a cube from the box on two separate and consecutive draws ... 51
ix
Table 3.1: The pros and cons of locally developed and curriculum based tasks…... 28
Table 4.1: A summary of error codes to analyse learners’ responses...…….………...34
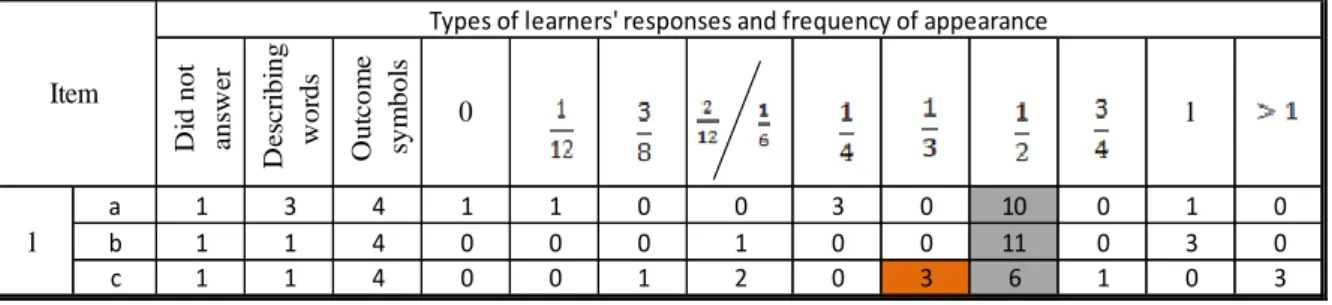
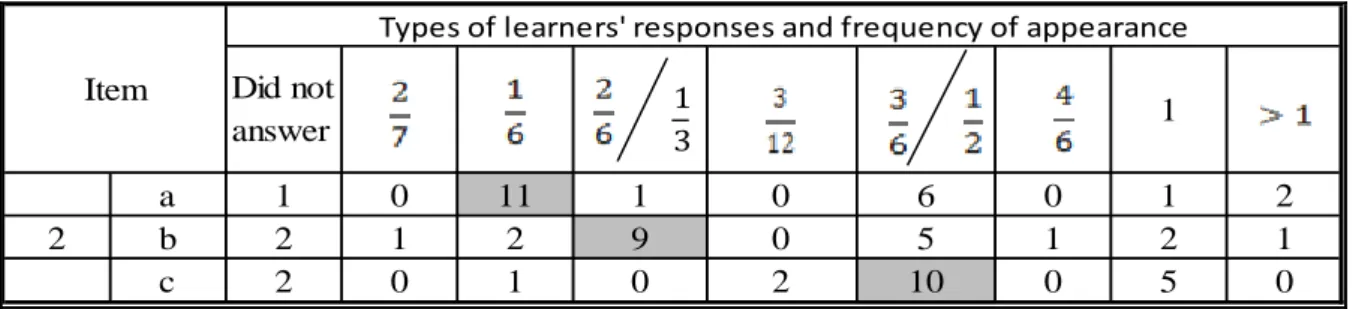
Table 4.2: Tpye of learners’ responses to item 1 and frequency of appearance ... 37
Table 4.3: Frequencies of learners’ responses to item 2 ... 39
Table 4.4: Frequency of learners’ responses to item 3... 39
Table 4.5: Frequencies of different types of representations constructed by learners ... 40
Table 4.6: Types of learners’ representations and their frequency ... 46
Table 4.7: Learners’ responses to item 5.3.1 ... 49
Table 4.8 : Learners’ responses to sub-item 5.3.3... 50
Table 4.9: Reasons cited by learners for their answers to sub-item 5.3.3 ... 50
Table 4.10: Learners’ responses to sub-item 6.1 and sub-item 6.2 ... 51
Table 4.11: Learners’ responses to sub-item 6.3 and sub-item 6.4 ... 52
Table 4.12: Description of learners’ responses to item 7(a) ... 53
Table 4.13: Learners’ responses to item 7(b) ... 54
Table 4.14: Learners’ responses to item 7(c) ... 56
Table 4.15: Types and frequency of learners’ representations of item 8 ... 57
Table 4.16: Learners' responses to sub-item 8(b) ... 57
Table 4.17: Learners' responses to sub-item 8(c) ... 58
Table 4.18: Learners' responses to sub-item 8(d) ... 58
Table 4.19: Learners’ responses to sub-item 9(b) ... 59
Table 4.20: Learners’ responses to sub-item 9(d) ... 60
x
(Pseudonyms used to preserve learners’ anonymity)
Excerpt 4.1: Interview with Prisca. ... 41
Excerpt 4.2: Interview with Janine. ... 43
Excerpt 4.3: Interview with Katlego. ... 44
Excerpt 4.4: Interview with Mpho. ... 45
Excerpt 4.5: Interview with Sara... 47
Excerpt 4.6: Interview with Tongai. ... 48
Excerpt 4.7: Interview with Tendai. ... 50
Excerpt 4.8: Interview with Tongai. ... 53
Excerpt 4.9: Interview with Nathan. ... 55
Excerpt 4.10: Interview with Nathan. ... 56
Excerpt 4.11: Interview with Prisca ... 60
Excerpt 4.12: Interview with Tendai. ... 61
xi
(Pseudonyms used to preserve learners’ anonymity)
Vignette 4.1: Mpho’s tree diagram. ... 45
Vignette 4.2: Sara’s Table. ... 46
Vignette 4.3: Tongai’s Venn diagram ... 46
Vignette 4.4: Tongai’s corrected Venn diagram. ... 48
Vignette 4.5: Maria’s two-way table... 54
1
CHAPTER 1: An overview of the study
1.1 IntroductionThis chapter presents the research problem of this study. It also locates the study in the South African curriculum, focussing particularly on learner errors and misconceptions on the mathematics topic of probability. Then the research problem is articulated, as are the aims and research questions. In addition, the significance of the study is discussed. The chapter concludes by describing how the rest of the study is structured.
1.2 Contextual background of the study
A number of curriculum reforms have occurred in South Africa since the dawn of democracy in 19941, particularly in the mathematics and science education learning areas (see, Department of Basic Education (DBE), 1998; 2005, 2011). These reform efforts have been triggered by the country’s very poor performance in national school assessments and Trends in Mathematics and Science Study (TIMSS) (Howie, 2001, 2003, 2004; Moloi & Chetty, 2010; Reddy, 2006; Taylor & Taylor, 2013) which is an international performance comparison test. According to the DBE (2011), the curriculum changes have been necessary to make the current system run better and to bring about “equality within a public school system” (p.17). There have been three curriculum changes from 1998 to 2012. These are Curriculum 2005, Revised National Curriculum Statement (RNCS) and now Curriculum and Assessment Policy Statements (CAPS).
Curriculum 2005 was outcomes-based, resource intensive and not very directive. It was aimed at empowering teachers but proved to be too complex to implement in most schools (Zenex Foundation, 2013). The RNCS focused on addressing the complexity of Curriculum 2005 by stressing on basic skills, content knowledge and grade progression as well as simplifying the outcomes statements. Implementation of the RNCS did not seem to give the intended outcomes, resulting in it being replaced by CAPS. According to the Zenex Foundation (2013), CAPS is a more regulated learning programme in that it has workbooks which sequence and pace the work on a daily basis. In this regard, CAPS reduces the teacher’s responsibility to interpret the curriculum outcomes, but the teacher still has to ensure that learning takes place in the classroom.
One major aim of CAPS is to produce learners with a deeper conceptual understanding of mathematical ideas (DBE, 2011). As a result, CAPS re-introduced the topics of geometry and probability into the main mathematics curriculum. Solving geometrical and probability problems involve logical thinking, justification and reflection which are parts of mathematical reasoning (Kilpatrick, Swafford & Findell, 2001). According to Kilpatrick et al. (2001), mathematical reasoning refers to logical thinking, explanation and justification of
1
2
strategies chosen for solving particular problems, as well as reflecting on such strategies with an aim of making them more effective. The crucial role of mathematical reasoning in problem solving has been acknowledged by other researchers such as Hiebert and Lefevre (1986). According to Hiebert and Lefevre (1986), reflection, which is a part of mathematical reasoning, is a critical requirement for improving one’s practice and making connections between the two pieces of knowledge which promote conceptual understanding. These authors argue that if a person has a good understanding of a concept, she/he can use it flexibly. In this regard, the re-introduction of geometry and probability into the main mathematics curriculum has underlined the commitment of the DBE to promote acquisition of high skills and knowledge in mathematics.
One of the problems that arose with the re-introduction of geometry and probability was that teachers and learners did not have sufficient learning and teaching support material (LTSM) for the new topics. For example, there are limited text books and past examination questions that deal with these topics. Given this scenario, I became interested in finding out how teaching and learning took place in these topics, focusing particularly on probability. In an attempt to understand instructional challenges embedded in the teaching and learning of Grade 10 probability, I explored learners’ errors and misconceptions. The researcher’s assumption was that South African learners performed poorly in mathematics because they held many unresolved errors and misconceptions in many mathematics topics, including probability.
1.3 Probability as a school mathematics topic
Probability is an important topic in school mathematics. Hirsch and O’Donnell (2001) describe probability as “the study of likelihood and uncertainty” (p. 1). These authors argue that understanding probability is necessary for learners as most things in commerce, industry and daily life are probability-based. Practical concerns such as product marketing, deciding which product to purchase, determining car insurance rates, deciding what and when to plant in farming, determining risks of child-birth defects and interpreting weather reports, among others, often rely on reasoning about probabilities. In South Africa, just like any other part of the world, probability is often used in marketing. Consumers can be convinced to buy a product through use of its supposed success rate or percentage. For example, a sliming cream which promises that 90% of the people who use it will lose weight in a month is likely to sell quickly and in large quantities due to its supposed success rate. The application of probability in these contexts demonstrates that it is necessary to include the topic in the school mathematics curriculum.
At high school level, instruction on probability could involve learning how to calculate the chances of events happening or not happening (see, Appendix 1). In the CAPS curriculum at Grade 10 level, section 3 of DBE (2011) document, the topic occupies number six on the list
3
of main topics in further education and training (FET) mathematics curriculum. The content to be covered includes theoretical and experimental probability, dependent and independent events, simple and compound events and generalisation of the fundamental counting principle across the grades.
The weighting for probability is 15% in Grade 10, 20% in Grade 11 and 15% in Grade 12, with a free play of plus or minus 3% in each case. The weighting of mathematics content areas gives guidance on the amount of time needed to address the content adequately as well as the spread of content in examinations. As a result, the topic is allocated about two weeks contact time in each grade. The curriculum expects learners to be able to “identify and solve problems and make decisions using critical and creative thinking” (DBE, 2011; p. 5). They are also expected to communicate effectively using language, visual and symbolic skills in various modes. This involves the use of Venn diagrams, contingency tables, tree diagrams, matrices and outcome listings.
The teaching and learning of probability is particularly challenging because it is an abstract concept. For this reason, it is important to employ different representations to mediate learning. Such representations could be tree diagrams, Venn diagrams, contingency tables, matrices or outcome listings. Although there have been studies involving use of representations in solving probability problems (for example, Zahner & Corter, 2010), none of these were focused on learners’ errors involving representations. Therefore this study is focusing on a relatively new area of research in probability.
Earlier researchers such as Piaget and Inhelder (1951), argue that modelling probabilistic situations are complex for learners. Later, the community of mathematics and statistics educators (see, Fischbein, 1999; Freudenthal, 1973; Shaughnessy, 1992) also concluded that modelling probabilistic situations is complex for learners and is often hindered by the learners’ wrong intuitions, biases and primitive conceptions to mention a few. It is therefore clear that probability as a section of mathematical reasoning is quite sensitive to the presence of misconceptions. The known misconceptions in probability are also well documented by research (for example, Fischbein & Schnarch, 1997; Fischbein, 1999; Shaughnessy, 1992). For this reason, I decided to explore the learners’ errors and misconceptions associated with solving probability problems involving representations in order to support learners’ development of mathematical proficiency in the topic. It is particularly interesting to investigate whether the documented misconceptions will have the same nature in a South African context as was seen by the earlier researchers.
Understanding learners’ errors is important in the teaching and learning of any subject matter. According to Riccomini (2005), teachers’ understanding of learners’ errors and misconceptions enriches their instructional effectiveness. Makonye (2011) argues that
4
establishing the extent of the learners’ understanding of mathematical concepts by way of error diagnosis and analysis helps teachers to prepare lessons that cater for learners’ conceptual levels. Additionally, “when teachers are aware of likely misconceptions and errors from a specific topic in mathematics, their lesson preparation as well as their lesson evaluation strategies are sharper and address the learners’ likely errors and misconceptions adequately” (Makonye & Luneta, 2014; p. 119). Hence, the question arises; what are learners’ errors and misconceptions?
1.4 What are learners’ errors and misconceptions?
Errors are an indication that something is not quite right. Olivier (1989) regards an error as an unintended or intended deviation from accuracy. There are two types of errors made by learners. These are systematic and non-systematic errors.
Systematic errors are “recurrent wrong answers methodically reproduced across space and time” (Makonye & Luneta, 2014; p. 120). These kinds of errors result from an underlying incorrect premise. Nesher (1987) calls these incorrect premises, misconceptions. A misconception is therefore a faulty hypothesis that causes systematic errors. As a result, learners do not recognise systematic errors as wrong because they are intuitively sensible to them (Brodie & Berger, 2010; Green, Piel & Flowers, 2008; Nesher, 1987; Olivier, 1996; Riccomini, 2005; Smith, DiSessa & Roschelle, 1993). Systematic errors may also stem from misuse or overstretching of some conceptual structures. They can go undetected for a long time as they can produce correct answers in some occasions (Nesher, 1987).
Non-systematic errors are superficial, non-recurring and unintended wrong answers (Khazanov, 2008). Olivier (1996) considers them to be slips because they are unconnected and do not necessarily result from misconceptions. Slips are errors which can be corrected easily by the learners themselves, when pointed out, through normal classroom instruction or self-checking in the process of verifying solutions (Brodie & Berger, 2010). Although non-systematic errors are superficial and may seem unimportant, they can have undesirable consequences in mathematics learning, especially when they are carried over in multi-step mathematics tasks (Makonye & Luneta, 2014).
In this study, my focus is on systematic errors because they can be detected by particular activities (Nesher, 1987). The discussion on types of errors sheds light on the problem statement of the study.
1.5 The problem statement
The re-introduction of new topics in the CAPS curriculum as from 2012 has resulted in learners facing new challenges in learning mathematics. In my teaching, for example, I have noted that learners struggle to grasp probability concepts. Initially, I doubted the effectiveness
5
of my teaching strategies. However, upon comparing my learners’ performance on probability questions in common examinations with similar classes at my school and neighbouring schools, I did not find the results any different. Nesher (1987) says, “it is only when doubts about our beliefs are raised that we stop to examine them and start an inquiry in order to appease our doubts and settle our opinions” (p.33). I began to raise questions as to what could be causing poor learners’ understanding of probability.
According to the 2013 and 2014 matric roadshow feedback, many learners struggle to grasp probability concepts. This is evidenced by their failure to solve probability problems in tests and examinations. Evidence also shows that many learners do not attempt probability questions, particularly those that involve representations (see, section 2.4.6). The few who attempt the questions usually give inappropriate responses. My assumption is that the use of different probability representations in representing or interpreting the probability problems is associated with these challenges. As a result, the study focuses on solving probability problems using different representations.
It is not quite clear what causes learners to perform poorly in probability. Hirsch and O’Donnell (2001) suggest that the poor performance could be due to learners not understanding laws of probability or errors resulting from violations in the application of the laws. The fact that learners try to make sense of a concept implies that mathematical knowledge cannot be transmitted or transferred from the teacher to the students without their understanding (Makonye & Luneta, 2014). It follows that there must be some dynamic re-interpretation, re-organisation and reconstruction in each learner’s mind (Bauersfeld, 1995; Hatano, 1996). It is due to some of these understandings that the learners construct, which are misconceptions in most cases, that their progress and achievement in learning mathematics is hindered. These kinds of understandings often result in errors (Makonye, 2011). A question arises. What can the teacher do to promote conceptual understanding of probability in learners?
In a way to at least begin to address my doubts about my teaching practice, I asked my colleagues at the school and schools in our cluster how they are dealing with the new topics. The preliminary survey revealed three scenarios in the South African classroom pertaining to teachers’ preparedness to handle the topic probability:
1. Some of the teachers have learnt and taught probability at school but have not been teaching it for some time.
2. Some of the teachers did probability at school a long time ago and have not taught it at school until now.
3. Some of the teachers did not do probability at school or as part of their training but now have to teach it.
6
These scenarios show that many teachers are learning probability as they teach it. Teacher competence in handling the topic is therefore questionable. In the face of content and pedagogical deficiencies, the temptation to just explain concepts rather than pay attention to learners’ errors and misconceptions becomes more overwhelming. Sasman, Linchevski, Oliver and Liebenberg (1998) argue that the teacher’s role in teaching and learning must be more than just explaining concepts and ideas to learners.
The new CAPS curriculum does not provide teachers with examples of how they can promote mathematical thinking in learners so that they can develop conceptual understanding. Several researches have proposed ways in which teachers can teach for conceptual understanding but it should be noted that implementing recommendations from research in a class is a complex task for most teachers (Kazemi & Stipek, 2001). Hence teachers find themselves struggling to implement the new ideas especially those which are not topic specific. Bolyard and Moyer-Packenham (2008) argue that teaching depends mainly on the richness of a teacher’s pedagogical content knowledge even though content knowledge is also very important. It is also noted that there have been few studies focusing on topic specific pedagogical content, even more so in high school mathematics (Cankoy, 2010). It is in this light that this study aims to contribute towards the development of topic specific pedagogical content knowledge In particular the topic probability. This will be accomplished by highlighting the errors and misconceptions, establishing the reasons for the errors associated with using different representations in solving probability problems.
My definition of Topic Specific Pedagogical Content Knowledge (TSPCK) resonates from Cankoy’s (2010) definition of pedagogical content knowledge (PCK). Cankoy (2010) defines PCK as a set of special attributes that help a teacher to transfer knowledge of content to others. In this study, TSPCK is a set of instructional attributes that are specific to a topic. Identifying, assessing and analysing errors and the reasons for the errors (which are possibly misconceptions) from learners work will lead to teachers gaining knowledge of learners’ thinking which enhances the teachers’ PCK.
I consider it important for a mathematics teacher to develop an interest in the errors and misconceptions made by learners. An awareness of such errors and misconceptions helps her/him to design effective intervention strategies (Riccomini, 2005). This can help learners to achieve higher scores and develop greater interest in mathematics. This explains why I intend to investigate the causes of the errors and misconceptions that learners make in the teaching and learning of probability problems using different representations.
1.6 Aims of the study
This study aims to investigate the errors and misconceptions that grade 10 learners have when answering probability questions using different representations. In addition it intends to
7
explain the errors and misconceptions that learners have when they use particular representations in solving probability problems. In view of the research aim, the study was guided by the following research questions.
1.7Research questions
1.7.1 What errors do grade 10 learners make when using different representations to solve probability problems?
1.7.2 How can the relationship between grade 10 learners’ solution representations and their errors and misconceptions in solving probability problems be explained?
1.8 Rationale and significance
Several factors could contribute to what is eventually learnt in a given subject matter lesson. Vygotsky (1978) points out that learning occurs in a learner’s Zone of Proximal Development when a learner is scaffolded to learn by a more knowledgeable other. In the classroom context, the teacher is considered to be the more knowledgeable other. Modiba (2011) and Carnoy, Chilisa and Chisholm (2012) observe that even the best teachers need adequate subject matter knowledge for them to provide effective instruction. Nesher (1987) notes that, while the teacher provides the subject content knowledge and pedagogical skills, the learner provides challenges in the form of conceptual errors. The extent to which the teacher uses her/his pedagogical skills to communicate the subject content and manage learners’ misconceptions determines the effectiveness of learning. Effective management of learners’ misconceptions can only take place if the teacher is aware of the learning weaknesses and how they arise. In other words, she/he can only craft effective pedagogical strategies if she/he is aware of learners’ conceptual challenges.
In the classroom, the teacher has to encourage “newcomers to become old-timers” through what Lave (1993) calls “legitimate peripheral participation” (p.68). Hanks (1991) adds by saying that effective learning is a function of more active involvement. In other words, the learner’s capabilities improve as he/she participates more and constructs knowledge for herself/himself. According to Lave (1993, p.68), learners gradually move from being ‘novices’ to ‘experts’ if they participate more actively in learning.
Making learners participate fully in classroom activities means that the teacher should allow them to make mistakes. The benefit of this is that the teacher becomes knowledgeable of learners’ errors and misconceptions and can therefore craft relevant and more effective pedagogical strategies. Nesher (1987) argues that mistakes are learners’ contribution to the lesson which the teacher can use as a feedback mechanism for real learning. Therefore a study into the errors and misconceptions made by learners in the teaching and learning of probability is important because it can result in improved understanding of how the topic can
8
be taught. It can also conscientise mathematics teachers on the need to reflect on their practice constantly so that they develop a more sound understanding of how it aids or retards learning. Teacher educators also stand to benefit because they develop a better understanding of learners’ conceptual inadequacies and learning needs in the topic probability. As a result, they can properly skill student teachers on how to handle the topic in the classroom.
Given the current content and pedagogical inadequacies obtaining in the classroom on the topic probability, the study can go a long way towards developing the practice of practising teachers. A culture of the need for teachers to constantly interrogate their practice also takes root. There is a tendency among teachers to shift blame to learners or some other factors when teaching and learning do not produce the expected results. As an individual, I will also benefit immensely from this study. It will sharpen my research and analytical skills as well as my teaching practice.
Another significance of this research is that it can deepen teachers’ understanding of well documented errors and misconceptions in the domain of probability by looking at them in a different perspective. Several researches on the use of representations in solving problems have been done. Suh (2007) argues that learners make more meaningful connections between new information and previously acquired knowledge when representing a mathematical idea in multiple modes. Thus, the practice of multiple representation of a mathematical problem promotes the development of mathematical proficiency. On the other hand, Zahner and Corter (2010) argue that external visual representations can facilitate probability problem solving at the stage of finding a solution strategy if an appropriate representation is chosen. Hence, this exploration will give an insight into the learners’ wrong choices of solution strategies leading to inappropriate answers in solving probability problems.
1.9 Definition of terms used in the study
1.9.1 Probability
According to Hirsch & O’Donnell (2001) probability is the study of likelihood and uncertainty.
1.9.2 Errors
Errors are unintended or intended deviations from accuracy (Olivier, 1989). The errors are said to be systematic if they are recurring basing on a faulty hypothesis and non-systematic if they are non-recurring and random errors. This study is focusing on systematic errors.
9
1.9.3 Misconceptions
Nesher (1987) refers to misconception as an underlying incorrect premise or a faulty hypothesis that a learner refers to and generates a series of errors. In the context of this study, misconceptions mean an underlying premise that learners refer to in construction or interpretation of representations and generates a series of errors.
1.9.4 Internal visual representations
Internal visual representations are mental images or models of a word problem (Polya, 1957). According to Polya (1957), these images are mentally manipulated in the process of solving problems.
1.9.5 External visual representations
External visual representations are external inscriptions of mental images or models of a problem (Zahner & Corter, 2010). Zahner and Corter (2010) propose that problem solvers may externalise their mental inscriptions to aid in understanding of the text or when they have to share their solutions with others. These external inscriptions include pictures, drawings, outcome listings, tables, graphs and spatial re-organisation of given information. 1.10 Conclusion
This chapter outlined the context of the study and why it is relevant to mathematics education in South Africa at this time. The chapter also discusses how the study relates to the mathematics education curriculum in South Africa. The research problem was then deliberated. Also conversed were the purpose of the research, the research questions, significance and definitions of key constructs in the study. I outline the theoretical framework that guided this study and the literature that relates to the study in chapter two. The analytical framework and the categories used to analyse the data are also discussed in chapter 2. Chapter 3 describes the methodology including sample selection, data collection, how issues and how issues of validity and reliability were dealt with. Chapter 4 is on data analysis and discussions. Conclusions, findings of the study and recommendation end the research report with chapter 5.
10
CHAPTER 2: Theoretical framework and literature review
2.1 Introduction
In this chapter, I present the theoretical framework for this study, which is informed by Nesher (1987) and Sfard’s (2007). The conceptual framework of this study is enlightened by Brodie and Berger (2010). I then review literature on errors and misconceptions in learning probability, types of errors, known misconceptions, use of representations and types of representations in probability.
2.2 Theoretical Framework
This study aims to investigate the errors and misconceptions that Grade 10 learners make in solving probability problems using different representations. Learning theories provide useful lens to explain and understand teaching and learning in a greater depth. However, characteristically lenses draw certain areas closer to the eye while ignoring other aspects and hence it is not likely possible to have a theory that encompasses every aspect about learning. For this reason, my study draws from Nesher’s (1987) theory of errors and misconceptions to inform the process of error detection. Sfard’s (2007) theory of commognition was also considered as it relates to representations and prevalence of error in learning. Brodie and Berger (2010) used both the constructivists’ perspectives and Sfard’s view of mathematics as a discourse to develop a discursive framework for learners’ errors which include representations. Since my study draws from the constructivists and discursive perspectives, the discursive framework becomes a suitable and useful tool to classify and analyse the learners’ errors and misconceptions in Grade 10 probability.
2.2.1 Nesher’s (1987) theory of errors and misconceptions
Nesher’s (1987) theory of errors and misconceptions is based on the idea that learners’ contribution to their learning is their “expertise in making errors” (p. 33). In Nesher’s terms, committing an error reveals the incompleteness of the learner’s knowledge and enables the teacher to contribute additional knowledge to complete it or guide the learner to realise where s/he is wrong. The teacher therefore needs to tap into the learner’s misconceptions rather than shy away from them. Hence, the learners’ erroneous performance informs instruction. It is for this reason that the current study aims to investigate learners’ errors in solving probability problems and the misconceptions from which the errors result.
Over and above anticipating the errors, Nesher (1987) suggests that it is important for a teacher to be “aware of the cases that discriminate between various types of misconceptions and those that do not discriminate misconceptions at all” (p. 36) as some misconceptions can give correct answers. For example, a learner may have a misconception that a decimal with more digits on the right of the comma is greater than the one with fewer digits. Consider the question; which decimal is greater between 0.5 and 0.456? If the learner answers 0.456 we
11
might suspect that s/he has this misconception. If the learner answers 0.5, we cannot know whether s/he understands order in decimals. Therefore, the teacher should intentionally look for discriminating items for particular misconceptions. However, Nesher’s suggestions are dependent on the teacher being aware of learners’ possible misconceptions. Nesher (1987) recommended that for teachers to know possible misconceptions and errors they produce, the teachers should:
a) Know how the new knowledge is integrated into larger knowledge system that the learner have;
b) Be aware how the previously learnt procedures may interfere with the new knowledge; and,
c) Clearly discriminate new elements from the old ones.
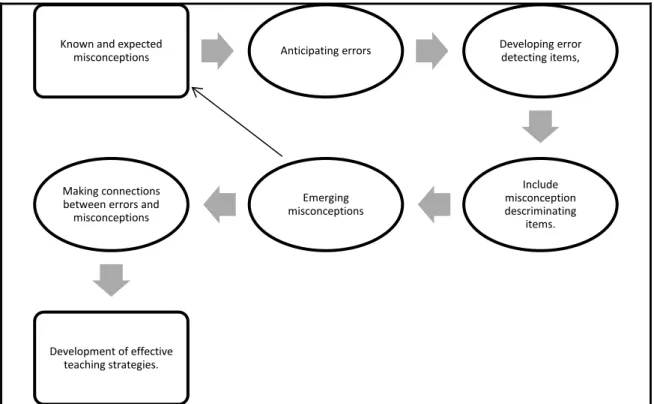
Figure 2.1 summarises the process of error and misconception detection as outlined by Nesher (1987).
Figure 2.1: The process of error and misconception detection
Nesher’s theory of errors and misconceptions focuses on error detection but it is silent on the use and effect of representations. It is also not crystal clear from which part of the subject content the teacher should look to implement Nesher’s (1987) recommendations mentioned in Figure 2.1. Bearing in mind that many teachers do not find it easy to implement research
Known and expected
misconceptions Anticipating errors
Developing error detecting items, Include misconception descriminating items. Emerging misconceptions Making connections
between errors and misconceptions
Development of effective teaching strategies.
12
results especially if they are not very specific (Kazemi & Stipek, 2001) I turn to Sfard’s (2007) theory of commognition for insight in relation to representations and prevalence of errors.
2.2.2 Discourse and the prevalence of errors (Sfard, 2007)
Thinking is dialogical in nature as it involves “informing ourselves, arguing, asking questions and waiting for our own responses” (Sfard, 2007; p. 572). Therefore human thinking can be defined as “communicating with oneself” and thus regarded as a form of discourse (Sfard, 2007). Sfard (2007) argues that, if mathematical thinking can be defined as “the activity of communicating with oneself” (p. 571) then mathematics can be seen as a discourse. For Sfard (2007), a discourse is considered mathematical if it consists of mathematical words, visual mediators, narratives and routines, and these are discussed in the next sections.
2.2.2.1 Mathematical words include words relating to shape and quantities. Cubic, rectangle and negative 4 (minus 4), among others, are examples of mathematical words. These words have a peculiar meaning in mathematics which may be different in everyday language. Learners need to comprehend the mathematical words correctly for them to be able to relate them to pre-learnt procedures and select the correct one to solve a mathematical problem.
2.2.2.2 Visual mediators can be symbolic artifacts like formulae or images of concrete objects like graphs, diagrams and drawings. Visual mediators are means by which “participants identify the object of their talk and coordinate their communication” (Sfard, 2007, p. 573).
2.2.2.3 Narratives are written or spoken texts which are a description of objects or relationships between objects. Narratives can be at object-level (stories about objects, eg. 𝑦 = 2𝑥 + 1 ) or at meta-level (stories about the discourse itself, eg. When calculating for an unknown, make the unknown the subject of the formula). Narratives are therefore subject to endorsement or rejection. The endorsement criteria are different from one discourse to another. It is from these narratives that misconceptions are most likely to originate.
2.2.2.4 Routines are well-defined repetitive patterns involving word use, mediator use and endorsing narratives in interlocutors’ actions (Sfard, 2007). A routine’s general direction is regulated by object-level and meta rules of the discourse in which it is applied. Therefore a learner needs to have a good understanding of the words, mediators and narratives for him/her to execute routines appropriately.
Sfard’s description of mathematics as a discourse provide teachers with direction to which part of the subject content they should look to implement Nesher’s (1987) recommendations. Hence, to determine possible misconceptions which may result into errors, the teacher needs
13
to analyse the words, visual mediators, narratives and routines of the learners’ previously learned knowledge and the new work to be learnt.
According to Sfard (2008) misconceptions result from applying meta-rules of one discourse to another discourse where they no longer hold. This happens when the discourse changes and the learner is not aware of the change. However, in a different study, Brodie and Berger (2010) discovered that some errors are not necessarily caused by misconceptions. These authors developed a discursive framework to account for learners’ errors resonating from both the constructivists and participations notions of errors and misconceptions which I will discuss below.
2.3 Conceptual framework
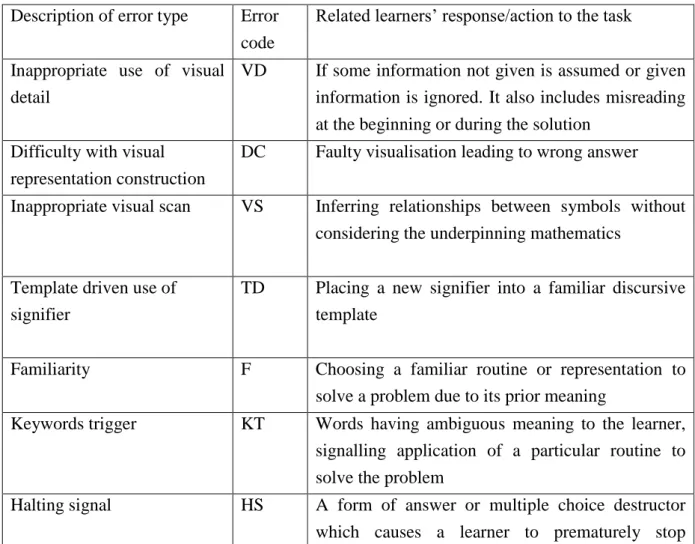
In order to describe and account for learners’ errors in the current study, I draw from Brodie and Berger’s (2010) discursive framework for learner errors in mathematics. Brodie and Berger (2010) locate errors as rooted in narratives and are manifested in the words, visual mediators and routines. The discursive framework consists of three basic categories of errors which are; errors of mediators, errors of signifiers and errors of routines. In the next sections I describe what each category of error entails according to Brodie and Berger (2010).
2.3.1 Errors of visual mediators
Errors of visual mediators can be divided into three categories. These categories are inappropriate visual scan, inappropriate use of visual detail and difficulty with visual construction. These are discussed in detail below.
2.3.1.1 Inappropriate visual scan
According Sfard (2008), written symbols, like formulae, tables and numerals, visually mediate mathematical thinking. Therefore if a learner visually scans inappropriately, it may result in the learner inferring relationships between symbols without considering the underpinning mathematics (Brodie & Berger, 2010). Therefore there are variations between the data as given in the item and how the learner denotes it. This type of errors concurs with misused data errors (Movshovitz-Hadar, Zaslavsky & Inbar, 1987) which may occur due to misreading at the beginning or during a problem solving process. The choice of procedure carried out by the learner is not because of the mathematical relationship between the different signifiers involved. Hence, errors of this kind do not necessarily result from misconceptions.
2.3.1.2 Inappropriate use of visual detail
In questions involving interpreting diagrams or graphs, an error is regarded inappropriate use of visual detail if some information is ignored when interpreting the question (Brodie & Berger, 2010). Brodie and Berger (2010) further noted that, if other information which is not
14
given in the question is assumed and used by the learner in interpreting the question it is also referred to as inappropriate use of visual detail.
2.3.1.3 Difficulty with visual construction
Certain questions require the learner to construct the visual mediator (concretely or imagination), which can be pictures, spatial re-organisation of given information, listing outcomes, contingency tables, Venn diagram, tree diagram or probability matrix. In the current study all of these notions constitute mathematical representations. An external visual representation can facilitate probability problem solving when it is appropriate and correctly constructed (Zahner & Corter, 2010). However, some learners are not eloquent in visual construction or drawing (Brodie & Berger, 2010). In this case, a faulty visual construction will lead to a wrong answer signifying the error due to difficulty with visual construction.
2.3.2 Errors of Signifiers
Errors of signifiers are sub-divided into two groups. These include errors due to familiarity as well as difficulty with visual construction.
2.3.2.1 Difficulty with visual construction
Learners are often guided by previously known signifiers in familiar discourses on how to use new and similar signifiers. Thus the learner “inserts a new signifier into a familiar discursive template” (Brodie & Berger, 2010, p. 175). For example, due to the amount of time spend on linear relations like proportion, learners become very familiar with proportion in such a way that they will attempt using proportion to solve problems even when it is not appropriate (Van Dooren, De Bock, Depaepe, Janssens & Verschaffel, 2003).
2.3.2.2 Familiarity
Learners may choose a certain familiar routine or representation to solve a probability problem because s/he recognises it or has prior meaning to him/her (Brodie & Berger, 2010). Zahner and Corter (2010) argue that certain choices of representations are associated with higher rates of solution success. Therefore learners might inappropriately choose a representation due to its previous success rate. For example, a learner who is familiar with a tree diagram and believe that it usually leads to correct solutions would use it even in a situation where it is not appropriate.
2.3.3 Errors of Routines
Errors of routines include errors due to keyword triggers as well as halting signals. These are discussed in the next sections.
2.3.3.1 Keyword trigger
Keywords maybe words which appear in both the everyday and in the mathematical register resulting in the keywords having ambiguous meaning to the learner (Brodie & Berger, 2010).
15
A certain word or term in the question may signal to the learner that s/he should apply a particular routine to solve the problem. Consider the question: what is the probability of scoring a mark less than 10 in the test? The word less is known to trigger the use of subtraction even when it is not mathematically correct (Kilpatrick, Swafford & Findell, 2001). Therefore, if a word causes an incorrect response, it becomes a keyword trigger.
2.3.3.2 Halting signal
A learner expecting a proper fraction as an answer may accept a routine to be complete when s/he derives a proper fraction. A multiple choice distractor which causes the learner to prematurely stop the routine becomes a halting signal. Brodie and Berger (2010, p.174) describes a halting signal as a “trigger for premature closure of a routine”.
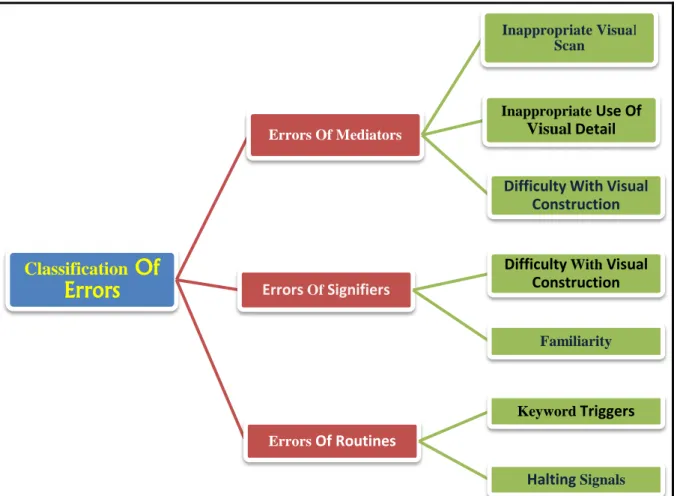
Figure 2.2 summarises the classification of errors and misconceptions as outlined by Brodie and Berger (2010).
Figure 1.2: Classification of learner errors according to Brodie and Berger (2010)
Classification
Of
Errors
Errors Of Mediators Inappropriate Visual Scan Inappropriate Use Of Visual DetailDifficulty With Visual Construction
Errors Of Signifiers
Difficulty With Visual Construction
Familiarity
Errors Of Routines
Keyword Triggers
16
For the purposes of this study, the categories mentioned in Figure 2.2 are the main tool, but not limited to them, of classification and analysis of the learner errors as well as determining the reasons for the errors. Unlike Brodie and Berger (2010) who only analysed distractors which were chosen by more than 25% of the learners, errors as pointed to by discriminating items in the test were analysed. In some cases, learners whose errors cannot be accounted for in relation to the discriminating items in place were interviewed.
2.4 Literature Review
This study intended to investigate the errors and misconceptions the learners make when solving probability problems. In order to be able to answer my research questions, I draw from four sources of information: theories on errors and misconceptions; types of errors; known misconceptions in probability; visual representations in probability.
2.4.1 Errors and misconceptions in mathematics education
Cognitivists like Piaget (1964) and Vygotsky (1986, 1978) view learning as the acquisition of more sophisticated conceptual structures in the mind. The mind is where the biological factors and social factors interact, creating cognitive conflict (Brodie & Berger, 2010). This happens through the process of equilibration, which consists of assimilation and accommodation (Piaget, 1964). Assimilation can be described as a process of acquiring new knowledge by associating it with existing knowledge (Hatano, 1996). For example in learning algebraic fractions, learners may assimilate the concept of adding algebraic fractions by linking it to ordinary fractions. Thus, new knowledge must be familiar to the existing knowledge structures, schema or conceptual framework for assimilation to be possible (Nesher, 1987; Olivier, 1989; Piaget, 1964). Accommodation occurs when learners encounter a concept which is different from what they know (Hatano, 1996). Re-organisation of existing structures or creation of a new structure becomes necessary (Hatano, 1996) because learners do not have any structures to interact with the new concept as it is very different to the existing concepts in place. It can then be said that accommodation begins with the state of uneasiness and ends with a shift of position which may be comfortable or uncomfortable.
For constructivists, it is through equilibration that misconceptions may result. As learners assimilate or accommodate new concepts better understanding might be enhanced or misconceptions might occur (Hatano, 1996; Nesher, 1987; Olivier, 1989). According to Olivier (1989) misconceptions arise from attempts to connect or integrate new knowledge with existing knowledge. This implies that the misconceptions, and the errors resulting from them, are quite normal in the process of acquiring knowledge (Brodie & Berger, 2010; Smith, DiSessa & Roschelle, 1993). In other words learning includes dealing with errors and misconceptions. Thus the occurrence of errors, which create difficulties in understanding, promotes learning.
17
Teachers may find learners’ misconceptions difficult to understand but they actually make sense to learners (Erlwanger, 1973). Misconceptions make sense to the learners because they are derived from previous instruction (Nesher, 1987) although they are not explicitly taught (Brodie & Berger, 2010). Smith et al. (1993) also propose that misconceptions result from overgeneralisation of concepts from one domain to another. However, in their study, Brodie and Berger (2010) found out that some errors are not necessarily caused by misconceptions. Brodie and Berger (2010) suggest that errors occur when certain rules are used in different discourses which are incommensurable. This idea concurs with Sfard’s (2007, 2008) idea that misconceptions result from applying meta-rules of one discourse to another discourse where they no longer hold. Sfard (2007) argues that misconceptions occur when the rules of the discourse change but nobody tells you. As a result the rules are applied inappropriately to situations they no longer hold. It was also reported by Smith et al. (1993) that errors and misconceptions they result from cannot be corrected through normal classroom instruction. Hatano (1996) also suggested that since misconceptions are mental constructions, they need to be restructured by the learners into mathematically correct and acceptable structures. This raises the question; what is the nature of errors?
2.4.2 Types of learner errors
According to Makonye (2011), errors can be classified into domain general errors and domain specific errors. Domain general errors refer to errors that are not subject specific while domain specific errors are subject or topic specific. Davis (1984) also noted that there are error patterns which are common across different learners and those that are peculiar to individual learners. In this study both types will be considered.
Donaldson (1963) suggested that both the domain general errors and domain specific errors can be classified into three categories. These categories are arbitrary, structural and executive errors. These categories still hold today. As a result, Makonye (2011) referred to these categories as the most important classification of errors in the teaching and learning of mathematics.
2.4.3 Donaldson’s (1963) classification of errors
2.4.3.1 Arbitrary errors are errors resulting from selective processing of information and ignoring other attributes. For example 𝟏𝟖is considered the same as 8. These kinds of errors occur when learners ignore part of the available information while acting on the rest of the information (Donaldson, 1963). In some cases, when learners fail to take account of the given information, they choose to forcibly fit the question to what they know or are familiar with (Makonye, 2011) resulting in arbitrary errors.
18
2.4.3.2 Structural errors are errors due to “failure to appreciate the relationships involved in the problem or to grasp some principle essential to solution” (Donaldson, 1963, p. 41). These errors emanate from a lack of understanding of ideas inherent in a mathematical problem. Therefore structural errors are conceptual in nature. That is, when learners have fallacious perceptions about the nature of mathematical concepts, it leads to structural errors. For example an elementary arithmetic problem taken from Cramer, Post and Currier (1993) is stated below:
Sue and Julie were running equally, fast around a track. Sue started first. When she had run9 laps, Julie had run 3 laps. When Julie completed 15 laps, how many laps had Sue run?
Thirty-two out of the 33 pre-service teachers who attempted this item applied proportion to solve this problem as follows:
9 3=
𝑥
15 𝑠𝑜 𝑡ℎ𝑎𝑡 𝑥 = 45 .
The multiplicative structure is not correct for this problem as the problem has an additive structure. The error exhibited by these pre-service teachers is structural, because they failed to grasp an essential rule to the solution (Donaldson, 1963).
2.4.3.3 Executive errors refer to those errors which are due to failure to carry out procedures or manipulatives. This can happen even when the required concepts have been understood (Orton, 1983). Errors such as failure to express a fraction as a percentage are executive. For example, 14= 25%. The learner goes on to write 14 = 0.25%. In this case, the learner expresses the fraction as a decimal and leave out multiplying by 100 to convert the decimal to a percentage.
Later, Movshovitz-Hadar, Zaslavsky and Inbar (1987) proposed another classification model. These authors proposed six categories of errors as discussed in the next sections.
2.4.3.3.1 Misused data errors which are due to variations between the given data in the item and how the learner relates to the data. This kind of error could also be a result of misreading the item at the beginning or during the problem solving process. This misuse of data will then be carried on to further calculations.
2.4.3.3.2 Misinterpreted language errors are mathematical errors resulting from poor interpretation of language including mathematical symbolism. Such errors may happen during modelling the problem or encoding natural language into mathematical expressions. For example, in answering the question; what is the probability that when choosing a boy at random he will be wearing contact lenses? Some learners will fail to interpret that the sample space is the
19
population of boys in the target population, thereby exhibiting errors if misinterpreted language.
2.4.3.3.3 Logically invalid inference errors are due to false generalisation of old knowledge into new knowledge. For example, applying the routine for multiplication of fractions over addition of fractions.
2.4.3.3.4 Unverified solutions errors (slips) occur when learners work correctly on a solution that directly does not address a given problem. The learner may correct their own error if they check their solution carefully.
2.4.3.3.5 Technical errors are those errors which occur due to failure to carry out calculations, process computational algorithms, reading data from tables, algebraic errors such as writing 3𝑥 − 2 − 2𝑥 + 1 instead of (3𝑥 − 2) −
(2𝑥 + 1).
2.4.3.3.6 Random errors are non-systematic errors which do not reccur and do not make any pattern.
Although some of Movshovitz-Hadar et al. (1987) categories are subsumed by Donaldson’s (1963) categories, they shed more light in to types of errors. These categories indicate the possible reasons for the errors.
2.4.4 Reasons for errors (Radatz, 1979)
Radatz (1979) also proposed a model of classification of errors in different mathematics topics and concepts based on the reasons for the errors. The categories are lack of mastery of language, difficulties in obtaining visual information, deficient mastery of prerequisite knowledge and skills, incorrect associations or inflexible thinking and application of irrelevant rules or strategies. Even with knowledge of all the types of errors and possible reasons for the errors discussed above, it is not easy to detect errors. Nesher (1987) maintains that it is not easy to detect errors if the teacher is not anticipating them.
2.4.5 Known misconceptions in probability
As mentionedabove, a teacher can easily identify errors if he/she is anticipating them. Being aware of the known misconceptions equips the teacher for error identification. There are four known misconceptions in probability which include misconception of representativeness, illusion of linearity, recency effect and inappropriate distinction between simple and compound events. I describe what each misconception entails in the next sections.
2.4.5.1 Representativeness refers to estimating uncertain events based on sample reflection of population events (Hirsch & O’Donnell, 2001). For example, learners with this misconception will think that if a fair coin is tossed six times, the probability of getting an
20
ordered sequence HHHHHH is less likely than that of getting HTHTHT. This misconception also includes the neglect of size in comparing two probabilities, where learners ignore the relevancy of the law of large numbers (Hirsch & O’Donnell, 2001). For example, Fischbein (1999) gave the following problem to learners in grade 5 to 11:
The likelihood of getting heads at least twice when tossing three coins is smaller than/equal to/greater than the likelihood of getting heads at least 200 times out of 300 times.
The learners were asked to choose the correct phrase from the words in italics. Fischbein (1999) found that most of the learners at each grade said that the probabilities are equal. Most learners used the equality of ratios to justify their answers.
2.4.5.2 Illusion of linearity refers to improper application of linear relations where they do not apply (Van Dooren et al., 2003). For example, Fruedenthal (1973, p. 594) noted that when asking students “how many times must a die be thrown to get an equal chance of at least one six?” the students invariably answered; three. The reasoning is: probability of success in one trial is 16 . Therefore throwing 3 times, the probability becomes 16× 3 = 12 . The erroneous nature of this reasoning is revealed by the fact that, if more than 6 throws are done, the probability will be more than 1 (Van Dooren et al., 2003).
2.4.5.3 Recency effect: refers to the effect that recent events have on future events which stems from improper distinction between independent and dependent events (Fischbein & Schnarch, 1997). Consider the question, “If a couple already have two sons and are considering a third child, are they more or less likely to have a daughter the next time?” Most learners fail to realise that events such as gender of a baby are independent events and consequently the outcome of one event does not influence the outcome of the next. This misconception also includes the tendency to judge probability of the whole to be less than the probability of the parts (Kustos & Zelkowski, 2013).
2.4.5.4 Improper distinction between compound and simple events
According to Fischbein and Gazit (1984), the notion of a simple event is connected with the model of a single action while the notion of a compound event is related to a representation of more than a single operation, for many learners. Thus, for these learners, a single event has one result and a compound event has multiple results. This misconception includes using an additive procedure instead of the appropriate multiplicative procedure for calculating the number of all possible outcomes in compound events. For example, the number of possible outcomes when sums of numbers are considered in rolling a pair of dice is 6 × 6 = 36 not
21
2.4.6 Visual representations and problem solving
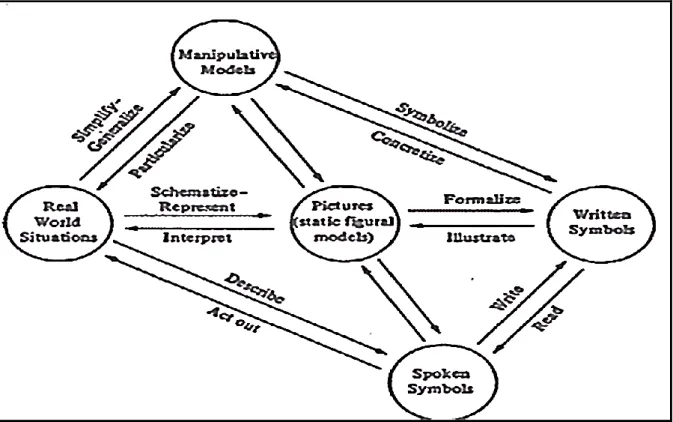
The importance of mental representations in problem solving has been acknowledged a long time ago by researchers such as Polya (1957). However, there is little evidence to support this idea, perhaps due to the difficulty involved in studying mental imagery (Douville & Pugalee, 2003). Corter and Zahner (2007), in their study on the process of probability problem solving, concluded that internal representation or mental model of a word problem should be constructed in order to solve the problem successfully. However, it is not always possible to get an insight into the learners’ mental representations unless they create some form of external visual representations. A substantial amount of evidence has accrued to show that visual representations, diagrams in particular, can be of great assistance in problem solving (Corter & Zahner, 2007; Lesh, Landau & Hamilton, 1983; Schwartz & Martin, 2004; Suh & Moyer 2007). Many of the earlier studies concluded that external representation promotes the development of the learner’s conceptual understanding of the problem. Lesh, Landau and Hamilton (1983) developed a model to explain the importance of representations in learning mathematics (see, Figure 2.3).
Figure 2.3: Lesh, Landau & Hamilton’s (1983) model of the five types of distinct types of representation system (Adapted from Suh and Moyer, 2007)
Figure 2.3 illustrates that learners develop a deep understanding of mathematical ideas when they experience and make connections of the ideas in different modes. Using Lesh et al. (1983)’s work, Suh and Moyer (2007) argue that “the ability to translate among different