AN ANALYSIS
OF THE MAJOR
UK POWER
COMPANIES
UK
POWER
GIANTS
GENERATING
CLIMATE
CHANGE
Copyright © 2004 Innovest All rights reserved
No part this publication may be reproduced, stored in a retrieval system or transmitted in any form or by any means electronic, mechanical, photocopying, recording or otherwise without prior written permission of Innovest.
Disclaimer
While Innovest considers that the information and opinions given in this work are sound, all parties must rely upon their own skill and judgement when making use of it. Innovest will not assume any liability to anyone for any loss or damage arising out of the provision of this report. The report contains projections that are based on assumptions that are subject to uncertainties and contingencies. Because of the subjective judgements and inherent uncertainties of
projections, and because events frequently do not occur as expected, there can be no assurance that the projections contained herein will be realised and actual results may be different from projected results. Hence the projections supplied are not to be regarded as firm predictions of the future, but rather as illustrations of what might happen. Parties are advised to base their actions on an awareness of the range of such projections, and to note that the range necessarily broadens in the latter years of the projections.
The views of the authors expressed in this publication do not necessarily reflect those of WWF.
For further information please contact:
The Climate Change Programme WWF-UK
Panda House, Weyside Park Godalming, Surrey GU7 1XR Telephone 01483 426 444 Fax 01483 426409
www.wwf.org.uk
Innovest Strategic Value Advisors 4 Royal Mint Court
London EC3N 4HJ United Kingdom
Table of Contents
1. Executive Summary...2
Introduction
...2
Methodology...3
Survey Results
...4
2. Introduction
...10
3. Ranking Results...17
4. Conclusions
...31
5. Appendix I
...35
Methodology...35
Report Authors
...42
Glossary...42
Table of FiguresFigure 1: - Cumulative Ranking
...5
Figure 2 - Assessment matrix...6
Figure 3 - Fuel-use in electricity generation, 2003...11
Figure 4 - Total of UK power stations by fuel-type
...12
Figure 5 - Power Station Emissions
...12
Figure 6 - Carbon Dioxide Emissions Improvement 1998 – 2004...17
Figure 7 - Carbon Intensity of Electricity Production 2002 – 2004
...18
Figure 8 - Cumulative Long-Term Carbon Dioxide Emissions
...19
Figure 9 - Consumer EE Training and Incentives and Energy Services
...20
Figure 10 - Energy Efficiency/Energy Services Improvement
...21
Figure 11 - Renewable Energy Capacity Improvement
...22
Figure 12 - New RE Capacity Investment/Renewables Capacity under Construction
...23
Figure 13 - Compliance with RO and Percentage of Compliance through ROCs Purchases...24
Figure 14 - Size and Coverage of Green Tariff Programs (2002 - 2004)
...25
Figure 15 - Renewable Energy Policy
...26
Figure 16 - CHP Capacity
...27
Figure 17 - ESCO Services
...29
Figure 18 - Company Positioning...30
Figure 19 - UK Electricity Producers Carbon Dioxide Risk Ranking
...31
Figure 20 - UK Electricity Producers' EE Services Programs and Progress
...32
Figure 21 - UK Electricity Producers' RE Programs and Progress
...33
Figure 22 - Combined Company Ranking
...34
Figure 23 - Variables and Weights used in Methodology
...39
1.
Executive Summary
Introduction
Background
This study presents a detailed qualitative and benchmarking analysis of major UK power sector companies and their performance relating to carbon dioxide (CO2) emissions, the primary cause of climate change.
The research compares the ‘carbon risk profile’ of six power companies in their efforts to manage and reduce their emissions and combat climate change. Analysis was done on how their CO2 emissions have changed
over time, as well as their energy efficiency and renewable energy policies, actions and investments in terms of both voluntary commitments and current government regulations.
The research was carried out for the WWF-UK Stop Climate Chaos! Campaign by Innovest Strategic Value Advisors (Innovest) a global research provider assessing non-traditional sources of financial risk and opportunity.
Companies in the survey
Innovest reviewed the corporate policies, investments, regulatory compliance and energy generation profiles of seven UK power companies:
• British Energy (BE)1,
• EDF / London Electricity / Seeboard (now EDF Energy),
• Innogy (now RWE-npower),
• Powergen (now E.ON-UK),
• Scottish Power (SP),
• Scottish & Southern Energy (SSE) and
• Centrica.
(NB. this report uses the familiar UK names for the following companies – EDF, Innogy, Powergen, British Energy, Scottish Power and Scottish & Southern Energy are abbreviated to BE, SP and SSE in some cases to avoid repletion of the full company names).
Innovest About Innovest
Innovest is an internationally recognized investment research and advisory firm specializing in analysing companies' performance on environmental, social, and strategic governance issues, with a particular focus on their impact on competitiveness, profitability, and share price performance.
Innovest is dedicated solely to the production of high-quality, value-added research and advisory services in the field of sustainability and finance. Due to the to the potential financial implications of climate change and the cross-sector nature of this risk, Innovest leveraged its expertise in sustainability and finance and founded a specialised Carbon Finance Practice, with the objective of obtaining a detailed understanding of the financial and other implications of climate change.
Innovest has undertaken a large body of work in the dual areas of (i) carbon finance and climate-related risks and opportunities, and (ii) the power sector. Clients in these areas of Innovest work have included UNEP FI, the Carbon Disclosure Project (three years running), the US Environmental Protection Agency, EDF (France) and Duke Energy. Further details can be found on the Innovest website at www.innovestgroup.com
1
Study Objectives Report aims
Stop Climate Chaos! aims to engage with and encourage all energy sector stakeholders - power companies, financial institutions, the UK government and consumers - to make the switch from fossil fuels to clean power, by using more renewable technologies and supporting greater energy conservation. WWF-UK is calling upon power companies and the UK government to achieve 60% reductions in CO2 emissions from the
UK’s power sector by 2020.
The aim of this report is to provide a clear understanding of how the major UK power companies rank in relation to each other, in terms of achieving these objectives and assessing their contribution to climate change efforts by reducing their emissions. This will help WWF-UK identify the areas where it would be most important for each power company to change practices and the areas where it would be easiest to bring about any necessary changes.
Methodology
Research Process
The first stage of detailed data research was based on publicly disclosed information by the UK power companies. This included the review of all corporate greenhouse gas emissions data, governmental databases covering emissions reduction compliance, anecdotal evidence obtained from various media and a variety of business search engines and, on occasion, research by NGOs.
The second stage involved interviews with senior company executives to supplement publicly disclosed information. Innovest used standard interviewing protocols supported by questionnaires, agreed with WWF. The benchmarking results presented in this report assess individual company performance according to three main areas of analysis, termed research ‘clusters’, as well as to a number of individual variables/criteria contained within these overall clusters:
• CO2 policy and emissions reductions improvements 2
;
• Renewable energy programmes, capacity procurement for new renewables, ongoing renewable asset construction and present output; and
• Energy efficiency/demand-side management measures implemented under the UK Energy Efficiency program (energy services inclusive).
Each of these clusters comprises a number of criteria/variables, as described in more detail in Appendix I. In summary, all companies except British Energy are ranked with respect to their carbon risk profile and performance. Rankings were based on:
• CO2 emissions per unit of electricity production
• Total CO2 emissions output
• Improvements in CO2 emissions reductions over time
• Progress on complying with the UK’s Energy Efficiency (EE) targets for the residential customer sector (including provision of energy services)
• Progress on developing/selling renewable energy (RE) to their customers (where Innovest looked at procured renewables capacity)
Innovest did not rank British Energy due to insufficient information disseminated by that company and because of the incompatibility of nuclear energy assets with the generation base of other companies surveyed. A detailed qualitative review of British Energy’s carbon profile is presented in Appendix II to this report. Ranking system
Innovest has developed a carbon-profiling database which enables comparisons of management strategy and emissions profiles to be made among companies on a consistent, systematic basis using the proprietary Carbon Value '21TM platform. The database contains a series of variables to assess climate change performance. These variables are weighted according to their importance within particular sectors and they are scored to provide ranking data. Scores range from 0-10 for each company for each variable. A score of 10 represents the best score a company could obtain relative to the performance of its peers (please refer to Appendix I to this report for a detailed discussion of the methodology employed by Innovest, as well as a list of the variables, weightings used and rationale behind them).
All variables and weights were reviewed externally to provide an independent level of assurance for the ranking process. In addition, using qualitative management information in tandem with estimated actual and projected emissions performance data, Innovest’s carbon ranking methodology was specifically adjusted to meet WWF-UK information requests to offer a complete assessment of corporate greenhouse gas risk management and performance. Innovest also analysed and ranked any information that was reported in a highly compatible manner, such as RO compliance, EE target compliance, volume of renewable energy investments, etc.
Eliminating bias
The qualitative and quantitative data sets were analysed separately to ensure that like for like variables were assessed. In other words, rankings for emissions, for example, are based solely on quantitative data and would not include any Innovest evaluations of greenhouse gas policies. Ranking of policy approaches would, similarly, be based solely on qualitative assessments of policy and related statements. Innovest used data that was publicly available and comparable across companies to generate the sector rankings.
Due to differing use of key performance indicators (KPIs) and a lack of disclosure by some companies, together with a mixed level of company responses to the WWF campaign - in terms of number of interviews granted - Innovest has provided rankings based exclusively on data that could be verified through external governmental agencies, such as DEFRA and Ofgem. This approach ensures consistency and comparability of results.
In terms of differentiating between companies that are suppliers and generators, all companies in the sample have power generating assets: for instance, Centrica does have some generating facilities; these are listed in the company's profile.
Further, the large range of variables Innovest considered in the course of ranking ensures a balanced review of the company's carbon risk exposure irrespective of whether it is primarily a generator or a supplier. For instance, we looked at a variety of renewable energy development indicators, including RO performance and green tariffs, which could be implemented by both types of the companies.
If Innovest had differentiated between suppliers and generators, we would not have had a basis for comparison because only Centrica is not primarily a generator - all other companies in this small sample are.
Survey Results
Overall Findings
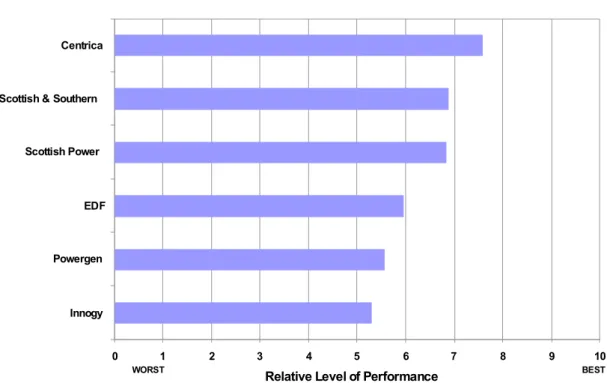
Centrica stood out as the overall leader in terms of its CO2 emissions profile and emissions reduction
achievements, energy efficiency target compliance and development of renewable energy assets. Scottish & Southern Energy (SSE) and Scottish Power (SP) were also found to be above average performers. Innogy
(currently RWE-npower), Powergen (currently E.ON-UK) and EDF (currently EDF Energy) were found to fall below the average score with respect to their carbon risk management performance.
In summary (Figure 1) while a few companies are doing better than others, all power companies could do more to improve their CO2 emissions performance.
Combined 'Stop Climate Chaos!' Campaign Score
0 1 2 3 4 5 6 7 8 9 10
Innogy Powergen EDF Scottish Power Scottish & Southern Centrica
Relative Level of Performance
WORST BEST
Figure 1: Cumulative Ranking
Centrica, Scottish & Southern Energy and Scottish Power demonstrate an above-average performance, but this barely exceeded the average score. Innovest observed low variance in corporate performance because all power producer actions are regulated in all domains of renewable energy production, consumer energy efficiency initiatives and/or direct CO2 emissions reduction protocols.
Innovest observed that recent changes in power company ownership – as applied to Powergen, Innogy and EDF – correspond to lower-than-average CO2 risk management performance. The lower-than-average
performance may be partially explained by the fact that the ownership change did not permit these companies to fully develop and integrate their carbon risk strategies across the spectrum of renewable energy, energy efficiency and emissions trading obligations.
The 2000-2004 CO2 risk management performance
3 is highly mixed for all power generators (except
Centrica), depending on whether research considers their renewable energy investment profile, energy efficiency achievements or specific greenhouse gas programs. For example, SP and SSE both have highly
competitive positions with regard to renewable energy generation / new asset procurement, but SSE showed better performance with respect to the long-term reduction (2000-2004) in its CO2 emissions. At the same
time, SP demonstrated significant progress in alleviating persistent problems with its two coal power plants -previously deemed the most CO2-intensive in the nation.
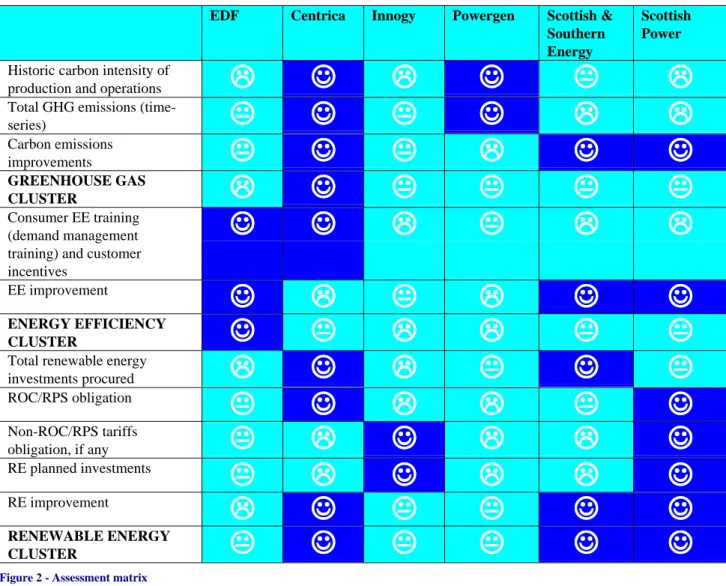
The following summary table classifies all UK companies investigated in this research according to each company’s performance in relation to each of the assessment criteria used. Centrica, Scottish Power and Scottish & Southern Energy occupy top tier positions (i.e. received the highest scores in the sample) for many of the variables, hence their top half rankings overall (see figure 1 above).
EDF Centrica Innogy Powergen Scottish & Southern Energy
Scottish Power
Historic carbon intensity of
production and operations
!
!
!
!
☺
☺
☺
☺
!
!
!
!
☺
☺
☺
☺
#
#
#
#
!
!
!
!
Total GHG emissions
(time-series)
#
#
#
#
☺
☺
☺
☺
#
#
#
#
☺
☺
☺
☺
!
!
!
!
!
!
!
!
Carbon emissions improvements#
#
#
#
☺
☺
☺
☺
#
#
#
#
!
!
!
!
☺
☺
☺
☺
☺
☺
☺
☺
GREENHOUSE GAS CLUSTER!
!
!
!
☺
☺
☺
☺
#
#
#
#
#
#
#
#
#
#
#
#
#
#
#
#
Consumer EE training (demand management training) and customer incentives☺
☺
☺
☺
☺
☺
☺
☺
!
!
!
!
#
#
#
#
!
!
!
!
!
!
!
!
EE improvement☺
☺
☺
☺
!
!
!
!
#
#
#
#
!
!
!
!
☺
☺
☺
☺
☺
☺
☺
☺
ENERGY EFFICIENCY CLUSTER☺
☺
☺
☺
#
#
#
#
!
!
!
!
!
!
!
!
#
#
#
#
#
#
#
#
Total renewable energy
investments procured
!
!
!
!
☺
☺
☺
☺
!
!
!
!
#
#
#
#
☺
☺
☺
☺
#
#
#
#
ROC/RPS obligation#
#
#
#
☺
☺
☺
☺
!
!
!
!
!
!
!
!
#
#
#
#
☺
☺
☺
☺
Non-ROC/RPS tariffs obligation, if any#
#
#
#
!
!
!
!
☺
☺
☺
☺
!
!
!
!
!
!
!
!
☺
☺
☺
☺
RE planned investments#
#
#
#
!
!
!
!
☺
☺
☺
☺
!
!
!
!
!
!
!
!
☺
☺
☺
☺
RE improvement!
!
!
!
☺
☺
☺
☺
#
#
#
#
#
#
#
#
☺
☺
☺
☺
☺
☺
☺
☺
RENEWABLE ENERGY CLUSTER#
#
#
#
☺
☺
☺
☺
#
#
#
#
#
#
#
#
☺
☺
☺
☺
☺
☺
☺
☺
Figure 2 - Assessment matrix☺ Top tier
# Middle Tier
! Bottom tier
To fully assess the intricacies of individual corporate performance more detailed company profiles are contained in Appendix II.
Individual company performance
Top overall ranking
Centrica was the only clear-cut CO2 risk management leader. Following Centrica, ranked first, the relative
performance of the other companies in our sample is ranked as follows:
Second overall
Scottish & Southern Energy exhibited long-term improvement in reducing CO2 emissions from power
generation as well as in managing the carbon emissions related to its electricity production. The company has also earned high marks for the significant scale of development of new renewable energy projects and the structure of its renewable energy policy.
This ranking should be viewed in the context of the relatively weak performance of SSE with regard to the overall 1998-2004 volume of CO2 emissions from power generation (SSE was classed as ‘worst in the
sample’). SSE appears to be on the right-track with regard to managing this risk.
However, due to the company’s decision not to participate in the Stop Climate Chaos! interview, Innovest cannot fully assess the potential of specific carbon emissions reduction policies planned / implemented by SSE.
Third overall
Scottish Power has also shown significant improvement in CO2 emissions, where the company assumes the
second place (after Centrica) in our ranking of corporate ability to improve the power generation emissions profile. The company still ranks at the bottom of the sample in terms of the carbon intensity of electricity generation and therefore, the current level of progress in reducing emissions needs to be accelerated.
Scottish Power also received high scores for its energy efficiency programs (relative to the UK government’s Energy Efficiency Commitment (EEC) target), for its progress on the Renewables Obligation, green-tariff implementation and renewable energy policy. Similar to SSE, Scottish Power has made this progress relative to the comparatively high carbon intensity of its power generation business and large volumes of long-term, historic CO2 emissions.
Fourth overall
EDF is a laggard with respect to CO2 emissions improvements, but the company earned top ranking for its
energy efficiency achievements relative to Ofgem’s Energy Efficiency Targets and energy service provision to customers. EDF also runs a large-scale ‘green tariff’ program with 13,000 subscriptions reported for 2003, which enhanced the company’s performance with respect to its renewable energy profile, where EDF is positioned in the middle to upper ranking tier.
Fifth overall
Powergen has shown very little long-term (1998-2004) improvement in its CO2 emissions, although,
considering the large size of its generation business, Powergen does not emit a large, absolute volume of carbon dioxide emissions. Powergen is ranked in the medium tier both in terms of its efforts to procure, construct and operate new renewable energy facilities, while the company is ranked the ‘worst in class’ with respect to progress against energy efficiency commitments.
As this report went to press E.ON launched its first corporate social responsibility (CSR) report at group level. E.ON has almost completed its transformation into a clearly focused energy group and can now address a central issue, which was previously dealt with separately in various markets and business units: the design of a comprehensive strategy for E.ON's sustainable development. The first step towards this objective is the report "Energy - Efficiency - Engagement", which provides a snapshot of the status quo within the group and documents specifically where it stands now, while at the same time exploring future opportunities and directions.
The E.ON vision of corporate responsibility encompasses activities to protect the environment, which include the development of new technologies for large-scale or distributed generation as well as for renewable-source electricity. E.ON is also an active company in the regions where it does business and plays a role in the economic development and in structural change in the communities where facilities are located. Support for youth initiatives, education programs, non-profit organizations, foundations, culture, and the arts is a part of its corporate culture.
The efficiency of the generating facilities has consistently been improved. Since 1990 E.ON has reduced the specific CO2 emissions of its generating fleet by 22%. In Europe the figure is an even more impressive 32%.
Any campaign work undertaken by WWF following publication of this survey of UK power companies will take into account relevant disclosures in the E.ON report, it should be noted that the company declined to participate in an interview or give notice that its CSR report was due to be published.
Bottom overall ranking
Innogy has a medium-to-low performance with respect to reducing its carbon emissions. Innogy is ranked ‘worst in class’ with regards to the historical carbon emissions related to its electricity generation. This represents a serious carbon management risk, which the company has to address rather aggressively.
At the same time, with respect to renewable energy development, Innogy stands out for a large-scale green tariff program (the largest and most encompassing in the nation), where the company is ranked ‘best in class’. Innogy also ranked low on performance against renewable and energy efficiency policies and programs. At the same time, as for Powergen, the company has changed ownership and meaningful analysis of its carbon risk management is not feasible until the completion of the first short-term investment cycle under the new owner in 2005-2006.
The remainder of RE and EEC policies and programs placed in the middle- to lower-middle tier, where Innogy consistently earned the ‘first below average rank’ (or the ‘third worst’) on four indicators measuring its performance.
British Energy
British Energy Group’s main activities are electricity generation, sales and trading. The company has the following subsidiaries:
• British Energy Generation Limited (England and Wales);
• British Energy Generation Limited (Scotland);
• Eggborough Power Limited.
These three subsidiaries are focused on the generation and sale of electricity. In addition there is British Energy Power & Energy Trading Limited. This subsidiary is responsible for energy trading and managing exposure to energy prices. The company holds an interest of more than 10% in United Kingdom Nirex Limited which is focused on the disposal of nuclear waste.
British Energy generates around 20% of the electricity in the UK at present. The total output produced by British Energy’s power stations during the year ending March 31, 2004 was 72.6 TWh. Approximately 89.5% of this output (65.0 TWh) was produced by nuclear power stations and 10.5% (7.6 TWh) by the coal-fired power station at Eggborough.
As the majority of British Energy Group’s assets are comprised of nuclear energy, the company does not have a compatible position with regard to a GHG emissions profile and/or renewable energy targets. The only meaningful environmental liability disclosed by British Energy Group relates to radiological discharges and radioactive waste material which, according to the company’s publications, remained well within required public norms.
British Energy Group does implement a comprehensive environmental management system. All power plants are certified ISO 14001. In addition, the company implements initiatives related to biodiversity, land use and safeguarding resources. According to the company’s website, British Energy Group is committed to continuous.
With regard to the company’s involvement in greenhouse gas emissions management, as with all British utility companies, British Energy Group has chosen to engage in renewable asset development. In a joint venture with AMEC, a 234 turbine wind farm with a capacity of 702 MW is planned.
British Energy Group’s nuclear power stations have not been subject to prosecution for exceeding authorized discharge limits for the disposal of radioactive waste; however, the company was prosecuted in January 2003 due to unauthorized discharges in October 2001 at Torness and there was a leak from Thorpe plant in Cumbria reported in May 2005. Whilst a fine of £15,000 was imposed following the incident at Torness, this appears to be an isolated event and is not considered indicative of systematic weaknesses.
Furthermore, in 2002, British Energy (BE), the publicly listed UK nuclear generator, was given a huge state subsidy handout of at least £3 billion (US$4.6 billion) from the UK government to help with their financial crisis with subsidies spreading over the next ten years.
2. Introduction
2.1 WWF and Stop Climate Chaos!
WWF is a leading international conservation organisation, working for the protection of the natural environment. Climate change, which could have devastating impacts on people and wildlife, forms one of the key areas of WWF’s work. As well as helping vulnerable communities around the world adapt to climate change, WWF aims to tackle the cause of climate change - by campaigning to significantly reduce greenhouse gas emissions.
The power sector is the largest single source of CO2 emissions globally as well as in the UK, where it is responsible for a third of emissions. WWF considers that significant reductions in emissions are necessary if the UK is going to meet current domestic targets and aspirations for combating climate change. It is this industry upon which much of WWF’s policy and campaign work will focus with regard to climate change mitigation.
WWF-UK has launched a major new campaign called Stop Climate Chaos! which is lobbying power companies and the UK government to achieve 60% reductions in CO2 emissions from the country’s power
sector by 2020. Through the campaign WWF aims to engage with and encourage all stakeholders - energy utilities (i.e. power companies), financial institutions, the government and consumers - to make the switch from fossil fuel to clean power, by using more renewable technologies and supporting greater energy conservation. WWF is calling upon.power companies to become ‘Pioneers’ (please refer to the Glossary in Appendix I to this report for a description of Pioneer companies).
2.2 Purpose of this report
In order to engage with and negotiate with the UK power sector successfully and effectively as a way to achieve emissions reductions, WWF-UK has commissioned this report to obtain detailed information on the policies and performance of all the main UK power companies, and on the UK power sector as a whole.
The aim of this report is to provide a clear understanding of how the different UK power companies rank in relation to each other and to assess their contribution to climate change mitigation. The results of this research will enable WWF-UK to better understand each company’s energy generation and supply mix, investment decisions, policies and activities - now and in future - in the context of their contributions to greenhouse gas emissions in the UK, and to climate change.
Hence, this report will help WWF-UK identify the area(s) where it would be most important for each power company to change practices and the area(s) where it would be easiest to bring about necessary changes.
2.3 UK Power Sector and the UK Climate Change Programme (CCP) and Review (CCPR) 2.3.1 Overview
The UK power sector contributes between 1-2% of the UK's gross domestic product (GDP), producing and supplying electricity to over 26 million customers. However, the UK power sector is responsible for a staggering ~30% (almost one third) of UK CO2 emissions in total. Its development since privatisation in 1990
has been extensive due to the introduction of a competitive, liberalised market. The monopoly transmission and distribution businesses (in England & Wales) are now separate from generators and suppliers.
The development of the competitive market means that there are now about 40 'major' producers, which has led to a reduction in market share held by the formerly dominant Innogy. The switch in fuel sources used for power generation has been mirrored by changes in plant ownership and new companies joining the market. Under the wholesale trading arrangements introduced in 2001, bulk electricity is bought and sold between generators and suppliers through bilateral contracts and on power exchanges.
This growth in the number of power companies has coincided with the expansion of gas-fired generation. This has resulted in a more balanced spread between coal-fired, gas and nuclear capacity and offered a small but significant role for other types of generation, including renewables, particularly given the political support
for the former Non-fossil Fuel Obligation, now the Renewables Obligation (see below – ‘Environmental Regulations’).
Under its Environmental Action Plan (EAP), Ofgem is seeking to play an effective role in informing the wider debate and decisions on how to meet environmental targets. The plan also sets out Ofgem's programme of work on meeting its environmental commitments. This includes its delivery of a number of schemes on behalf of government to help promote renewable energy and energy efficiency (see below). Ofgem has several executive functions in relation to electricity generated from renewable sources. Ofgem is also working on encouraging electricity distribution companies to strengthen their networks to allow for more distributed generation. The development of distributed generation has an important part to play in meeting the government's long-term environmental targets.
2.3.2 Generation
Gas-fired power stations are cheaper and quicker to build than their coal-fired predecessors and produce relatively fewer pollutants (gas-fired power stations emit much less CO2 for the same amount of electricity
produced). Even compared to the cleanest coal power station, gas power stations produce half of the emissions and large renewables such as wind and biomass produce virtually no emissions.
From a 2% share in 1992, by the end of the 1990s gas-burning generation had overtaken coal as the major fuel source, known as the ‘Dash for Gas’. Gas, coal and nuclear are the main sources of fuel used in power stations across the UK. The table below shows the breakdown of the fuels used to generate electricity in the UK in 2003.
Fuel Used Output (2003)
Coal 35% Nuclear 22% Gas 38% Oil 1% Imports 1% Other fuels 3% Hydro 1%
Figure 3 - Fuel-use in electricity generation, 2003
Source: Digest of UK Energy Statistics, DTI, 2004
Existing hydro-electric capacity, much of it dating from the 1950s, represents the largest contribution from renewable resources, although UK and EU environmental targets require an expansion in 'green' power including wind and other zero-carbon forms of renewable energy as well as carbon-neutral energy such as biomass. There is a new and rapidly growing market for renewable energy technologies and services in Europe and beyond. There are over 700 UK companies involved in renewable energy, from research bodies and consultants to manufacturers and developers. The majority are SMEs and they face considerable barriers to developing their market, in terms of staff and financial resources. British renewable energy exports have risen from an historic level of £10-15 million in the early 90s to around £80-100 million per annum in the last two years.
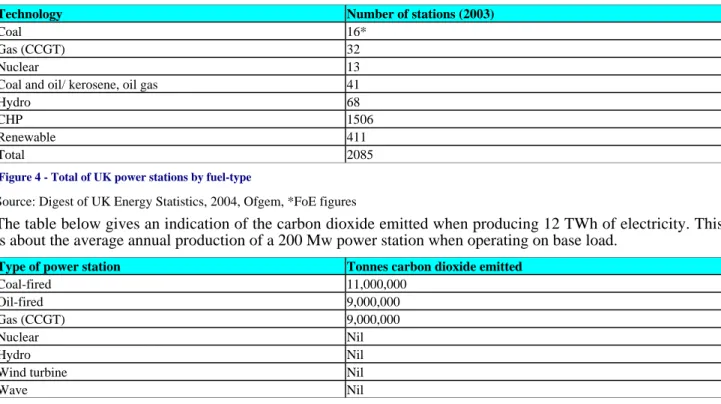
There are in excess of 2,000 generating stations in the UK. The table below shows the technologies and fuels used in these different types of power stations. The majority of the generating capacity is derived from coal, gas and nuclear energy. A large number of generating stations use renewable fuels such as hydro, wind, landfill gas, wastes and biomass and combined heat and power stations. But these stations tend to be much smaller than conventional thermal plants so although their total number is greater than that of conventional thermal stations their combined capacity is much smaller.
Technology Number of stations (2003)
Coal 16*
Gas (CCGT) 32
Nuclear 13
Coal and oil/ kerosene, oil gas 41
Hydro 68
CHP 1506
Renewable 411
Total 2085
Figure 4 - Total of UK power stations by fuel-type
Source: Digest of UK Energy Statistics, 2004, Ofgem, *FoE figures
The table below gives an indication of the carbon dioxide emitted when producing 12 TWh of electricity. This is about the average annual production of a 200 Mw power station when operating on base load.
Type of power station Tonnes carbon dioxide emitted
Coal-fired 11,000,000
Oil-fired 9,000,000
Gas (CCGT) 9,000,000
Nuclear Nil
Hydro Nil
Wind turbine Nil
Wave Nil
Figure 5 - Power Station Emissions
Source: Institute of Electrical Engineers, 2003
Combined heat and power (CHP) schemes also have targets for expansion because of their efficient conversion of fuel (usually gas) into electricity and useful heat. Many renewable and CHP schemes are 'embedded' in regional distribution networks rather than exporting their power into the grid.
Distributed generation (also known as embedded or dispersed generation) is electricity generation connected to a distribution network rather than the high voltage transmission network. Distributed generators are mainly, though not exclusively, those generating power from renewable energy sources (including small hydro, wind and solar power) or from combined heat and power (CHP) plants.
The government has set several targets to meet its obligations under the Kyoto Protocol. The UK aims to generate 15% of UK electricity supplies from renewable sources by 2015 (i.e. the UK Renewables Obligation) and to develop 10,000MWe of installed good quality CHP capacity, by 2010 and now 15.4% by 2015. Meeting these targets will involve adding some 8000MW of renewable capacity; and 5,500MWe of CHP capacity to the network.
However, it appears the government is unlikely to meet targets to tackle climate change, following publication of new provisional data showing that carbon dioxide emissions have again increased in 2004. The effect of two consecutive increases means the UK is now close to exceeding its Kyoto target for carbon dioxide emissions and a long way short of meeting its domestic target of reducing emissions of carbon dioxide by 20% below 1990 levels by 2010.
The increase of 1.5% is as a result from increasing emissions from industry, the domestic sector and transport. The UK's legally binding Kyoto target is to reduce emissions of the six greenhouse gases to 12.5% below 1990 levels by 2008-12. The UK achieved this in 1999 and has been comfortably below it since, but latest projections now show UK emissions for 2004 are estimated to be only 12.6% below 1990 levels. In 2002 they were 14.4% below 1990 levels.
The government may now need to introduce a radical new climate change programme to reverse this trend and achieve a 16% reduction in carbon dioxide emissions between now and 2010 to meet both its targets.
2.3.3 Supply
Supply is the term used to describe the retail activity where providers compete for customers. Domestic customers account for over 90% of the UK market in terms of number of accounts. Where sales volumes are concerned the division between the domestic and other sectors is more evenly split. In 2000, the domestic sector accounted for 36% of electricity sales, the industrial sector for 32% and the service sector for 31%. Agriculture accounted for the remaining 1%.
The introduction of competition in supply was phased in over eight years because of the size of the task and the technical complexities involved. The last and by far the largest transition phase comprised about 26 million domestic and small business customers, and the market was progressively opened between September 1998 and May 1999. Nearly 40% of these customers switched supplier at least once in the following two years. Switching currently takes place at a rate of about 100,000 per week equating to over 5 million customers per year.
As the competitive market matures, so does familiarity with different suppliers, although nearly 20% of customers questioned are still only able to name a single supplier (source: Electricity Association). Nearly 30 suppliers are licensed to operate in the domestic/small business market, although not all are active.
Mergers and restructuring have created branding confusion in some areas, and marketing alliances with well known organisations outside the electricity industry have proved less successful than expected. Product bundling and the marketing of home services is one way companies are aiming to retain customer loyalty and reduce 'churn' rates (rate of customer loss).
Price remains the main reason for switching supply, despite the fact that UK electricity prices have been consistently among the lowest in the EU, and the ability to receive electricity and gas from the same source rates as the second in priority. The UK Regulatory body Ofgem has estimated that 30% of all electricity customers are now on dual-fuel deals. Against this scenario educating consumers about switching or receiving supply on the basis of environmental benefits is a challenge.
2.3.4 Distribution losses
Distribution losses are the amount of electricity that is lost (as heat) on the distribution networks as it travels down wires and transformers. Around 7% of electricity distributed in Great Britain is lost in this way. CO2
emissions from UK electricity generation amount to 147 million tonnes per year.
By reducing losses from 7% to 6%, carbon dioxide emissions could be cut by 750,000 tonnes of carbon; equivalent to the emissions from a medium sized gas powered (CCGT) generator. This would contribute 4% of the reduction in carbon emissions required by the Kyoto protocol.
2.4 Environmental Regulations 2.4.1 UK Climate Change Programme
This programme comprises a range of measures that affect the UK power sector along with other energy-related sectors such as oil production and refining, gas production and transmission, the production of coal and other solid fuels, as well as many other industries.
2.4.1.1 Timeline of the UK CCP
November 2000 – UK government announcement of the UK Climate Change Programme (CCP) as a package
of measures to deliver the Kyoto target. The CCP detailed how the UK plans to deliver its Kyoto target to cut its greenhouse gas emissions by 12.5%, and move towards its domestic goal to cut carbon dioxide emissions
• renewable energy provision – RO (to meet 15% of electricity demand by 2015);
• UK emissions trading scheme.
Renewables Obligation (RO) - The Utilities Act 2000 introduced new powers to promote generation of electricity from renewable sources, known as the Renewables Obligation. The Renewables Obligation is an obligation on licensed electricity suppliers to provide a specified proportion of electricity from renewable sources. Suppliers can meet their obligation through producing Renewables Obligation Certificates (ROCs) and/or by paying buy-out. Ofgem’s responsibilities include the accreditation of eligible renewable generating stations, the issue of ROCs and assessing supplier compliance.The Electricity Act provides for the Non Fossil Fuel Obligation (NFFO) and the Scottish Renewable Obligation (SRO) which were used to promote the development of renewable energy technologies before the introduction of the Renewables Obligation, and will continue until 2018.
Climate Change Levy (CCL) exemption for renewables - The Finance Act 2000 provides for electricity from renewable sources to be exempt from the Climate Change Levy.
REGOs - EU Directive 2001/77/EC aims to promote an increase in the contribution of renewable energy sources to electricity production in Member States. Article 5 of the Directive requires that Member States ensure that a Guarantee of Origin is issued, on request, in respect of electricity produced from renewable energy sources.
April 2002 – UK Emissions Trading Scheme (UK ETS) established. This is a voluntary scheme with
emissions reductions measured against a 1998-2000 base-line. Emissions or energy targets can be set through Climate Change Agreements (CCAs). While the power generation sector made an important contribution to formulating the UK ETS, generators were excluded from the scheme.
February 2003 – the UK government published an Energy White Paper (EWP) setting out four main goals,
including a longer term target to reduce CO2 emissions by 60% by 2050 (in line with figures put forward by
the Royal Commission for Environmental Pollution (RCEP)).
December 2003 – the UK government announced that it intends to increase targets in the Renewables
Obligation to 15% by 2015. The Renewables Obligation (effective April 2002, with amendment effective April 2004) is the main instrument for reaching the 10% target by 2010. The Energy White Paper set out the ambition of doubling the share of electricity generation from renewables provided for in the 2010 target by 2020.
December 2004 – the government launched a consultation on the review of the CCP. The new CCP (due to be
published in Autumn 2005) will set out the approach the UK is taking to reduce GHG (including CO2)
emissions across six broad sectors of the UK economy, including energy supply/power sector). 2.4.2 Energy Efficiency
The UK government’s proposals for the next stage of the Energy Efficiency Commitment (EEC) were put before Parliament in November 2004 to allow for the scheme to begin in Spring 2005. The government proposes that the next phase of the EEC – to run from April 2005 to 2008 and then 2008 to 2011 – should be at about twice the level of the current EEC. Use of cavity wall and loft insulation, energy efficient boilers, appliances and light bulbs form part of the EEC. The EEC Order sets the target for the period 2005-08 and is expected to deliver about 0.7MtC in cuts per annum by 2010. The target for the second period, 2008-11, will be set in 2007.
The draft Order now before Parliament also includes incentives for energy services and supports the development of innovative products, such as micro CHP. The UK EEC is a legal obligation upon energy suppliers and the costs fall upon them. Suppliers may pass some of these costs onto their customers, but the impact on energy prices should be outweighed by the benefits of the EEC.
2.5 The EU ETS and the UK National Allocation Plan (NAP)
The EU Emissions Trading Scheme (EU ETS) is one of the policies being introduced across Europe to tackle emissions of carbon dioxide and other greenhouse gases, to combat the threats posed by climate change. The scheme commenced on 1 January 2005. The first phase runs from 2005-2007 and the second phase will run from 2008-2012.
The scheme will work on a ‘Cap and Trade’ basis. Each EU Member State government has to set an emissions cap for all installations covered by the scheme. Each installation is then to be allocated allowances for the relevant commitment period. The number of allowances allocated to each installation for any given period (the number of tradable allowances each installation will receive) is set down in each Member State’s NAP. The UK CCPR includes both EU ETS installations and sources which are not covered by the EU ETS.
2.5.1 EU-ETS Phase 1
The government has published a revised timetable to the Final Allocation Decision following discussions with the Commission on the amendments to the UK NAP proposed in November 2004. Member states must allocate allowances to installations by 28 February each year.
In October 2004, the UK government proposed to the Commission an amendment to the agreed July NAP increasing the total number of UK allowances for the first phase by 19.8 million allowances from 736.3 million to 756.1 million allowances (1 allowance is equivalent to 1 ton of CO2). This was an increase of less
than 3% from the number in the April 2004 plan. The Commission has rejected this proposal and it is now estimated that allowances for UK installations will stand and be issued in Spring 2005. Despite this original allocation, the UK has announced it will challenge the Commission decision before the European Court of Justice.
2.5.2 EU ETS Phase 2
In the CCPR (2005), the UK government says it is committed to its domestic goal of moving towards a 20% reduction in CO2 emissions below 1990 levels by 2010. The original goal was to achieve this target, but this is
now considered to be very unlikely, if not impossible on the basis of current policies and emissions trends. In determining the total quantity of allowances to be issued for the second phase from 2008 to 2012, the government will ensure that installations covered by the scheme make an appropriate contribution to that goal. This issue will be considered further in the review of the CCP.
2.5.2.1 Determination of allowances
Power stations are likely to be required to deliver additional emissions trading savings because this sector faces limited international competition and is thought to have a fairly good potential for low cost abatement opportunities. There will be opportunities for changing the relative utilisation of existing gas fired and coal fired power stations. Over time, the continued introduction of new gas-fired plant and retirement of older coal-fired plant could help reduce emissions.
The UK is applying to exclude some installations that are covered by the UK ETS from the first phase of the EU ETS, or by CCAs. Separate applications are being made for installations covered by these domestic schemes, reflecting the difference between the two schemes. The applications detail the basis on which equivalence of environmental effect, monitoring, reporting and verification requirements and the penalties for non-compliance can be demonstrated.
Financial impacts from climate change include changes in weather patterns, political and regulatory momentum moving against significant carbon emitters; the development of emissions-sensitive technologies, products and services superseding those existing today; and shifts in consumer sentiment linked to a corporation’s stance on climate change.
This makes it necessary for investors to improve their understanding of climate change risks and opportunities. In response to these risks, a number of initiatives have been launched by financial sector. In February 2005 for example, a group of 143 institutional investors with assets of US$20 trillion under management wrote to the 500 largest quoted companies in the world by market capitalisation, asking for the disclosure of investment-relevant information concerning their greenhouse gas emissions. This is the third time such a request has been made (see www.cdproject.net).
Similar initiatives include the UK-based Institutional Investor Group on Climate Change. Members consist of both mainstream and SRI investors. This group has commissioned research into the financial impact of climate change across a range of sectors, particularly aviation and power Generation (late 2003) and co-hosted the Institutional Investor Conference on Climate Change in November 2003 which was sponsored by the Carbon Trust. The Carbon Trust is an independent company funded by government. Its role is to help the UK move to a low carbon economy by helping business and the public sector reduce carbon emissions and capture the commercial opportunities of low carbon technologies.
So far as the investment banks are concerned, mainstream research coverage of climate change, and more specifically the EU ETS implications for the utilities industry, has been featured more prominently in the last one to two years. EU ETS impacts on individual utilities companies and power prices are generally understood. The EU ETS brings implications for a much wider portfolio of companies than just those in the utilities sector and it is likely that climate change will lead to financial implications for companies and investors through a broad assortment of sources than from the EU ETS and other existing/imminent trading schemes alone.
Beyond the utilities sector, though, coverage of the emissions trading / climate change implications for a broader assortment of industry sectors to date remains very limited.
3. Ranking Results
3.2.1. Greenhouse Gas Ranking Cluster
In this cluster of three variables, Innovest has chosen to rely on both corporate CO2 emissions disclosures and
on DEFRA’s National Allocation Plan (NAP) relevant CO2 emissions data for each company. The most
important criterion against which the companies were assessed is the Long-Term (1998-2004)4 Rate of CO2
Emissions Improvement from all power generation assets, CHP inclusive, followed by the Carbon Intensity of Electricity Production and by Cumulative Long-Term CO2 Emissions (1998-2004). Corporate greenhouse
gas policy/strategy assessment is presented individually for each company in Appendix II to this report due to the highly qualitative nature of the information the UK utilities have chosen to disclose on this variable.
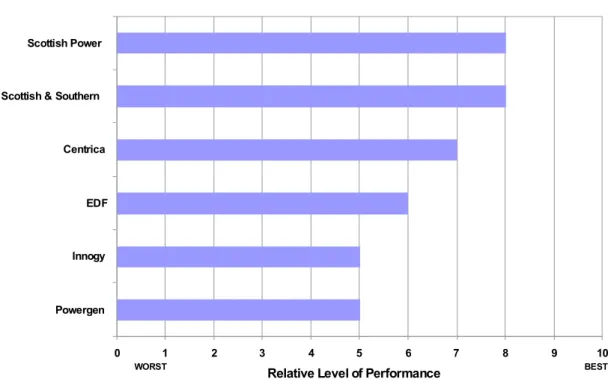
3.2.1.1 CO2 Emissions Improvement 1998 - 2004
Innovest has undertaken a long-term (1998-2004) review of the power generators’ CO2 emissions
improvement to identify the companies with the heaviest carbon risk management risk, the ‘risk’ defined as a lack of progress in reducing CO2 emissions from power generation. Looking at the long-term rate of carbon
emissions improvement, Figure 3 below illustrates that since 1998 (the baseline) Centrica, Scottish Power and Scottish & Southern Energy have achieved the largest reduction in their carbon emissions from power generation. Therefore, their power generation strategies are considered less ‘risky’ with regard to carbon emissions:
Carbon emissions improvements
0 1 2 3 4 5 6 7 8 9 10
Powergen EDF Innogy Scottish & Southern
Scottish Power Centrica
Relative Level of Performance
WORST BEST
At the same time, it should be noted that every one of these entities has undergone ownership change in the period covered by this analysis. Therefore, lower-than-average performance may be partially attributed to the differences in owners’ carbon management strategies and asset investment preferences. As a result, Innovest’s ranking of these companies should be regarded as a signal for the need to either change both short-term and long-term asset investment/management priorities or to actively seek certain forms of carbon risk ‘insurance’ to guarantee EU ETS compliance under the UK NAP emissions limits allocated to these three companies.5
3.2.1.2 Carbon Intensity
This metric refers to the quantity of CO2 equivalent emissions produced per unit of electricity generated.
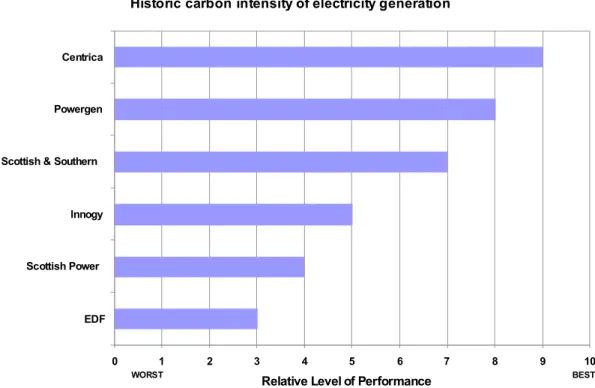
Centrica, Powergen and Scottish and Southern Energy at the top of Innovest’s ranking with respect to the carbon intensity of electricity production over the selected three-year period (in MTCO2e/TWh).
Historic carbon intensity of electricity generation
0 1 2 3 4 5 6 7 8 9 10
EDF Scottish Power
Innogy Scottish & Southern
Powergen Centrica
Relative Level of Performance
WORST BEST
Figure 7 - Carbon Intensity of Electricity Production 2002 – 2004
Since carbon emissions intensity depends both on the fuel type and on the technology used in electricity production, the above data illustrate that it would be prudent for Innogy, Scottish Power and EDF to focus their long-term asset investment on more carbon neutral power generation technologies since companies cannot change ‘at will’ the regional fuel mix powering their electricity production.
3.2.1.3 Cumulative Long-Term CO2 Emissions (1998- 2004)
1998-2004 CO2 emissions show the individual companies’ aggregate emissions contribution to the total pool
of national CO2 emissions. This measure is reported to demonstrate the comparative political weight of each
electric power producer in national GHG policy negotiation because, in the National Allocation Plan (NAP),
5 Such insurance may take the form of large-scale CDM investment because CERS are recognized as tradable commodities before the First Kyoto Commitment Period.
the distribution of UK carbon allowances is determined by the ‘relevant carbon emissions’ of each respective company.
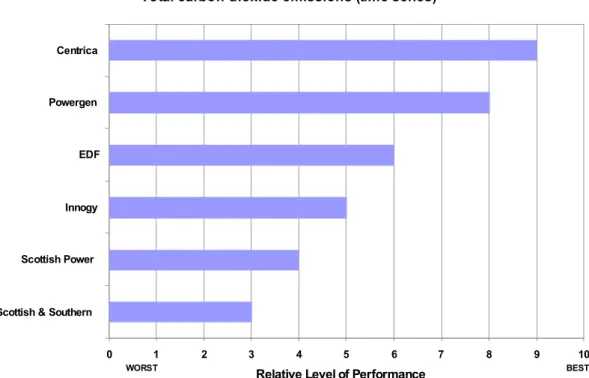
The companies with the largest volume of carbon emissions within the specified period (Scottish & Southern Energy and Scottish Power) received the lowest score, while Centrica comes out again as a top performer with the lowest amount of carbon emissions:
Total carbon dioxide emissions (time-series)
0 1 2 3 4 5 6 7 8 9 10
Scottish & Southern Scottish Power Innogy
EDF Powergen Centrica
Relative Level of Performance
WORST BEST
Figure 8 - Cumulative Long-Term Carbon Dioxide Emissions
As a result, Scottish & Southern Energy and Scottish Power represent the largest ‘aggregate emitters in the UK for the specified years irrespective of their power output. Both companies, however, also demonstrated significant improvements in their carbon emissions profiles.
Therefore, Scottish & Southern Energy and Scottish Power could be designated as the primary focus of the WWF Stop Climate Chaos! Campaign on the basis of the analysis of their carbon emissions profiles, while Centrica would be identified as the Campaign ‘leader’.
3.2.2
Energy Efficiency Ranking ClusterLooking at energy efficiency criteria, Innovest has benchmarked corporate performance with respect to compliance with the UK Energy Efficiency Commitment (EEC), investment in residential energy-efficiency (demand-side management) schemes, development of new energy-efficient technologies and the extent of household energy saving service provision.
It is important to stress that the EEC targets include provision of energy services (among other initiatives). For example, actions recommended under the EEC include wall cavity insulation, delivery/installation of low-energy lamps, installation and management of various heating and appliance measures reducing low-energy consumption (DEFRA, July 2004).6
Hence, Innovest’s first score encompasses all corporate actions classified by DEFRA as ‘energy service provision’ whenever such actions were reported by the companies under consideration and/or by DEFRA.
3.2.2.1 Consumer education / Electricity Demand Management (Energy Services)
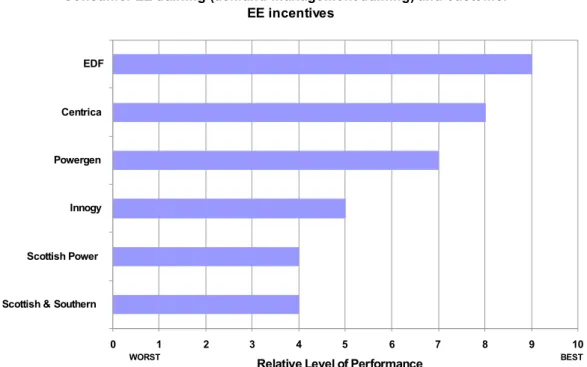
With respect to this variable, EDF and Centrica were found to be the leaders, followed by Powergen:
Consumer EE training (demand management training) and customer EE incentives
0 1 2 3 4 5 6 7 8 9 10
Scottish & Southern Scottish Power Innogy Powergen Centrica EDF
Relative Level of Performance
WORST BEST
Figure 9 - Consumer EE Training and Incentives and Energy Services
Figure 9 shows that EDF and Centrica lead the UK power sector in energy service provision. Scottish Power (SP) and Scottish & Southern Energy (SSE) both received the lowest score signalling that these companies do not place a high priority in consumer energy efficiency measures (as will be discussed below, both SP and SSE scored higher on their renewable energy activities).
Given the lack of empirical studies comparing the importance of EEC relative to renewable energy measures, Innovest cannot recommend specific strategy/investment actions based on the observed EEC/energy services performance, but Centrica is again found to be in the top tier of corporate performers.
6 DEFRA. 2004. “A Review of the Energy Efficiency Commitment to the End of the Second Year; A Report for the Secretary of State for Environment, Food and Rural Affairs” (July 2004, Document, 178/04), p. iii)
3.2.2.2 Energy Efficiency/ Energy Services Improvement (2002-2004)
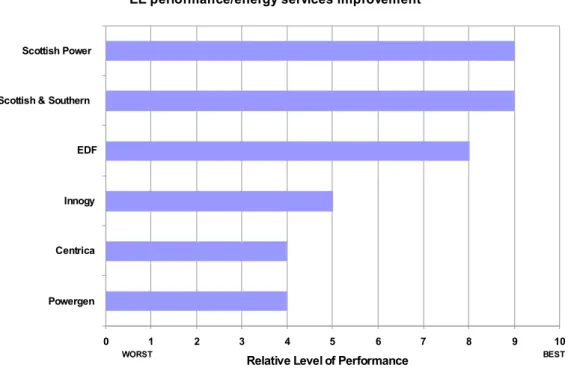
Figure 10 below portrays corporate ranking with respect to power sector performance improvement on energy service provision, as documented in the 2004 DEFRA report on the Energy Efficiency Commitment of the UK electricity providers.
Energy services are included in Innovest’s ranking of corporate performance related to customer training in the efficient use of energy. The highest degree of energy efficiency performance improvement for 2002-2004 was noted for Scottish & Southern Energy (SSE) and Scottish Power (SP), followed by EDF:
EE performance/energy services improvement
0 1 2 3 4 5 6 7 8 9 10
Powergen Centrica Innogy EDF Scottish & Southern
Scottish Power
Relative Level of Performance
WORST BEST
Figure 10 - Energy Efficiency/Energy Services Improvement
In assessing the overall energy efficiency improvement, Innovest looked at progress in achieving DEFRA’s Energy Efficiency Commitment (EEC) targets, at the number and size of accredited energy efficiency schemes and at the type and coverage of various energy efficiency/energy service activities.
However, the company’s record of achieving its EEC target is given the largest weight with regard to benchmarking companies on this particular variable.
3.2.3.
Renewable Energy Ranking ClusterThe final of the three main areas of analysis in this study showed the largest variance with respect to company performance. This happens because of the large number of variables employed in the renewable energy
• diversification into non-wind renewable/alternative energy technologies (such as solar, biofuel/biomass, wave energy, landfill gas, etc.);
• percentages of Renewables Obligation (RO) compliance achieved;
• percentages of RO compliance achieved through the purchase of ROCs and/or SROCs;
• the size and activity of ‘green tariffs’ (if applicable); and
• the integrity of the overall renewable energy policies/strategies.
Innovest considers that a wide range of renewable energy criteria used to benchmark companies better permits the capture of variance in performance indicators across the UK power sector. In addition, relative to CO2
strategy/policy disclosures and energy efficiency data - both of which were difficult to obtain from public sources without detailed interviews - all UK generators presented more detailed and more compatible information on their renewable energy activities due to the greater clarity of the national RO policies and their longer duration. This permitted Innovest to collect a greater volume of comparable and more reliable data without relying on company interviews.
3.2.3.1 Renewable Energy Capacity Improvement
Innovest contends that individual company performance improvement against the full spectrum of renewable energy investments, planned capacity and policies represents the most important proxy of the corporate ability to reduce its carbon emissions exposure. Innovest considered the data on RO/SRO compliance, information about planned renewable energy capacity and newly installed assets as well as investment data to create the composite 2002 ‘baseline’ of corporate performance on the renewable energy ‘cluster’ of variables. The rate of change according to this cluster of indicators was taken as an indicator of the company’s renewable energy capacity improvement.
On this basis Scottish Power, Scottish & Southern Energy and Centrica showed the most significant relative improvements in their renewable energy capacity, including facility planning and investments (if disclosed in corporate reports).
RE improvement (relative to a certain baseline)
0 1 2 3 4 5 6 7 8 9 10
Powergen Innogy EDF Centrica Scottish & Southern
Scottish Power
Relative Level of Performance
WORST BEST
A high score on the renewable energy capacity improvement is the best proxy of corporate ability to actively manage its carbon emissions risks outside ‘direct’ carbon emissions reduction programs (where CDM project investment and/or EU ETS trading would be considered ‘direct’ carbon emissions risk management programs). Therefore, EDF, Innogy and Powergen will find it more difficult to reduce their carbon emissions from power generation due to the difficulties these companies appear to be experiencing in finding and installing new renewable energy capacity. Powergen also showed a poor performance with respect to energy efficiency/energy services improvement. As a result, the company may need to seek carbon credit purchases in the EU emissions trading market and/or international markets to offset its relatively low carbon risk management capacity in the UK. The same conclusion applies to Innogy.
3.2.3.2 Renewable Energy Investment/Planned Renewables Capacity
Due to competitiveness concerns, six companies out of seven did not fully disclose their investments (either current or planned) in renewable energy capacity. Only Scottish & Southern Energy reported on this, detailing a £480 million renewable energy investment for 2004. Although other companies (Powergen and Innogy) disclosed partial investments in various renewable energy programs, Innovest could not directly compare such data. With that in mind, the planned renewable energy capacity was used for benchmarking instead: Innovest considered all disclosed planned capacity weighted by the sporadically available data on renewable energy investments for Scottish & Southern Energy, Powergen and Innogy. When the data on renewable energy investments were not made available, the detailed planned capacity was used in scoring instead.
Scottish & Southern Energy and Centrica scored the highest with respect to the size of new renewable energy capacity under construction (planning) and new renewable capacity investments (where disclosed):
Total renewable energy investments/capacity under construction
0 1 2 3 4 5 6 7 8 9 10 EDF Innogy Powergen Scottish Power Centrica Scottish & Southern
Relative Level of Performance
3.2.3.3 Renewable Obligation Compliance
Scottish Power, Scottish & Southern Energy and Centrica ranked highest with respect to Renewable Obligation (RO) compliance, where Centrica was ranked highest for the combination of RO compliance and RO compliance through the purchase of ‘green certificates’ or Renewable Obligation Certificates (ROCs). The exact modality of estimating this score is described in Figure 11 on the preceding pages. The purchase of ROCs can be deemed important as it promotes further investment in renewables and assists in the development of the ROCs market:
ROC/SROC obligation compliance and compliance through ROC purchases
0 1 2 3 4 5 6 7 8 9 10
Powergen Innogy EDF Scottish & Southern
Centrica Scottish Power
Relative Level of Performance
WORST BEST
Figure 13 - Compliance with RO and Percentage of Compliance through ROCs Purchases
In this case Centrica again received the high score due to its preference for ROCs purchases. The companies contributing heavily to the RO buy-out fund are found towards the lower end of this scoring chart. The scoring here favours ROCs/SROCs purchasing as this strategy is seen conducive to the development of renewable energy independent power producers and to the creation of market liquidity.
At the same time, the cross-company variance with regard to the absolute percentages of ROCs compliance is not large, which is reflected in Innovest’s score distribution, the lowest score for Innogy to the highest score for Centrica. In sum, this means that the UK power sector appears to be making a successful and rather ‘homogenous’ (relatively equal) effort to meet its RO requirements.
3.2.3.4 Green Tariff Programs
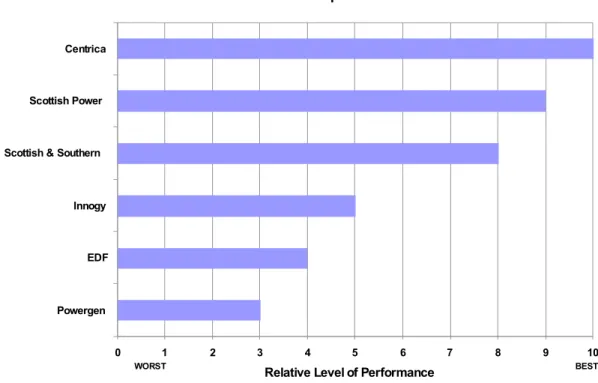
Although ‘green tariff’ programs have decreased in their popularity in the recent years, they remain one of important policy instruments of attracting new electricity customers to renewable energy markets. Innogy and Scottish Power received the highest scores with respect to the size, customer coverage and environmental characteristics of their ‘green electricity tariff’ programs:
Green tariff coverage
0 1 2 3 4 5 6 7 8 9 10
Powergen Scottish & Southern
Centrica EDF Scottish Power
Innogy
Relative Level of Performance
WORST BEST
Figure 14 - Size and Coverage of Green Tariff Programs (2002 - 2004)
Considering that Powergen, Scottish & Southern Energy and Centrica did not report any ‘green tariff’ programs, these companies are assigned the low-neutral score. Effectively, only EDF, Scottish Power and Innogy are ranked on this variable. Innogy comes out as a clear winner due to the large number of customers it managed to attain and retain for its green tariff program managed in cooperation with Greenpeace.
3.2.3.5 Renewable Energy Policies and Strategies
Scottish Power, Scottish & Southern Energy and Centrica topped the list in terms of the comprehensiveness and the degree of integration (with other aspects of CO2 risk management) of their renewable energy policy
Renewable Energy Policy 0 1 2 3 4 5 6 7 8 9 10 EDF Innogy Powergen Centrica Scottish Power Scottish & Southern
Relative Level of Performance
WORST BEST
Figure 15 - Renewable Energy Policy
The above ranking illustrates that SSE, SP and Centrica have the most transparent and complete disclosures on their renewable energy strategies, asset development, customer coverage and linkage of all renewable energy investments to the reduction of greenhouse gas emissions.
3.2.3.6 Combined Heat & Power (CHP) Generation
Innovest could not rank the companies with regard to their CHP capacity (both installed and planned) because such data were not available for the whole sample and also due to the fact that current high gas prices preclude aggressive development of new CHP capacity. As a result, the existing CHP capacity was not installed to address the issue of carbon emissions. Hence, it is difficult to argue that large CHP capacity is a good proxy for corporate carbon risk management.
In order to link CHP assets to carbon emissions reductions, Innovest would need to obtain the data on the planned CHP investments and the planned CHP capacity. None of the interviewed/researched companies released/published this information. In addition, some suggestions were made by interviewees that UK power generators do not regard CHP as a carbon solution when considering their short-term investment cycle due to high gas prices (regardless of the on-going CHP obligation developed by the British government).