e-CALLISTO status report #36
New software version V1.17 released:
A new version has been released. A bug in the sfu-calibration for real-time light curve has been found and solved. But this is only relevant for those who operate a parabolic dish > 5m or an array > 8 antennas. Better defined geometry on start-up for all spectrometer plots. Info window shows disk capacity of data storage instead of application disc. Code available here:
http://www.astro.phys.ethz.ch/astro1/Users/cmonstei/instrument/callisto/ecallisto/applidocs.htm
Recent papers/articles in ADS at http://www.adsabs.harvard.edu/
Fernandes, F. C. R.;Silva, R. D. C.; Sodré, Z. A. L.; Costa, J. E. R.; Sawant, H. S.
Observations of solar radio emissions in meter wavelengths carried by CALLISTO-BR
Silva, R. D. C.; Fernandes, F. C. R.; Selhorst, C. L.
Investigation into solar type II radio bursts recorded by CALLISTO-BR
Zucca, P.; Carley, E. P.; McCauley, J.;
Gallagher, P. T.; Monstein, C.; McAteer, R. T. J.
Observations of Low Frequency Solar Radio Bursts from the Rosse Solar-Terrestrial Observatory
Hamidi, Z. S.; Abidin, Z. Z.; Ibrahim, Z. A.; Shariff, N. N. M.
Indication of radio frequency interference (RFI) sources for solar burst monitoring in Malaysia
New e-Callisto logos released:
Figure 1: New Callisto logos.
Access to png-files here: http://www.e-callisto.org/ See also Callisto-Blog here: http://e-callisto.blogspot.ch/
TRIEST/INAF observatory released a new Callisto website:
http://montebaldo.oats.inaf.it/calendar/callisto.phpINAF provides a copy of their data which is hosted at FHNW (University of applied Sciences Northwestern Switzerland).
Worldwide usage of Callisto data:
In the meantime Callisto information and data archive is accessed from 67 countries, see here: http://www.revolvermaps.com/?target=enlarge&i=8qqauplcxxq&color=aa0000&m=1&ref=null
2012 ISWI & MAGDAS School on Space Science Sept. 17-26 in West-Java, Indonesia
There will also be a Callisto-workshop during this period on 24th of September from 08:00 until 10:00 Information available here: http://iswimagdas2012.dirgantara-lapan.or.id/SunPy
Previously plots from FIT files were mainly produced using SSWIDL. The RAPP-viewer written in Java was never a real alternative because it was not possible to produce high quality plots. And many
observatories unfortunately cannot afford IDL licenses. So, colleagues created a solution based on Python. A lot of time and effort has been spent by the following people. Thank you guys for this wonderful
software tool which is freely available on the internet.
Steven Christe [1], Matthew Earnshaw [2], Peter Gallagher[5], Keith Hughitt [1] [3], Jack Ireland [1] [3], Florian Mayer[4] [5], David Perez-Suarez [5], Albert Shih [1]
[1] NASA GSFC
[2] Imperial College London, UK [3] ADNET Systems
[4] Technische Universität Wien, Austria [5] Trinity College Dublin, Ireland
Installation, configuration as well as some examples can be found here: http://sunpy.readthedocs.org/en/latest/index.html
If you carefully follow the instructions given in the chapter 'Installation' you can get first plots in less than two hours. The Python scripts are very easy to use and they even allow to directly accessing the data archive at FHNW. So you don't need to download the FIT-files first. SunPy is in a draft status, functions are still improved and bugs solved. All tools, applications and scripts are free of charge!
On the following 4 pages you can find some examples which I used for testing the software. There are many more possibilities and we wanted to encourage you to use and test it.
SunPy-example code with direct access to the FHNW-archive:
# Demoplot2
from matplotlib import pyplot as plt from matplotlib import cm
import sunpy
from sunpy.spectra.sources.callisto import CallistoSpectrogram
image = CallistoSpectrogram.read("http://soleil.i4ds.ch/solarradio/data/2002- 20yy_Callisto/2012/07/31/BLEN7M_20120731_171359_25.fit.gz") image = image.linearize_freqs(1) nobg = image.subtract_bg() nobg.plot(cmap=cm.hot,min_=-10) plt.ylabel("Frequency [MHz]") plt.xlabel("Time [UT]") plt.title("Bleien Switzerland") plt.show()
SunPy-example code with access to a local folder: # Demoplot3
from matplotlib import pyplot as plt from matplotlib import cm
import sunpy
from sunpy.spectra.sources.callisto import CallistoSpectrogram
image = CallistoSpectrogram.read("M:\MyPython\BLEN7M_20120813_123000_24.fit.gz") image = image.linearize_freqs(1) nobg = image.subtract_bg() nobg.plot(cmap=cm.spectral,min_=-2 plt.ylabel("Frequency [MHz]") plt.xlabel("Time [UT]") plt.title("Bleien Switzerland") plt.show()
SunPy-example code with access to a local folder:
#Demoplot4
from matplotlib import pyplot as plt from matplotlib import cm
import sunpy
from sunpy.spectra.sources.callisto import CallistoSpectrogram
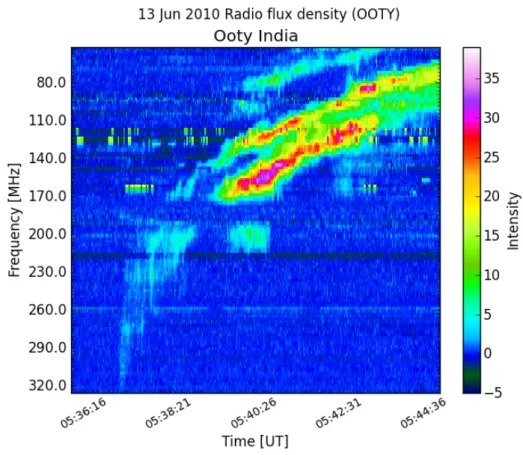
image = CallistoSpectrogram.read("M:\MyPython\OOTY_20100613_053001_58.fit.gz") image = image.linearize_freqs(1) nobg = image.subtract_bg() nobg.plot(cmap=cm.gist_ncar,min_=-5) plt.ylabel("Frequency [MHz]") plt.xlabel("Time [UT]") plt.title("Ooty India") plt.show()
SunPy-example code with image manipulation (combine Ooty and Gauribidanur):
# Demoplot5
from matplotlib import pyplot as plt from matplotlib import cm
import sunpy
from sunpy.spectra.sources.callisto import CallistoSpectrogram
image1 = CallistoSpectrogram.read("M:\MyPython\OOTY_20100613_053001_58.fit.gz") image2 = CallistoSpectrogram.read("M:\MyPython\OOTY_20100613_052959_59.fit.gz") image3 = CallistoSpectrogram.read("M:\MyPython\GAURI_20100613_052959_59.fit.gz") image = (image1*2 + image2 + image3*3)/6 # need the same time- & frequency range!!! image = image.linearize_freqs(1)
nobg = image.subtract_bg()
nobg.plot(cmap=cm.gist_ncar,min_=-5) plt.ylabel("Frequency [MHz]")
plt.xlabel("Time [UT]")
plt.title("(2*Ooty_Lin1 + Ooty_Lin2 + 3*Gauribidanur)/6") plt.show()
Figure 4: Mathematical manipulation of observations from different locations to improve SNR (bursts are correlated) and to reduce rfi (rfi is not correlated between Ooty and Gauribidanur).