Abstract— The performance in terms of signal-to-interference ratio (SIR), teletraffic, and spectral efficiency of a combined macrocellular and microcellular network is investigated when either both types of cells share the same channel set, or when the channel set is partitioned between the macrocells and the mi-crocells. The analysis is for time-division multiple access (TDMA) with frequency hopping, power control, and discontinuous trans-mission, and the radio channel is composed of an inverse fourth-power path loss law with log-normal fading. We commence by introducing a single microcell into a hexagonal cluster of macrocells before considering clustered microcells. Both omni-directional and sectorized cells are examined. We find that high reuse factors are required when channel sharing is employed. When channel partitioning is used, no co-channel interference occurs between the microcells and the macrocells allowing them to be planned independently. The reuse factors in the microcells and macrocells therefore do not need to be increased beyond conventional values. The outcome is that by opting for channel partitioning, the improvement in spectral efficiency compared to channel sharing is two to three times greater.
Index Terms—Co-channel interference, land mobile radio cel-lular systems, time division multiaccess.
I. INTRODUCTION
T
HE microcellular concept and its implications for cellular telecommunications in urban areas have been widely un-derstood for some time [1]–[3]. Using low antenna elevations allows the cell size and radio interference to be restricted using the shielding effects of the surrounding buildings [4]. This allows low power base stations to be employed, resulting in large increases in capacity made available by smaller frequency reuse distances. The disadvantage is the difficulty of connecting microcellular base stations into the cellular networks.A successful public cellular communications network has an evolutionary growth. In the early stages of rollout, when there are few subscribers, the most important factor is radio coverage. This is achieved by using large cells that may
Paper approved by J. Chuang, the Editor for Wireless Networks of the IEEE Communications Society. Manuscript received April 1, 1997; revised February 9, 1998 and September 4, 1998. This work was performed as part of the LINK Personal Communications Programme project PC-2010 “Microcells for Third Generation PCN,” and was supported by the U.K. Department of Trade and Industry, and the Engineering and Physical Sciences Research Council, together with the other project participants.
R. Coombs is with Multiple Access Communications Ltd., Chilworth Research Centre, Southampton SO16 7NS, U.K.
R. Steele is with the Department of Electronics and Computer Science, Uni-versity of Southampton, Southampton SO9 5NK, U.K. He is also with Multi-ple Access Communications Ltd., Chilworth Research Centre, Southampton, SO16 7NS, U.K.
Publisher Item Identifier S 0090-6778(99)03312-7.
be sectorized to provide adequate signal-to-interference ratios (SIR’s). As the subscriber base increases, the cells are made smaller, although the base station (BS) antennas continue to be sited on the tops of tall buildings or at high terrain elevations. Cell splitting and a host of other techniques may be introduced, such as switchable beam antennas and underlay–overlay tech-niques to increase capacity. When this plethora of capacity enhancing procedures fail to satisfy the increasing teletraffic loading, microcells are introduced.
The current situation in most cellular networks is that in city centers, the conventional size cells, often called macrocells, are small, i.e., only 500 m to 2 km across. However, the base station antennas are usually on the roofs of tall buildings. Single microcells, rather than clusters of them, are being introduced to accommodate teletraffic hot-spots. The microcel-lular base station antennas are usually located at some 6–9-m height and attached to walls or mounted on the roofs of low buildings. The operators appreciate that eventually the isolated microcells will be expanded into clusters and the microcellular clusters tessellated. Macrocellular sectors will oversail the microcellular clusters, providing coverage in microcellular radio dead-spots, and assisting handovers when candidate mi-crocells have no available channels [5]. A number of combined microcell/macrocell architectures have been examined in the literature. For example, Wang et al. [6] propose a novel way to share spectrum by rotating the sectors of the macrocells in adjacent clusters, enabling a number of co-channel microcells to work in reduced interference microareas. I et al. [7] compare four systems—two using CDMA in the macrocells and TDMA in the microcells and vice versa, and two employing TDMA with either frequency partitioning or time partitioning.
An important question for operators is whether the mi-crocells and the mami-crocells can ultimately reuse the same frequencies, or is it advisable to partition the frequency band such that the macrocells and microcells have their own unique set of channels? The frequency-shared approach is often favored initially, as the transition to a partitioned network involves a temporary reduction in capacity, as radio carriers must be removed from the macrocells to assign to the new microcells. However, the frequency-shared approach may not be the best long term solution, and this paper seeks to answer this question. Our discourse is concerned with a TDMA system having fixed channel allocation (FCA), but the results have value in the design of dynamic channel allocation (DCA) algorithms.
The remainder of the paper is arranged in six sections. In Sections II and III, the SIR of isolated microcells and
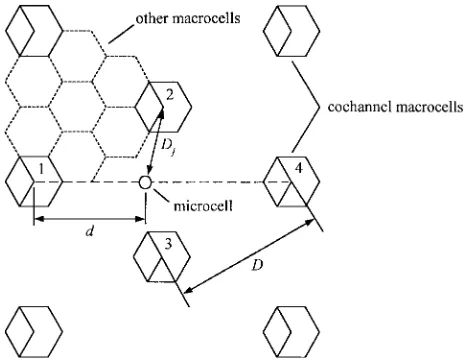
Fig. 1. Hexagonal macrocells with a co-channel microcell introduced.
microcell clusters is calculated when they attempt to share channels with surrounding macrocells. In Section IV, the impact of the microcells on the existing macrocell layer is explored. In Section V, we examine the frequency planning of a network having a combination of microcells and macrocells that share the same channels. The teletraffic capacity and spec-tral efficiency of both partitioned and frequency-shared arrangements is calculated and compared in Section VI. Finally, our conclusions are given in Section VII.
II. THESIROF ASINGLEMICROCELL WHENINTRODUCED INTO AMACROCELLULARNETWORK
The generally accepted model for the analysis of macro-cellular systems is based on hexagonally shaped cells. While true hexagonal cells are not achievable in practice, they do provide a cellular structure that is convenient to analyze and enable the performances of different systems to be compared. For hexagonal cellular clusters, the frequency reuse distance
between co-channel cell sites is related to the distance between its cell site and its cell apex and to the cluster size by the expression [8]. For a contiguous layer of tessellated hexagonal cells, there are always six co-channel cells spaced evenly around any given cell at the reuse distance If the cells are omnidirectional, interference is received from all six cells, while the introduction of sectorization with three sectors per cell reduces the number of significant interfering cells from six to two due to the use of directional antennas. In both cases, the mean SIR at the base station (BS) and at the mobile can be calculated as a function of the cluster size.
We begin by introducing a single microcell into a hexag-onal macrocellular structure, and investigate the SIR that the microcell experiences, namely, SIR , as a function of its position relative to the existing co-channel macrocells. The arrangement is shown in Fig. 1, where the co-channel macrocells are shown with solid borders and the microcell is shown as a small circle. The microcell uses the same channel set as the macrocell sectors shown, and consequently suffers significant co-channel interference from different macrocell sectors, depending upon its position. The microcellular base
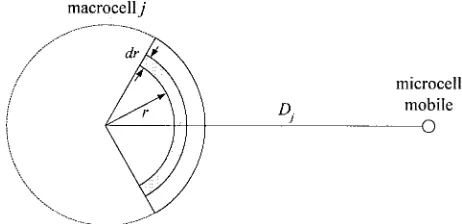
Fig. 2. The arrangement used to calculate interference on the microcell uplink.
station experiences interference from the mobiles using the same channels in the surrounding macrocells, while for the mobiles in the microcell the interference comes from the macrocellular base sites. The interference received in the microcell and the resulting SIR will now be calculated using the method given in [9].
A. Interference on the Microcell Uplink
For the uplink, the arrangement shown in Fig. 2 is used to calculate the interference received at the microcellular base station due to the surrounding co-channel macrocells. The reuse distance, , as shown in Figs. 1 and 2, is the distance between the microcell BS and the th macrocell BS. It is a function of the macrocell reuse distance , and is the point where we locate the microcell. At this stage, it is not necessary to define a size or shape for the microcell. The use of perfect power control allows us to position an isolated microcell base site, or mobile, and use it as a test probe to measure the received interference. The wanted signal power received at the test point is assumed constant irrespective of the distance between the microcell BS and its mobile. Macrocell BS receives a signal of constant power from its communicating mobile. In order to achieve this, the mobile must vary its transmitted power according to its distance from the BS and to the current local shadow fading being experienced. The shadow fading is described, in decibels, by a random variable having a normal distribution. The power received at the base site is
(1)
where is the path loss exponent. The transmitted signal from the mobile in the th macrocell causes interference at the microcell BS, which is using the same channel to receive signals from its own mobile. The interference power received at the microcell BS from the mobile in macrocell is
(2)
where is another log-normal random variable representing the shadow fading on the interfering path, and is the distance from the microcell BS to the interfering mobile in the macrocell. The distance is given by
[image:2.612.315.552.60.173.2]Fig. 3. The arrangement used to calculate interference on the microcell downlink.
where is the angle between the edge of the macrocell sector and a line joining the macrocell and microcell base sites. For a frequency hopping system, the interference experienced on each hop is different. If there is a sufficient number of carriers to provide a long hop sequence, and assuming that users are uniformly distributed over the cell area, we may use the mean interference. The probability density function (PDF) of the mobile position in the area is , where is the sector boresight angle ( for omnidirectional macrocells). An approximation has been introduced here, since we have used a circular cell rather than a true hexagonal cell for simplicity. Notice that the of the circular cell is essentially the same as the of a hexagonal cell. The mean interference power received from mobiles in sector is obtained by integration over the macrocell sector area as follows:
(4)
The interference expression can be simplified by normalizing to the macrocell radius, using
(5)
where means the expected value of . The derivation of is given by Lee and Steele in their appendix [6]. For and with standard deviations of 8 dB, the expectation of is 8.3, taken between the limits
to .
B. Interference on the Microcell Downlink
The interference on the microcell downlink can be cal-culated by replacing the microcellular BS with a mobile in the same position. The arrangement is shown in Fig. 3. Each mobile receives a signal of constant power from its respective communicating BS. The transmitted power from the th macrocellular BS is
(6)
and its mean transmitted power is obtained by integration over the area of the macrocell sector, assuming that the mobiles in
This transmitted power manifests itself as interference to the mobile using the same channel in the microcell if the microcell is within the coverage angle of the macrocell sector. The mean interference power received from the macrocellular BS is given by
(8)
where is the distance from the th macrocell BS to the microcell mobile. The shadow fading expectation is exactly the same as that used for the uplink.
C. SIR in the Microcell
Having calculated the interference received at the microcell from each macrocell on both the uplink and the downlink, the SIR is found by taking the ratio of the received power to the sum of the interference from the significant four interfering macrocells, viz.,
SIR (9)
[image:3.612.342.555.69.156.2]The interference components are weighted by the factor , the mean voice activity factor (VAF) or mean proportion of time for which active users are actually speaking. This can be used to model the effects of voice activity detection (VAD) and discontinuous transmission (DTX). A typical value of is 0.4, resulting in a uniform increase in SIR of 4 dB. For all the calculations to follow, we have not used VAD/DTX, and so we have set .
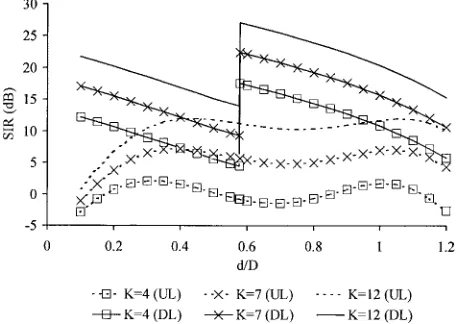
Fig. 4 shows how SIR varies as we change the location of the microcell along the horizontal line between macrocells 1 and 4 in Fig. 1, using omnidirectional macrocells. Both the uplink and downlink SIR values are shown for cluster sizes, , of 4, 7, and 12. A path loss exponent of four and a slow fading standard deviation of 8 dB were used on all links. The microcell position has been normalized to the macrocell reuse distance, so that corresponds to the midpoint of the four-macrocell arrangement for any macrocell cluster size. Further investigation showed that the inclusion of interference from macrocells outside the nearest four in the calculation has a negligible effect on the results.
Fig. 4. SIR on the microcell uplink (UL) and downlink (DL) versus micro-cell position between omnidirectional macromicro-cells with cluster sizeK.
Fig. 5. SIR on the microcell uplink (UL) and downlink (DL) versus micro-cell position between sectorized macromicro-cells with cluster sizeK.
between the microcell and the existing macrocells at this stage, so all we are really doing is reducing the reuse distance in a localized area. The two peaks in SIR in Fig. 4 correspond to the center points of the two equilateral triangles formed by
the macrocells, at positions and .
For a given macrocell cluster size, the SIR experienced on the microcell downlink is higher than that on the uplink. This is because the sources of interference are fixed points rather than randomly placed mobiles, so there is less variation in the distances between the receiver and the interferers. This difference is at a minimum at each of the SIR peaks and amounts to 3.6, 1.9, and 1.1 dB for cluster sizes of 4, 7, and 12, respectively. It becomes less significant with increasing cluster size because the reuse distance increases relative to the variation in position of the interfering mobiles.
The SIR at a microcell positioned between sectorized macrocells is shown in Fig. 5. The macrocell sectors have a width of 120 and are oriented as shown in Fig. 1. The SIR on the downlink is improved significantly over the previous arrangement using omnidirectional macrocells for each cluster size and is above the minimum requirement of 12 dB over most or all of the area for all three cluster sizes. The sharp
discontinuity in the curve corresponds to the point at which the position of the microcell is moved from the area illuminated by sectors 2 and 3, at the point . We have assumed that the directional antennas used here have an infinite front-to-back ratio, so in practice the sharp discontinuity will be replaced by a more gradual change in SIR . This is because the operational antennas are not perfect, and some of the signal will be radiated outside the sector through the antenna sidelobes, or indirectly through reflection and diffraction around buildings and other features of the sector.
The uplink is only slightly improved over the previous arrangement, and is significantly worse than the downlink. It will therefore represent the limiting factor when a microcell is sited. For and , the uplink SIR is insufficient for most current systems, while even for , the SIR only attains a maximum of 11 dB. The double peak of the uplink curve is now no longer exactly symmetrical, since the calculations are based on circular wedge-shaped sectors rather than true rhombuses. The orientation of the macrocell sectors in this arrangement can significantly affect the SIR experienced in the microcells, resulting in small variations of the microcell uplink SIR, but more significant variation of the downlink SIR. This is because the interference comes from different macrocell sectors according to their orientation relative to the microcell. This results in SIR curves with discontinuities of different sizes and at different microcell positions.
The SIR model we have used assumes the propagation characteristics of the macrocells and microcells are the same. In practice, however, the path loss and shadow fading may differ considerably. In microcells, a two slope path loss char-acteristic is common [10]–[14]. The path loss in urban areas is found to resemble free space propagation close to the microcell base site. Beyond a certain breakpoint distance, however, the path loss is found to increase rapidly and often has a steeper gradient than the inverse fourth power law that we have used. This indicates that the SIR calculated for the microcell uplink is somewhat pessimistic. Indeed, Dehghan and Steele [15] have found that the interference between macrocell mobiles and co-channel microcell base sites is much less significant than between microcell mobiles and macrocell base sites.
The log-normal shadow fading in microcells is generally less severe than in macrocells [16]. By reducing the shadow fading standard deviation from 8 to 4 dB on links involving the microcellular BS, the expectation is reduced to 4.06 and the SIR on the microcell uplink and macrocell downlink is improved by 3 dB.
When sectorized macrocells are employed, the directional sector antennas will often have a higher gain than the microcell BS antennas, which may be omnidirectional. This means that mobiles in the macrocells will transmit at a lower power for a given MS/BS separation than the mobiles in the microcells. This reduces the interference at the microcell BS further.
III. THE SIROF A MICROCELLULARCLUSTER WHE PLACED IN A MACROCELLULAR NETWORK
[image:4.612.54.284.286.448.2]upon the arrangement of the roads and buildings surrounding the base sites [4]. We will arrange for the size of the microcells and the size of the macrocells to be related by the factor viz.,
(10)
where is the microcell radius and is the macrocell radius. Each microcell will experience co-channel interference from up to six other microcells at the microcell reuse distance, where is the microcell cluster size. The interference between co-channel microcells can be calculated using the equations set out in Section II, with omnidirectional microcell base sites. The macrocell radius is replaced with , and the interference distance between co-channel microcells is now
(11)
To maintain a large separation between the co-channel mi-crocells and mami-crocells, the mimi-crocells must be significantly smaller than the macrocells. Normalizing the modified interfer-ence expressions using shows that the microcellular interference is independent of The microcell base site receives a constant mean level of interference from the co-channel microcells for a given cluster size, irrespective of their relative size.
The interference on the microcell downlink will vary slightly with position as the mobile moves within the cell. As we have now defined a size and shape for the microcell, it is perhaps more appropriate to compute the mean interference received over the microcell area. This is calculated by averaging over all possible mobile positions within the victim microcell, namely,
(12)
[image:5.612.317.548.56.244.2]where is the interference received from the th interfering microcell as a function of mobile position. The total co-channel interference from the microcells is Equation (12) is also used for calculation of the mean interference from the macrocells by substitution of the appropriate macrocell interference expression. The SIR for the microcell in this arrangement is calculated using the total interference received from the four significant co-channel macrocells and the six
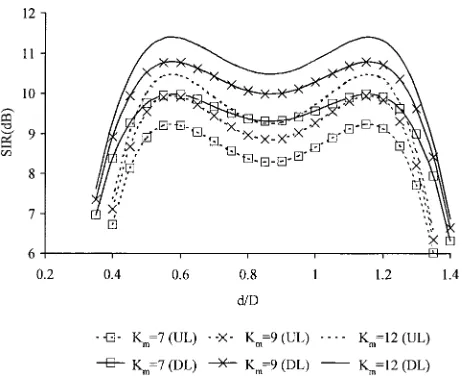
Fig. 6. SIR on the uplink (UL) and downlink (DL) in a clustered microcell versus microcell position between omnidirectional macrocells with cluster size
K = 12 and = 0:1:
significant co-channel microcells:
SIR (13)
where and are the interference components due to the macrocells and microcells, respectively (the notation has been changed here to distinguish between the two cell types). The interference components are independent of but will vary with because the microcell size governs how close its mobiles may wander relative to the co-channel macrocells. The microcell group is positioned between the macrocells in the same manner as shown in Fig. 1, and the SIR is calculated for one microcell in the group. The microcell SIR is shown in Fig. 6 as a function of position, for different microcellular cluster sizes, with a macrocell cluster size of 12 and
In all cases, the path loss exponent is four and the shadow fading distribution has a standard deviation of 8 dB. As the microcell cluster size is increased, the co-channel interference received from the other microcells becomes less significant. The SIR therefore approaches that experienced by a single microcell deployed in tessellated macrocellular clusters. By comparing Figs. 4 and 6, it can be seen that the SIR for the clustered microcell is worse than that experienced by an isolated microcell in the same position by more than 1 dB on both the uplink and downlink, until the microcell cluster size is equal to or greater than the macrocell cluster size.
sizes required are essentially the same for both omnidirec-tional cells and sectorized cells. This is because the mobiles are omnidirectional, so the microcell uplink is influenced by the different shape of the macrocell sectors and not by the orientation of the base sites. Typical reuse factors for conventional macrocells are seven for omnidirectional cells, and four for sectorized cells. It is clear that these values need to be increased considerably to accommodate the co-channel microcells, to an extent that would probably not be considered feasible in a practical situation.
IV. IMPACT OFMICROCELLS ON THEMACROCELLSIR
It is important not only to consider the SIR for the microcells introduced to the system, but also to quantify the effect that they will have on the existing macrocell SIR values. We now consider the effect on the SIR in one macrocell when a single microcell is introduced nearby. The macrocell is surrounded by six co-channel macrocells at the reuse distance and the co-channel microcell at a distance of The microcell is as defined in the previous section, hexagonal, with a radius of The interference on the macrocell uplink is calculated in the same way as that for the microcell in Section II, using the combined interference from the six omnidirectional macrocells and the microcell, or from two sectors and the microcell. On the downlink, the interference can vary significantly with mobile position within the macrocell, so a worst case position is chosen, namely at the macrocell perimeter, nearest to the interfering microcell. Fig. 7 shows the effect of the microcell position and its size on the macrocell SIR, for an omnidirectional macrocellular cluster size of seven
and microcell sizes with and
The distance from the macrocell BS to the microcell BS is normalized to the macrocell radius It can be seen that for a microcell with the macrocell uplink SIR is not significantly degraded even when it is placed quite close to the microcell. On the downlink, the SIR degradation is less than 1 dB for distances greater than approximately For a microcell with one-half the radius of the macrocells,
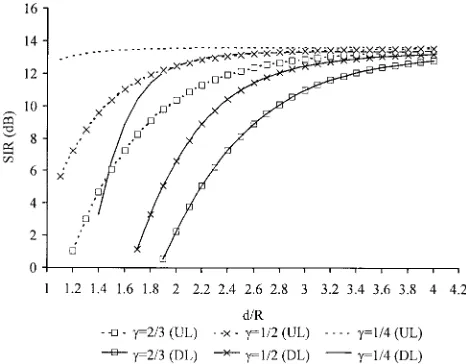
[image:6.612.314.547.59.241.2]the uplink SIR is degraded by approximately 1 dB when it is placed at a distance of or more away, while the downlink requires a separation of for the same SIR degradation. A larger microcell with requires separations of approximately and for SIR degradations of less than 1 dB on the uplink and downlink, respectively. For sectorized macrocells, using 120 sectors, a similar set of SIR curves can be obtained. The SIR characteristics are very similar to those of the omnidirectional case, although the microcell size has a greater effect on the sectorized macrocell. For low , the downlink SIR is lower than that on the uplink, but as increases, the downlink and uplink SIR become approximately equal. This is in contrast to the earlier microcell SIR calculations where the uplink proved to be the limiting factor in positioning the microcell. This is because the mobile in the macrocell can move within a large area relative to the size of the microcell, and therefore experiences a greater variation in received interference. This gives us a crude guideline for the upper limit on the size of our microcells, and for how close they can be placed to the macrocells.
Fig. 7. SIR on the uplink (UL) and downlink (DL) of an omnidirectional macrocell with a microcell introduced nearby. The microcell proximity is given byd=R and its size is given by .
V. FREQUENCY PLANNING
The frequency planning exercise is significantly more com-plex in a network with macrocells and microcells in a shared channel arrangement. We have seen that the SIR in the microcell deteriorates rapidly as it is moved toward a co-channel macrocell, resulting in a minimum separation between the microcell and macrocell at which the microcell SIR is just useable. By examining the SIR curves computed in Section III and assuming a minimum SIR of 12 dB, the minimum distance was found to correspond to approximately This is approximately constant for all the combinations, since a tradeoff is introduced between the microcell and macrocell reuse factors. The SIR characteristic is therefore similar in each case, with small variations caused only by the discrete nature of the cluster sizes. Now, microcell clusters in different positions must use different radio carriers according to which macrocells they are close to. Consequently, the localized reuse factor in the microcells is less than the global reuse factor governed by the macrocells. Using an approximate method based on area, we can calculate the number of carriers required to enable contiguous microcells to be deployed. The carriers used by a particular group of co-channel macrocells can be used by a microcell as long as it is no closer than the minimum distance to the closest co-channel macrocell. This is illustrated by the shaded area in Fig. 8. The proportion of area that is shaded, or “allowed,” can be calculated by examining the equilateral triangle highlighted in bold:
(14)
Fig. 8. Geometry of the best microcell locations.
TABLE I
NUMBER OFRADIOCARRIERSREQUIRED TORESOURCECONTIGUOUS MACROCELLS ANDMICROCELLS IN AFREQUENCY-SHAREDARRANGEMENT
the number of carriers which must be assigned to each macrocell is shown in Table I, using the cluster size combinations calculated in Section III. The values shown apply equally to omnidirectional or three-sector macrocells (although the carriers will not always divide equally between sectors in a cell).
VI. TELETRAFFIC AND SPECTRALEFFICIENCY
The teletraffic carried by a combined macrocell and micro-cell network can be calculated relatively easily. Continuing with the assumption of hexagonal macrocells and microcells with it can be seen that up to microcells will fit in the area of one macrocell. The tessellated hexagonal microcells do not conform exactly to the shape of the macro-cell, but this is unimportant for the calculation of teletraffic. A typical value of is 0.1, giving room for up to 100 microcells for each macrocell. The capacity of one macrocell spanning the area of 100 microcells is now calculated for GSM. In GSM, each radio carrier supports eight traffic channels. One or more channels in each cell are reserved for use by common channels such as the Broadcast Control Channel (BCCH) [17]. In cells supporting only one carrier, a single channel is used for control; while in cells supporting two, three, or four carriers, it is usual to reserve two channels, and with five, six, or seven carriers three channels are used. Assigning one carrier to each microcell gives seven traffic channels per microcell, and assigning three carriers to the macrocell gives 22 channels in an omnidirectional macrocell, or seven channels per sector in a three-sector macrocell. Using the Erlang-B formula with a
traffic because of the loss of trunking efficiency involved in deploying the three carriers separately and the overhead involved in providing three control channels rather than two in the omnidirectional cell. In both cases, the microcell layer handles 95% or more of the traffic, with the macrocell serving the remaining small percentage. The network will normally be configured such that the macrocell will only be used by a mobile if it moves into an area which is not adequately covered by the microcells, or if a handover or new call request is blocked by a congested microcell.
In order to determine whether a frequency-shared or frequency-partitioned arrangement is best, it is necessary to compute the spectral efficiency of both arrangements. The spectral efficiency of a cellular system is defined as the traffic carried per unit area for the bandwidth available. A convenient measure of spectral efficiency of the combined microcellular and macrocellular networks is in terms of Erlangs/MHz/macrocell area. The capacity of a macrocell over a microcellular layer is given by where and are the traffic carried by macrocell and microcell, respectively, and is the number of microcells per macrocell. In a frequency-shared arrangement, the bandwidth occupied is simply the bandwidth assigned to the macrocells, given by where is the cluster size, is the number of radio carriers assigned to each macrocell, and is the carrier spacing in megahertz. The spectral efficiency, in Erlangs/MHz/macrocell area, is thus
(15)
The spectral efficiency of a partitioned arrangement, in Er-langs/MHz/macrocell area, is obtained by modifying (15):
(16)
TABLE II
SPECTRALEFFICIENCY OF THECOMBINEDMACROCELLS ANDMICROCELLS INFREQUENCY-SHARED ANDFREQUENCY-PARTITIONEDARRANGEMENTS
arrangement, omnidirectional macrocells with and sectorized macrocells with were used. The macrocells all support three carriers each, with one carrier per sector in the sectorized cells. In all cases, each microcell was assigned one carrier. The carried traffic was calculated as above, for a macrocell and 100 microcells, assuming 2% blocking, with an appropriate number of channels reserved for common control channels. The GSM carrier spacing of 200 kHz was used. Comparison of the results shows that the efficiency of frequency partitioning is approximately twice that of frequency sharing when omnidirectional macrocells are used, and 2–3 times greater with sectorized macrocells, for each microcell cluster size. The main reason for the low spectral efficiency in the frequency-shared case is the large bandwidth required to support large macrocell clusters, with several carriers per macrocell. The efficiency of all configurations increases with decreasing microcellular cluster size, indicating that the mi-crocells not only carry most of the traffic, but also govern the efficiency with which it is carried. The frequency-partitioned arrangement allows the microcell and macrocell clusters to be determined independently, maximizing the spectral efficiency in each case.
VII. CONCLUSIONS
The co-channel interference problems of sharing frequen-cies between microcells and existing macrocells have been investigated. Based on the assumptions made, it was found that an isolated microcell could operate under a macrocell layer of cluster size greater than 12. Microcell clusters could not be introduced unless very large macrocell cluster sizes were used. In all cases, the microcell uplink was found to limit the placement of the microcell relative to the co-channel macrocells. The SIR in the macrocell was not degraded significantly by the presence of a microcell provided the microcell had a radius less than one quarter that of the macrocell, and was placed at a distance greater than two macrocell radii away from the co-channel BS. A number of assumptions were made about the propagation characteristics that exist between the macrocell and microcell layers. For the most part, conventional macrocellular cell shapes and characteristics were used. An area for further research exists in the exploitation of the different characteristics of the microcells discussed briefly in Section II. The planning of a frequency-shared arrangement was found to be difficult, with large numbers of carriers required to resource the large macrocell cluster sizes. The frequency planning problem is significantly simplified in the frequency-partitioned arrangement as the
macrocell and microcell layers can be planned independently, using conventional planning techniques. The spectral effi-ciency of both frequency-shared and frequency-partitioned arrangements were evaluated. The partitioned arrangement was found to be two to three times more efficient, due to the smaller macrocell cluster sizes involved. It is concluded that isolated microcells may share macrocell channels under certain circumstances. Implementation of multiple microcells in existing macrocells can only be achieved in a practical situation by employing frequency partitioning.
REFERENCES
[1] R. Steele, “Toward a high-capacity digital cellular mobile radio system,”
Proc. Inst. Elect. Eng., vol. 132, pt. F, no. 5, pp. 405–415, Aug. 1995.
[2] J. Sarnecki, C. Vinodrai, A. Javed, P. O’Kelly, and K. Dick, “Microcell design principles,” IEEE Commun. Mag., vol. 31, Apr. 1993. [3] H. L. Bertoni, W. Honcharenko, L. R. Maciel, and H. H. Xia, “UHF
propagation prediction for wireless personal communications,” Proc.
IEEE, vol. 82, pp. 1333–1359, Sept. 1994.
[4] A. J. Rustako, Jr., N. Amitay, G. J. Owens, and R. S. Roman, “Radio propagation at microwave frequencies for line-of-sight microcellular mobile and personal communications,” IEEE Trans. Veh. Technol., vol. 40, pp. 203–210, Feb. 1991.
[5] R. Steele, J. Williams, D. Chandler, S. Dehghan, and A. Collard, “Teletraffic performance of GSM900/DCS1800 in street microcells,”
IEEE Commun. Mag., vol. 33, Mar. 1995.
[6] L.-C. Wang, G. L. Stuber, and C.-T. Lea, “Architecture design, fre-quency planning and performance analysis for a microcell/macrocell overlaying system,” IEEE Trans. Veh. Technol., vol. 46, pp. 836–848, Nov. 1997.
[7] C.-L. I, L. J. Greenstein, and R. D. Gitlin, “A microcell/macrocell cellular architecture for low- and high-mobility wireless users,” IEEE J.
Select. Areas Commun., vol. 11, Aug. 1993.
[8] W. C. Y. Lee, Mobile Cellular Communications Systems, 2nd ed. New York: McGraw-Hill, 1995.
[9] C. C. Lee and R. Steele, “Signal-to-interference calculations for modern TDMA cellular communication systems,” in Proc. IEE Commun., vol. 142, no. 1, Feb. 1995.
[10] E. Green, “Radio link design for microcellular systems,” British Telecom
Technol. J., vol. 8, no. 1, Jan. 1990.
[11] D. L. Schilling, L. B. Milstein, R. L. Pickholtz, F. Bruno, E. Kanterakis, M. Kullback, V. Erceg, W. Biederman, D. Fishman, and D. Salerno, “Field test experiments using broadband code division multiple access,”
IEEE Commun. Mag., vol. 29, Nov. 1991.
[12] V. Erceg, S. Ghassemzadeh, M. Taylor, D. Li, and D. L. Schilling, “Urban/suburban out-of-sight propagation modeling,” IEEE Commun.
Mag., vol. 30, June 1992.
[13] L. B. Milstein, D. L. Schilling, R. L. Pickholtz, V. Erceg, M. Kullback, E. Kanterakis, D. S. Fishman, W. H. Biederman, and D. C. Salerno, “On the feasibility of a CDMA overlay for personal communications networks,” IEEE J. Select. Areas Commun., vol. 10, May 1992. [14] S. T. S. Chia, “1.7 GHz propagation measurements for microcells,”
Electron. Lett., vol. 26, no. 16, pp. 1279–1280, Aug. 1990.
[15] S. Dehghan and R. Steele, “Small cell city,” IEEE Commun. Mag., vol. 35, pp. 52–57, Aug. 1997.
[16] R. Steele, Ed., Mobile Radio Communications. London, U.K.: Pentech, 1992.
[17] M. Mouly and M.-B. Pautet, Eds., The GSM System for Mobile
in mobile radio.
Mr. Coombs received the John Betts prize for communications in his final year of study. He is an associate member of the Institution of Electrical Engineers (IEE), U.K.
and picture signals. During the summers of 1975, 1977, and 1978, he was a consultant to the Acoustics Research Department at Bell Laboratories in the U.S.A., and in 1979, he joined the company’s Communications Methods Research Department, Crawford Hill Laboratory, NJ. He returned to England in 1983 to become Professor of Communications in the Department of Electronics and Computer Science at the University of Southampton. He is also the Chairman of Multiple Access Communications Ltd., and the Head of the Communications Research Group in the Department of Electronics and Computer Science at Southampton University. From 1983 to 1986, he was a nonexecutive director of Plessey Research and Technology, and from 1983 to 1989, a consultant to British Telecom Research Laboratories. In 1986, he formed Multiple Access Communications Ltd., a company concerned with digital mobile radio systems. He is the author of the book Delta
Modulation Systems (New York: Halsted, 1975), editor of the book Mobile Radio Communications (New York: IEEE Press and Wiley, 1992), coauthor of Source-Matched Mobile Communications (New York: IEEE Press and Wiley,
1995) and author of more than 200 technical publications.
Dr. Steele and his coauthors were awarded the Marconi Premium in 1979 and in 1989, and the Bell System Technical Journal’s Best Mathematics, Communications, Techniques, Computing and Software, and Social Sciences Paper in 1981. He has been a conference and session organizer of numer-ous international conferences, and a keynote speaker at many international meetings. He is also a Member of the Advisory Board of IEEE Personal Communications (the magazine of nomadic communications and computing), and a Member of the Advisory Board of International Journal of Wireless
Information Networks. He is a Fellow of the Royal Academy of Engineering,